


INTRODUCTION
All species exhibit variability in a variety of characters. This variation may range from subtle intraspecific differences in, for example, microhabitat or feeding preferences, to profound differences between groups of individuals. If these differences in morphology and resource use are as pronounced as between biological species, these groups may function as distinct ecological species (Flecker et al. Reference FLECKER, FEIFAREK and TAYLOR1999). Such ecological species within a species are usually present in organisms with complex life cycles (Wilbur Reference WILBUR1980). However, not only between but also within life stages differences between sex, age or size classes can be expected. Larval stages can show huge differences in body size and thus potentially exhibit distinct ecological differences (Alford & Crump Reference ALFORD and CRUMP1982). They further develop or alter morphological structures that may influence resource use and hence promote ecological niche shifts (Seale & Wassersug Reference SEALE and WASSERSUG1979). Last, larvae that undergo complete metamorphoses, just before metamorphosis, often require ecological conditions and resources different to those in earlier stages (Kupferberg Reference KUPFERBERG1997).
Within the range of niche parameters, habitat and feeding preferences were found to be the most prominent niche dimensions differing between age classes, for example in fish (Barriga & Battini Reference BARRIGA and BATTINI2009), insects (Basaguren et al. Reference BASAGUREN, RIANO and POZO2002), snails (Edwards Reference EDWARDS1969) and lizards (Simon & Middendorf Reference SIMON and MIDDENDORF1976). Surprisingly such niche shifts are not well investigated in anuran larvae although they may be highly relevant from an individual, population and ecosystem perspective.
Many anurans have an extended reproductive season, sometimes with multiple breeding periods. Thus tadpoles of many size and age classes may be present in a breeding site. Ecological conditions such as food quality and quantity, influence individuals’ age and size at metamorphosis (Richter-Boix et al. Reference RICHTER-BOIX, LLORENTE, MONTORI and GARCIA2007). These life-history variables are often tightly linked to individual fitness (Berven Reference BERVEN1988, Reference BERVEN1990). The understanding of different ecological preferences between groups of individuals within a population is a prerequisite for understanding population dynamics, as these may be linked to processes such as predation and competition. As tadpoles play a key role in shaping fresh waters by altering algal assemblages, primary production patterns and organic matter dynamics (Flecker et al. Reference FLECKER, FEIFAREK and TAYLOR1999, Ranvestel et al. Reference RANVESTEL, LIPS, PRINGLE, WHILES and BIXBY2004), the understanding of differing functional roles of tadpole size or stage classes is essential for understanding ecosystem processes in these habitats.
The use of stable isotopes of nitrogen (δ15N) and carbon (δ13C) to estimate trophic relations is a well-established method for many taxa (Kelly Reference KELLY2000, Struck et al. Reference STRUCK, VOSS, MUMM and BODUNGEN1998, Reference STRUCK, ALTENBACH, GAULKE and GLAW2002), including amphibians (Caut et al. Reference CAUT, ANGULO, DÍAZ-PANIAGUA and GOMEZ-MESTRE2013, Kupfer et al. Reference KUPFER, LANGEL, SCHEU, HIMSTEDT and MARAUN2006, Trakimas et al. Reference TRAKIMAS, JARDINE, BARISEVIČIŪTĖ, GARBARAS, SKIPITYTĖ and REMEIKIS2011). For nitrogen, ratios of 15N to 14N exhibit stepwise enrichment with trophic transfers, and are powerful tools for indicating trophic position within a food web. On the other hand ratios of 13C to 12C can be used to identify major energy sources (Peterson & Fry Reference PETERSON and FRY1987, Post Reference POST2002). The combination of both isotope signatures is used to determine the trophic niche of an animal (Layman et al. Reference LAYMAN, ARRINGTON, MONTANA and POST2007).
Here we combined ecological methods (microhabitat preferences) and stable isotope methodology (feeding niches), to study potential ecological niche shifts during the larval development of two syntopic West African savanna tadpoles that are morphologically, phylogenetically and ecologically unrelated. We tested the following hypotheses: (1) The tadpoles’ habitats (i.e. microhabitats) differ between developmental stages (i.e. size and stage classes); (2) the feeding niche (i.e. δ15N and δ13C isotopic signatures) of tadpoles differs between different developmental stages; (3) the differences between developmental stages are more pronounced in tadpoles with mouthparts permitting the selection of different nutrient sources (i.e. possessing a mouth with keratinized teeth and jaws; Kassina spp.), than in a purely filter-feeding species without such structures (Phrynomantis microps Peters, 1875); and (4) the differences between developmental stages within each species are more pronounced in a heterogeneous habitat (offering more choices of habitat and food niches) than in a homogeneous habitat (offering less choices).
METHODS
Study site
The Comoé National Park (CNP) in north-eastern Ivory Coast (3°07′–4°26′W, 8°30′–9°37′N) consists of savanna woodland, small forest patches, grassland and gallery forest along rivers (Hennenberg et al. Reference HENNENBERG, ORTHMANN, STEINKE and POREMBSKI2007). During the dry period, from November to March/April, open water normally remains only within larger rivers. During the rainy season a large number of ephemeral savanna ponds are formed. Mean yearly temperature is 26–28°C, and annual rainfall varies between 703 and 1248 mm (Hirschfeld & Rödel Reference HIRSCHFELD and RÖDEL2011). Poilecot (Reference POILECOT1991) gives more information on geography, geology and vegetation of the CNP.
Tadpoles originated from two large temporary ponds. PondHet, locally known as Hyperolius-pond, is comparatively heterogeneous concerning depth and vegetation cover (vegetated and non-vegetated parts). It has a maximum surface of ~50 × 15 m and a shallow shore with a mean depth of 20–30 cm covering most of the bank area, and a maximum depth up to 1 m. During the rainy season the pond is densely vegetated with herbs and grasses at the edge, and with submerged and floating plants in more central parts. Patches without vegetation mainly persist in the centre of the pond. Its surrounding consists of open tree savanna. PondHom, locally known as Aussichtsberg-pond, is more homogeneous. It has a diameter of ~25 m and is predominantly shallow (10–20 cm, max. 50–80 cm), sparsely vegetated (a few grasses growing only at the edges), and its surrounding consists of forest and open tree savanna. For more pond details including tadpole community composition see Rödel (Reference RÖDEL1998) and Rödel et al. (Reference RÖDEL, LAMPERT and LINSENMAIR2006).
Study species
Kassina spp. (Hyperoliidae) and Phrynomantis microps (Microhylidae) were chosen because they were the most abundant tadpoles in all CNP ponds (Rödel Reference RÖDEL1998) and represent two different tadpole morphologies (Rödel Reference RÖDEL2000). Feeding structures of Kassina spp. tadpoles (oral disc comprises: labial papillae, massive keratinized jaws and teeth rows), indicate generalized feeding of small to large food items (Channing et al. Reference CHANNING, RÖDEL and CHANNING2012, Power Reference POWER1926). Their body shape is characterized by high dorsal and ventral fins typical for nektonic and pelagic pond tadpoles (Altig & Johnston Reference ALTIG and JOHNSTON1989). In both ponds three different Kassina species were observed breeding: K. fusca, K. senegalensis and K. schioetzi (Rödel Reference RÖDEL1998). Whereas the last species usually was only present with a few breeding individuals, the first two were very abundant. Unfortunately there are no morphological characters allowing reliable determination of Kassina spp. tadpoles to the species level (Rödel Reference RÖDEL2000, Rödel & Spieler Reference RÖDEL and SPIELER2000). All tadpoles of this genus are therefore herein treated as one artificial taxon Kassina spp. Phrynomantis microps tadpoles are suspension filtering and lack all external oral structures. Their body shape (moderately high ventral fin and lateral eye position) is consistent with their nektonic and pelagic life (Rödel Reference RÖDEL2000, Rödel & Linsenmair Reference RÖDEL and LINSENMAIR1997).
Tadpole sampling
Tadpoles were sampled using the box-method (Heyer et al. Reference HEYER, DONNELLY, MCDIARMID, HAYEK and FOSTER1994, Rödel et al. Reference RÖDEL, GRÖZINGER, PFAHLER, THEIN and GLOS2009), i.e. a metal box (50 × 50 × 50 cm) with open bottom and top was sunk into the ponds substrate, thereby enclosing all tadpoles within an area of 0.25 m2. All tadpoles within the box were sampled by dip-netting and preserved in 5% formalin. Body length (BL) and oral disc width (ODW) of all Kassina spp. and P. microps tadpoles were measured using a stereomicroscope (Wild M5A) with measuring ocular (following McDiarmid & Altig Reference MCDIARMID and ALTIG1999) and staged according to Gosner (Reference GOSNER1960). Subsequently we assigned tadpoles to stage classes: I = Gosner stages 25–30 (free-swimming tadpoles shortly after hatching; isotope values are expected to still reflect egg/mother signatures; microhabitat selection expected to be close to egg deposition places), II = stages 31–35, III = stages 36–40 (II & III; isotope and microhabitat data expected to reflect tadpoles’ biology), IV = stages 41–45 (metamorphic stages; no further change in isotope values expected – stop or decline in feeding activities; habitat change may reflect metamorphosis trade-offs).
Tadpoles were all collected during the core rainy season between 19 May and 26 September 1995 and 7 May and 18 June 1996, respectively. In this period a total of 91 plots (i.e. boxes) of 0.25 m2 were sampled in nine sampling sessions (10 plots per sampling session), at each of the two ponds. The distribution and proportion of the microhabitats within a particular pond did not differ between these sampling periods. Therefore, all sampling periods were pooled for microhabitat analysis.
Microhabitat variables
Three variables were measured for each 0.25-m2 plot: (1) distance to the pond shore (cm), (2) water depth (cm), (3) vegetation density (%; categories in steps of 10%; estimated). Additionally, (4) the number of invertebrate predators (only individuals counted which were large enough to catch and devour tadpoles), i.e. larvae of Anisoptera (dragonfly) and Zygoptera (damselfly), larvae and imagines of Ranatra (water stick-bugs), Nepidae (water scorpions), Belostomatidae (giant water bugs), Dytiscidae (diving beetles).
Feeding niche analysis
From the collected tadpoles we selected a total subset of 101 tadpoles, covering all stage classes, for stable isotope analysis, resulting in smaller subsets for each species, stage group and pond, respectively. For Kassina spp., we analysed a total of 58 specimens (pondHom: I: n = 10; II: n = 8; III: n = 6; IV: n = 2; pondHet: stage group I: n = 11; II: n = 8; III: n = 7; IV: n = 6). For P. microps, we analysed a total of 43 specimens (pondHom: stage group I: n = 8; II: n = 3; III: n = 4; IV: n = 0; pondHet: I: n = 6; II: n = 9; III: n = 9; IV: n = 4). Differences in sample size and the absence of late stages in P. microps from pondHet was due to the absence or low number of particular stages in the overall sample.
The 101 tadpoles were tested individually for their carbon and nitrogen isotope signature. From each individual 300 μg of muscle tissue was extracted from the middle part of the tail axis, and dried for 48 h in a drying oven. Stable isotope analysis and concentration measurements of nitrogen and carbon were performed simultaneously with a THERMO/Finnigan MAT V isotope ratio mass spectrometer, coupled to a THERMO Flash EA 1112 elemental analyser via a THERMO/Finnigan Conflo III-interface in the stable isotope laboratory of the Museum für Naturkunde, Berlin. Stable isotope ratios (15N/14N) and 13C/12C) are expressed in the conventional delta notation (δ15N and δ13C) relative to atmospheric nitrogen (Mariotti Reference MARIOTTI1984) and VPDB (Vienna PeeDee Belemnite standard). Standard deviation for repeated measurements of laboratory standard material (peptone) is generally better than 0.15‰ for nitrogen and carbon, respectively.
Statistical analysis
To test if body size varied with developmental stage, we used non-parametric Kruskal–Wallis tests comparing ranks of body size and oral disc width among four classes of developmental stages. To test the hypotheses that microhabitat variables (i.e. distance to the pond shore, water depth, vegetation density, number of invertebrate predators) varied with developmental stage, we also used Kruskal–Wallis tests comparing ranks of each of these microhabitat variables among four stage classes. All tests were performed separately for each species (Kassina spp. and P. microps), and separately for each breeding pond (i.e. heterogeneous and homogeneous pond). For hypotheses three and four, we then visually compared the results (analyses and figures) for different patterns between species and ponds. All statistical analyses were calculated using PASW Statistics 18 software (SPSS Inc., Chicago).
RESULTS
General results
A total of 8271 tadpoles from 17 taxa was collected in all nine sampling sessions in both ponds. Summarizing both ponds, Kassina spp. (3811 individuals) and P. microps (2059) tadpoles were dominant in all samples. Separating the ponds, in pondHom 3086 Kassina spp. (mean density 136, range 0–323 individuals m−2, calculated from a total of n = 90 0.25-m2 plots) and 1525 P. microps tadpoles (mean density 67, range 0–286 individuals m−2, n = 90) were found. In pondHet 725 Kassina spp. (mean density 32, range 0–53 individuals m−2, n = 90) and 534 P. microps tadpoles (mean density 24, range 0–102 individuals m−2, n = 90) were found. Further tadpole species occurring syntopically were: Sclerophrys maculata (Hallowell, 1854) (Bufonidae), Hemisus marmoratus (Peters, 1854) (Hemisotidae), Hoplobatrachus occipitalis (Günther, 1858) (Dicroglossiadae), Hildebrandtia ornata (Peters, 1878), Ptychadena bibroni (Hallowell, 1845), P. pumilio (Boulenger, 1920), P. tellinii (Peracca, 1904), P. trinodis (Boettger, 1881) (Ptychadenidae), Amnirana galamensis (Duméril & Bibron, 1841) (Ranidae), Phrynobatrachus spp. (Phrynobatrachidae), Leptopelis viridis (Günther, 1869) (Arthroleptidae), Hyperolius concolor (Hallowell, 1844), H. nitidulus Peters, 1875, H. igbettensis Schiøtz, 1963, Afrixalus vittiger (Peters, 1876), A. weidholzi (Mertens, 1938), A. dorsalis (Peters, 1875) (Hyperoliidae) and Silurana tropicalis Gray, 1864 (Pipdae).
Changes in size during larval development
Kassina spp. increased in body size (BL) and oral disc width (ODW) from stage classes I to III (Kruskal–Wallis; BL: χ2 = 43.4, n = 50, P < 0.001; ODW: χ2 = 40.7, n = 50, P < 0.001; Table 1). Phrynomantis microps increased in BL between stage classes I to III and in ODW between stage classes I and II (BL: χ2 = 15.2, n = 18, P < 0.01; ODW: χ2 = 9.6, n = 18, P < 0.05; Table 1). In both species no size (i.e. BL) difference was found between stage classes III and IV.
Table 1. Morphometric variables of tadpoles from a savanna in Côte d'Ivoire that were analysed for isotope signatures (mean ± SD). BL = body length, ODW = oral disc width (following McDiarmid & Altig Reference MCDIARMID and ALTIG1999). Developmental stages according to Gosner (Reference GOSNER1960); stage class: I = Gosner stages 25–30, II = stages 31–35, III = stages 36–40, IV = stages 41–45.
Changes in microhabitat choice during larval development
Kassina spp. showed significant niche shifts during ontogeny (Figure 1). In particular intermediate stages (Gosner stages 31–35) differed from earlier stages (Gosner stages 25–30) in preferring deeper parts of the ponds (PondHom: I = 11.5 ± 7.3 cm; II = 12.5 ± 5.1 cm; III = 11.9 ± 6.6 cm; PondHet: I = 18.7 ± 11.5 cm; II = 19.6 ± 8.6 cm; III = 14.8 ± 9.0 cm; mean ± SD) (Kruskal–Wallis test: PondHom χ2 = 18.0, ntotal = 3169, P < 0.001; PondHet χ2 = 13.9, ntotal = 722, P < 0.01), and those that are more densely vegetated with aquatic plants (PondHom: I = 44.2% ± 30.0%; II = 59.9% ± 24.2%; III = 51.4% ± 24.1%; PondHet: I = 39.6% ± 29.1%; II = 55.8% ± 27.0%; III = 51.1% ± 26.6%) (PondHom χ2 = 71.5, ntotal = 3169, P < 0.001; PondHet χ2 = 39.8, ntotal = 722, P < 0.001). This was consistent between ponds. Early stage classes were associated with high predator abundance in pondHom (I = 10.7 ± 9.1 individuals (ind) m−2; II = 5.9 ± 4.8 ind m−2; III = 6.8 ± 4.6 ind m−2) (χ2 = 53.5, ntotal = 3169, P < 0.001) and low predator abundance in pondHet (I = 5.2 ± 3.6 ind m−2; II = 8.3 ± 3.5 ind m−2; III = 6.0 ± 2.6 ind m−2) (χ2 = 94.2, ntotal = 722, P < 0.001). No difference between stage classes was found for distance to pond edge (PondHom: I = 2.6 ± 3.1 m; II = 2.1 ± 1.9 m; III = 2.4 ± 2.3 m; PondHet: I = 4.3 ± 3.6 m; II = 4.2 ± 3.1 m; III = 3.8 ± 3.4 m) (PondHom χ2 = 1.6, ntotal = 3169, P = 0.45; PondHet χ2 = 0.3, ntotal = 722, P = 0.95).
Figure 1. Microhabitat associations of Kassina spp. from a savanna habitat in Côte d'Ivoire in pondHom (a–d) and pondHet (e–h). Roman numerals indicate developmental stage classes of tadpoles (Gosner Reference GOSNER1960). Shown are median, interquartile range (box), minimum and maximum (whiskers) and outliers (asterisks). Significant differences between stage classes (P < 0.05) in microhabitat choice were found in Kassina spp. for the variables depth, vegetation density and predator abundance in both ponds (all P < 0.01) (Kruskal–Wallis tests).
Phrynomantis microps showed significant ontogenetic niche shifts in all variables (Figure 2). In both ponds, tadpoles of intermediate and later stage classes (Gosner 31–35 and 36–40) were found more distant to the banks (PondHom: I = 2.4 ± 2.5 m; II = 7.7 ± 5.8 m; III = 7.3 ± 4.8 m; IV = 3.9 ± 1.0 m; PondHet: I = 3.8 ± 3.1 m; II = 8.5 ± 4.8 m; III = 9.8 ± 4.1 m; IV = 5.9 ± 3.6 m) (PondHom χ2 = 260.8, ntotal = 1520, P < 0.001; PondHet χ2 = 151, ntotal = 533, P < 0.001), and preferred the deeper parts of the pond in PondHom (I = 11.6 ± 7.4 cm; II = 20.8 ± 6.6 cm; III = 21.3 ± 6.3 cm; IV = 15.0 ± 5.0 cm) (PondHom χ2 = 207, ntotal = 1520, P < 0.001), than early or metamorphing stages. In PondHet tadpoles in very late stages were found predominantly in shallow parts of the pond (I = 23.2 ± 9.5 cm; II = 24.6 ± 7.9 cm; III = 26.5 ± 6.7 cm; IV = 14.8 ± 4.8 cm) (PondHet χ2 = 44.5, ntotal = 533, P < 0.001). Tadpoles of intermediate and later stage classes were associated also with fewer predators, than early or metamorphing stages (PondHom: I = 6.9 ± 3.1 ind m−2; II = 2.7 ± 2.6 ind m−2; III = 1.5 ± 2.6 ind m−2; IV = 5.3 ± 4.9 ind m−2; PondHet: I = 4.7 ± 2.3 ind m−2; II = 3.3 ± 1.8 ind m−2; III = 4.1 ± 2.7 ind m−2; IV = 7.2 ± 4.9 ind m−2) (PondHom χ2 = 217, ntotal = 1520, P < 0.001; PondHet χ2 = 62.7, ntotal = 533, P < 0.001). In PondHom intermediate stages were associated with low vegetation cover (I = 51.1% ± 26.2%; II = 9.3% ± 14.8%; III = 9.7% ± 16.8%; IV = 24.2% ± 19.4 %) (χ2 = 237, ntotal = 1520, P < 0.001), while in pondHet they predominately occurred in densely vegetated areas (I = 19.2% ± 20.1%; II = 37.6% ± 22.5%; III = 51.1% ± 17.0%; IV = 43.0% ± 30.6%) (χ2 = 164, ntotal = 533, P < 0.001).
Figure 2. Microhabitat associations of Phrynomantis microps from a savanna habitat in Côte d'Ivoire in pondHom (a–d) and pondHet (e–h). Roman numerals indicate developmental stage classes of tadpoles (Gosner Reference GOSNER1960). Shown are median, interquartile range (box), minimum and maximum (whiskers) and outliers (asterisks). Significant differences between stage classes (P < 0.05) in microhabitat choice were found in P. microps for all variables in both ponds (all P < 0.001) (Kruskal–Wallis tests). In pondHom no tadpoles of stage class IV were found.
Changes in feeding niche during larval development
Isotopic signatures for δ15N but not δ13C (Figure 3) in Kassina spp. differed significantly between stages classes in pondHet (Kruskal–Wallis; δ13C: χ2 = 4.7 n = 32, P = 0.20; δ15N: χ2 = 9.4, n = 32, P < 0.05), with stage class III being significantly lower in δ15N values (δ13C: I = −23.3‰ ± 1.52‰; II = −22.0‰ ± 0.83‰; III = −21.9‰ ± 0.81‰; IV = −22.6‰ ± 1.72‰; δ15N: I = 6.24‰ ± 0.59‰; II = 6.13‰ ± 0.33‰; III = 5.63‰ ± 0.34‰; IV = 6.59‰ ± 0.55‰; mean ± SD), but not in pondHom (δ13C: I = −22.4‰ ± 1.80‰; II = −20.2‰ ± 1.18‰; III = −19.4‰ ± 1.23‰; IV = −19.1‰ ± 0.29‰; δ15N: I = 7.37‰ ± 0.75‰; II = 7.15‰ ± 1.38‰; III = 7.28‰ ± 1.03‰; IV = 6.88‰ ± 0.13‰) (δ13C: χ2 = 3.3, n = 26, P = 0.35; δ15N: χ2 = 0.8, n = 26, P = 0.86). There were no significant differences between stage classes I, II and IV (post hoc comparisons, Mann−Whitney U-tests; P < 0.05).
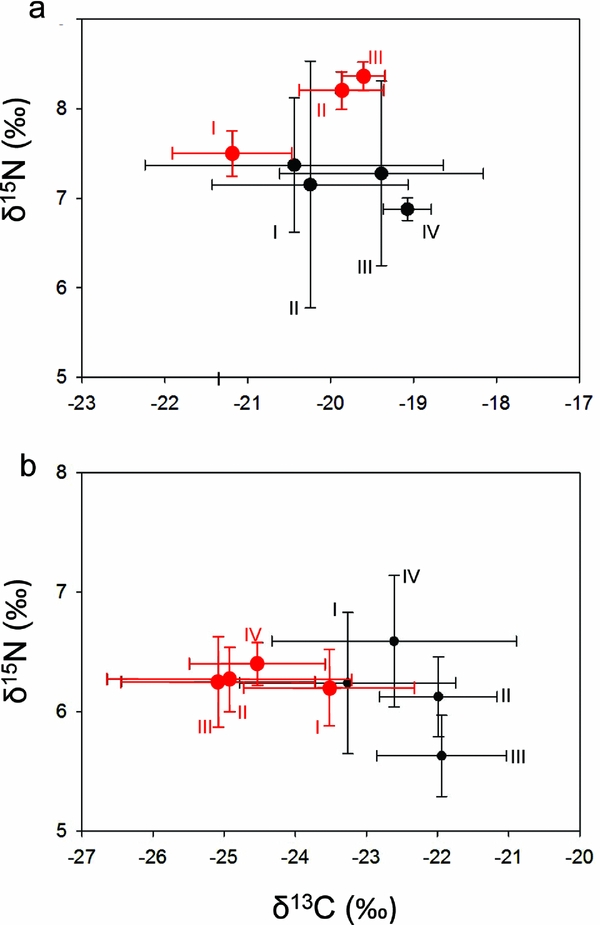
Figure 3. Stable isotope signatures (‰; mean ± SD) of Kassina spp. (black circles) and Phrynomantis microps (red circles) from a savanna habitat in Côte d'Ivoire in pondHom (a) and pondHet (b). Roman numerals indicate stage classes of tadpoles (Gosner Reference GOSNER1960). Significant differences between stage classes were found in Kassina spp. in pondHet (δ15N) and P. microps in pondHom (δ13C and δ15N).
In P. microps, neither δ13C nor δ15N differed significantly between stage classes in pondHet (δ13C: I = −23.5‰ ± 1.20‰; II = −24.9‰ ± 1.72‰; III = −25.1‰ ± 1.36‰; IV = −24.5‰ ± 0.95‰; δ15N: I = 6.20‰ ± 0.32‰; II = 6.27‰ ± 0.27‰; III = 6.25‰ ± 0.38‰; IV = 6.40‰ ± 0.18‰) (δ13C: χ2 = 6.2, n = 28, P = 0.10; δ15N: χ2 = 1.5, n = 28, P = 0.67; Figure 3). In pondHom there were significant differences in both δ13C and δ15N (δ13C: χ2 = 10.6, n = 15, P < 0.01; δ15N: χ2 = 10.8, n = 15, P < 0.01), with stage class I (δ13C: −21.2‰ ± 0.72‰; δ15N: 7.50‰ ± 0.25‰) having significantly lower values than stage class II (δ13C: −19.9‰ ± 0.51‰; δ15N: 8.20‰ ± 0.21‰) and III (δ13C: −19.6‰ ± 0.26‰; δ15N: 8.36‰ ± 0.16‰) in both δ13C and δ15N (post hoc comparisons, Mann–Whitney U-tests; P < 0.05).
DISCUSSION
Food and microhabitat are important dimensions of the ecological niche of an animal, ultimately affecting its fitness. Ontogenetic changes of ecological characteristics within a species such as resource use or spatial and temporal distribution are an important aspect in studies on organisms with either complex life cycles or significant change in morphology or size during development. In larval anurans there is a considerable lack of knowledge on the feeding ecology and trophic status of tadpoles (Altig et al. Reference ALTIG, WHILES and TAYLOR2007). However, it is known that food quality and quantity affect growth and development (Kupferberg Reference KUPFERBERG1997). These are important life-history parameters that affect amphibian fitness, e.g. survival rate, time to and size at sexual maturity, as well as fecundity (Berven Reference BERVEN1988, Berven & Gill Reference BERVEN and GILL1983, Semlitsch et al. Reference SEMLITSCH, SCOTT and PECHMANN1988). Microhabitat choice is important in a physiological context (e.g. temperature-dependent growth and survival), in a nutritional context (when microhabitat is tightly linked to food sources), and in the context of predation (when predation risk differs between different microhabitats). Accordingly, if one or a combination of these factors changes during development then a successive switch in microhabitat preference is to be expected, in order to optimize the physiological, nutritional or predator avoidance requirements.
Here we studied ecological niche shifts during the larval development of two syntopic West African savanna tadpoles that are morphologically, phylogenetically and ecologically unrelated. We demonstrated that the two tadpole species exhibit ontogenetic shifts in two niche dimensions, microhabitat choice and feeding niche (i.e. hypotheses 1 and 2 being confirmed). Tadpoles of generalized oral morphology (Kassina spp.) of intermediate developmental stage (Gosner stages 31–35) and intermediate size were found in deeper and more densely vegetated parts of temporal ponds as compared with both smaller and larger tadpoles. Filter-feeding P. microps tadpoles of intermediate developmental stage (Gosner 31–40) and intermediate size were found in deeper parts and more (in pondHet) and less (in pondHom) vegetated parts of temporal ponds, respectively, as compared with both smaller and larger tadpoles. This shift towards the same general microhabitats in morphologically very distinct species after the first growth phase and towards metamorphosis, respectively, indicates that shifts in microhabitat preferences during ontogeny are independent of tadpole ecotype. Both species showed differences between stage groups in both δ15N and δ13C isotope ratios, however, with no consistent pattern between species or pond types (i.e. significantly lower (δ15N) and higher (δ13C) signatures for medium-sized tadpoles in pondHet and no such difference in pondHom (associated with high variation in the data) for Kassina spp., and significantly lower signatures for both δ15N and δ13C in pondHom and no such difference in pondHet in P. microps). The combination of the two isotopic signatures is used to determine the trophic niche of an animal (Layman et al. Reference LAYMAN, ARRINGTON, MONTANA and POST2007). Although we consider it difficult to relate isotope ratios to detailed food sources, the differences in both species ratios in general indicated some differences in trophic position within a food web (δ15N) and a different use of major energy sources (δ13C) (DeNiro & Epstein Reference DENIRO and EPSTEIN1981, Peterson & Fry Reference PETERSON and FRY1987, Post Reference POST2002).
We consider four possible mechanisms that might be responsible for the observed ecological niche shifts, namely different ecological demands or constraints by different sized individuals, exploitation competition and interference competition as well as size and developmental based predation risk. These mechanisms are not necessarily exclusive. First, different stage or size groups might simply have different ecological and physiological demands and/or constraints, or simply different possibilities to exploit resources from a certain body size on, and therefore different ecological niches. The shift of diet and microhabitat might correspond with a change in feeding ability resulting from an enlargement of the mouth (known from other tadpoles species as gape limitation, see Candioti Reference CANDIOTI2007, and fish, Kawakami & Tachihara Reference KAWAKAMI and TACHIHARA2005) or ontogenetic changes in digestive capabilities (i.e. enzymes; for fish and invertebrates: Andres et al. Reference ANDRES, GISBERT, DIAZ, MOYANO, ESTEVEZ and ROTLLANT2010, Diaz et al. Reference DIAZ, GIMENEZ, VELURTAS and FENUCCI2008), increased swimming ability (Barriga & Battini Reference BARRIGA and BATTINI2009), and the development of sensory organs (Kawakami & Tachihara Reference KAWAKAMI and TACHIHARA2005). Gape limitation is a constraint that may lead to diet shifts with increasing size. It is a more likely explanation for differences between stage and size groups in a generalized tadpole species (Kassina spp.) as this species actively rasps on and bites off either plant or animal matter (Channing et al. Reference CHANNING, RÖDEL and CHANNING2012). Larger and therefore larger-mouthed tadpoles might simply feed on larger and different plants or animals. In contrast, the filter-feeding P. microps tadpoles were not expected to select between different food types but ingest all types of zoo- and phytoplankton although small P. microps might be limited in ingesting large-sized particles. Therefore we expected more pronounced differences in a generalized species than in a filter-feeding one (hypothesis 3). We could not confirm this hypothesis for the dimension microhabitat, however found weak support for the feeding niche (differences in δ15N and δ13C in Kassina spp., and differences in only δ13C in P. microps).
Further, medium-sized tadpoles might be more vulnerable to predators than very small tadpoles or those close to metamorphosis, and therefore prefer deeper and structure-rich microhabitats that offer more possibilities to escape predators and hide from them, respectively. The lower abundance of invertebrate predators associated with intermediate stage classes of tadpoles (Figures 1 and 2) seems to support this hypothesis. Interestingly Kassina spp. tadpoles chose areas with lower predator abundances in pondHet, whereas no such differences could be observed in pondHom. It could be assumed that Kassina spp. tadpoles select a micro-habitat based on a trade-off between food availability (plants) and predation risk in a pond with varying micro-habitats, whereas such choice was not possible in a more or less homogeneous habitat, where the preferred food was only available scattered throughout the pond in low density. In contrast P. microps tadpoles are filter-feeders and thus could select areas with lower predation risk in both ponds.
Finally but not comprehensively, more small tadpoles might be found in shallower microhabitats close to the edge of the pond simply because eggs might preferably be deposited at these sites and tadpoles have not yet chosen or discovered other microhabitats. Similarly tadpoles close to metamorphosis are restricted in their swimming performance and thus often accumulate in shallow parts towards pond banks, or generally prefer these sites because the animals are getting ready to leave the pond. We predicted furthermore that the differences between developmental stages within each species are more pronounced in a heterogeneous habitat (i.e. pondHet) than in a homogeneous habitat (i.e. pondHom) (hypothesis 4), as it is simply offering more choices of habitat and food niches. We did not find this pattern for the dimension microhabitat, however found larger ranges of both δ15N and δ13C signatures between stage groups in Kassina spp. tadpoles (no sufficient data for P. microps), i.e. supporting this hypothesis.
Second, trophic and spatial segregation of tadpole size classes may result from exploitative competition in that feeding activities of large tadpoles probably reduce the density of resources in their preferred feeding areas. Accordingly reduced food availability and/or a reduction in foraging efficiency of small individuals in areas where many large individuals feed might be responsible for the observed pattern. This difference in foraging strategy and related activity patterns could produce a negative association between the small and large size classes, i.e. the observed niche shift. Although we did not test this hypothesis we consider it as reasonable and worth testing as the very high densities of both tadpole species render food competition in this system likely.
Third, the observed niche differences may result from aggressive interactions and subsequent behavioural avoidance between different-sized tadpoles, i.e. from interference competition. Savage (Reference SAVAGE1952) and Wilbur (Reference WILBUR1977) have noted that larger larvae tend to monopolize food resources and actually prevent access of smaller larvae by vigorous swimming movements and butting behaviour (Alford & Crump Reference ALFORD and CRUMP1982), and field observations and laboratory experiments indicate the existence of interference competition in tadpoles (Alford & Crump Reference ALFORD and CRUMP1982). Both types of intraspecific competition (exploitative and interference) as explanation for the observed niche differences in tadpoles are difficult to demonstrate in particular in natural systems with more than two conflicting species (e.g. 17 species in our study system). Both mechanisms are density dependent which is a factor additionally complicating the system.
Whatever the ultimate and proximate reasons for the observed ecological niche shifts might be, our results show that ontogenetic stage is an important factor that should be considered in ecological studies. Individuals of different size and/or developmental stage do behave differently, and therefore the merging of differently developed groups of organisms can lead to the concealment of patterns that might exist for any of these particular groups. This study also demonstrates that applying stable isotope analysis is a valuable and promising approach to address ecological questions in the tadpole study system.
ACKNOWLEDGEMENTS
Analysing and publication of the data was part of the BIOLOG-program of the German Ministry of Education and Science (BMBF; BIOTA-West amphibian projects, 01 LC0410). Research permits were issued by the ‘Ministère de l'Enseignement Supérieur et de la Recherche Scientifique’ and the ‘Ministère de la Construction et de l'Environnement’ of the Republic of Ivory Coast. The field work of MOR was made possible by a scholarship of the German Academic Exchange Service (DAAD). This support is gratefully acknowledged.


