Introduction
Water availability is a major determinant of the structure and composition of tropical dry forests (Engelbrecht et al. Reference Engelbrecht, Dalling, Pearson, Wolf, Galvez, Koehler, Tyree and Kursar2006, Lieberman & Li Reference Lieberman and Li1992). Tropical dry-forest species typically germinate early in the wet season (Khurana & Singh Reference Khurana and Singh2001, Singh & Singh Reference Singh and Singh1991), with wet-season droughts accounting for up to 35% of overall seedling mortality in these systems (Moles & Westoby Reference Moles and Westoby2004a). Future changes in climate, particularly altered rainfall regimes with longer and more intense intra-seasonal droughts thus pose a substantial threat to dry forests (Miles et al. Reference Miles, Newton, Defries, Ravilious, May, Blyth, Kapos and Gordon2006). Since the frequency and intensity of droughts are predicted to increase over this century (IPCC 2013), understanding their effects on young seedlings is crucial to understanding the responses of dry forests to future climate change (Allen et al. Reference Allen, Dupuy, Gei, Hulshof, Medvigy, Pizano, Salgado-Negret, Smith, Trierweiler, Van Bloem, Waring, Xu and Powers2017). Here, we focus on seedlings of Indian dry-forest species and their response to intra-seasonal droughts within the monsoon season when rain occurs every 3–4 d and even 2 wk without rain is a relatively long dry period.
Previous studies report a trade-off between growth and survival rates, where faster-growing species may be more susceptible to mortality, especially when young (Reich Reference Reich2014). Faster-growing species tend to have high specific leaf area (SLA), low stem specific density (SSD) and low leaf dry matter content (LDMC; Wright et al. Reference Wright, Falster, Pickup and Westoby2004), and require more resources including water for survival. Although faster-growing species have a competitive advantage when resources are abundant, they may be more susceptible to mortality when resources are limiting (Wright & Westoby Reference Wright and Westoby2001). In contrast, slow-growing species invest more in durable structural tissues including robust leaves, fine roots and stems (Markesteijn & Poorter Reference Markesteijn and Poorter2009, Wright et al. Reference Wright, Reich, Westoby, Ackerly, Baruch, Bongers, Cavender-Bares, Chapin, Cornelissen, Diemer, Flexas, Garnier, Groom, Gulias, Hikosaka, Lamont, Lee, Lee, Lusk, Midgley, Navas, Niinemets, Oleksyn, Osada, Poorter, Poot, Prior, Pyankov, Roumet, Thomas, Tjoelker, Veneklaas and Villar2010). They have leaves with low SLA and high LDMC, and display low assimilation rates, low hydraulic conductance and reduced transpiration rates, which can be beneficial during drought (Poorter & Markesteijn Reference Poorter and Markesteijn2008, Wright et al. Reference Wright, Kitajima, Kraft, Reich, Wright, Bunker, Condit, Dalling, Davies, Díaz, Engelbrecht, Harms, Hubbell, Marks, Ruiz-Jaen, Salvador and Zanne2006). Similarly, plants with high SSD have thicker cell walls and narrower xylem vessels which limit hydraulic conductance and water uptake, but also increase resistance to cavitation (Hacke et al. Reference Hacke, Sperry, Pockman, Davis and McCulloh2001, Lens et al. Reference Lens, Tixier, Cochard, Sperry, Jansen and Herbette2013), and thus improve survival during drought stress. Besides leaf and stem traits, seed size is positively correlated with seedling survival (Moles & Westoby Reference Moles and Westoby2004a). Larger seeds can nourish seedlings for longer, thereby decreasing the likelihood of mortality of very young seedlings during drought stress (Leishman & Westoby Reference Leishman and Westoby1994).
In this study, we examined the response of dry-forest tree species from the Indian subcontinent to protracted drought. We quantified relative drought tolerance as the survival time in young seedlings, and asked if drought tolerance was negatively related to species’ growth rates under well-watered conditions. Additionally, we asked if drought tolerance and seedling growth could be predicted by key functional traits. We hypothesized that species with larger seeds, low SLA, high LDMC and high SSD would exhibit longer survival times under drought.
Methods
We subjected 3-wk-old seedlings of seven tree species, common to dry forests of peninsular India (Table 1), to protracted drought in a greenhouse experiment at the National Centre for Biological Sciences in Bangalore, India. The greenhouse, with evaporative cooling pads and fans, prevented temperatures from rising above 30°C. Seeds from a local supplier (Suresh Forestry Network, Chikballarpura, Karnataka, India) were soaked in water at room temperature for 24 h, except for Terminalia arjuna which was soaked for 48 h. The 48-h soaking period was chosen based on previous reports of longer imbibition requirements for other Terminalia species (Hossain et al. Reference Hossain, Uddin, Shumi and Ab Shukor2014). Post imbibition, seeds were sown, and allowed to germinate and grow in black polyethylene nursery bags (12.7 cm wide and 17.8 cm tall) filled with a 4:1 mixture of sand and red clay soil.
Table 1. Species used in this study and the codes used in the text as well as relative growth rate (RGR), seed size, seedling height and germination time details for all species. Height and RGR were determined using well-watered controls. All numerical values shown as mean ± SE

Initially, a minimum of 30 newly germinated (i.e. after hypocotyls emerged from the soil) seedlings per species were randomly assigned to one of two treatment groups: drought, and a well-watered control. A total of 213 seedlings were included in this study. Seedlings assigned to the drought treatment received water every day until 21 d post emergence, after which watering was stopped. The control group received water every 1–2 d for the duration of the study to ensure that soils were always moist. To get a measure of soil moisture, a randomly chosen subset (∼33%) of live plants were individually weighed every 7 d. The experiment continued until every individual in the drought treatment died, which occurred within 60 d post-emergence for all species.
Following emergence, we measured seedling height and number of leaves and noted leaf colour (green, yellow or brown) every 3 d. When both leaves and stems on a given plant were no longer green, we determined if it was dead by lightly scratching the base of the stem and noting the colour underneath (Seidel & Menzel Reference Seidel and Menzel2016). Green tissue underneath indicated that the plant was still alive, otherwise it was considered dead and the date of death noted. Subsequently, a final weight measurement of the bag was taken. In addition, a sample (∼60–70 g) of soil was taken from each bag, weighed (±0.01 g) and oven dried at 105°C for 24 h, and the dry weight measured to calculate gravimetric water content of the soil.
Measurement of functional traits
For specific leaf area (SLA) and leaf dry matter content (LDMC) measurements, one fully expanded leaf each from 10 well-watered control plants of each species were taken when they were between 50 and 60 d old. We restricted our sampling to a single leaf per seedling, as many seedlings only possessed a few leaves. To obtain saturated weights of the leaves, fresh leaves were placed with petioles immersed in water for at least 12 h. Subsequently they were weighed and then scanned at a resolution of 300 dpi and their leaf area was estimated using Blackspot software (Varma & Osuri Reference Varma and Osuri2013). To obtain dry weights, leaves were oven dried at 70°C for 72 h and were subsequently weighed. SLA (mm2 mg−1) was calculated by dividing the area of the leaf by its dry weight. LDMC (mg g−1) was calculated by dividing the dry weight of the leaf by its saturated fresh weight. Maximum seedling leaf area was calculated by multiplying the estimated average leaf area (cm2) for each individual by the recorded maximum number of green leaves on each plant.
For stem specific density (SSD) measurements, we used the water-displacement method (Pérez-Harguindeguy et al. Reference Pérez-Harguindeguy, Díaz, Garnier, Lavorel, Poorter, Jaureguiberry, Bret-Harte, Cornwell, Craine, Gurvich, Urcelay, Veneklaas, Reich, Poorter, Wright, Ray, Enrico, Pausas, De Vos, Buchmann, Funes, Quetier, Hodgson, Thompson, Morgan, Ter Steege, Van Der Heijden, Sack, Blonder, Poschlod, Vaieretti, Conti, Staver, Aquino and Cornellissen2013) to measure the fresh volumes of 3-cm-long stem segments clipped 5 cm from the base, from 10 individuals of the well-watered control group for each species. Stems were then oven dried at 70°C for 72 h and their dry weights obtained. SSD (g cm−3) for each individual was calculated by dividing dry weight by volume. Seed size for each species was estimated as the mean ± SE weight of 15 seeds. Finally, we calculated relative growth rate (RGR) using only control seedlings for the interval from 6–42 d post emergence using the following formula:
 $${\rm RGR} = ({\rm ln}{M_2} - {\rm ln}{M_1})/({t_2} - {t_1}) $$
Where, M 1 and t 1 are the plant height and age respectively at time point 1 (6 d old) and M 2 and t 2 are the height and age respectively at time point 2 (42 d old).
Statistical analysis
We used survival analysis to test the effects of species identity on survival time during drought. Kaplan–Meier survival functions were computed for each species, over length of drought (Caesar Reference Caesar2003, Pyke & Thompson Reference Pyke and Thompson1986). Survival functions of the different species were compared using Mantel–Haenszel log-rank tests (Pyke & Thompson Reference Pyke and Thompson1986). The drc package in R (Ritz et al. Reference Ritz, Baty, Streibig and Gerhard2015), was used to generate survival curves for each species and to estimate median survival times, along with 95% confidence intervals for each species.
Pearson’s correlations were used to test for relationships between median survival time and median time to start of senescence, duration of senescence, maximum survival time and height at the beginning of the drought. Additionally, we also checked for relationships of maximum leaf number and maximum height with survival and senescence parameters, to determine if either of these physical traits were predictive of survival and drought resistance. We report only the significant and relevant results from these correlations.
We used generalized linear mixed models (GLMMs) with Gaussian errors (Bolker et al. Reference Bolker, Brooks, Clark, Geange, Poulsen, Stevens and White2009) to first determine if plant functional traits were significant predictors of growth (plant height) in control plants. We looked at growth over the first 6 d when growth is likely to be closely related to available seed resources, as well as growth over the full 42 d of growth measurements. To avoid issues arising from multi-collinearity we only used uncorrelated predictors in the analysis. LDMC was significantly correlated with SSD (Kendall’s τ = 0.57), and was therefore dropped from the analysis. Our final models included SLA, SSD and seed size as fixed effects, and species identity as a random effect. We also normalized (mean = 0, SD = 1) the data for each predictor to simplify model interpretation and facilitate slope comparison between predictors within a model (Schielzeth Reference Schielzeth2010).
We employed a GLMM with Poisson errors (Bolker et al. Reference Bolker, Brooks, Clark, Geange, Poulsen, Stevens and White2009), to determine if plant functional traits were significant predictors of survival time of plants during drought. SLA, SSD and seed size were once again included as fixed effects, and species identity as a random effect.
Finally, to quantify seedling water use and uptake rates, we plotted gravimetric soil moisture as a function of time over the first 12 d of drought for each species. This time period was chosen to capture water use at the early stages of the drought treatments when plant physiology was unlikely to be limited by water, as well as the transition to a water-limited state. Exponential curves were fitted through the soil moisture data to visualize the average water usage of each species.
All statistical analyses were performed, and figures generated in R version 3.3.2. All GLMMs were run using the lme4 package; and marginal R squared (R 2M), and conditional R squared (R 2C) values for GLMMs were generated using the MuMIn package.
Results
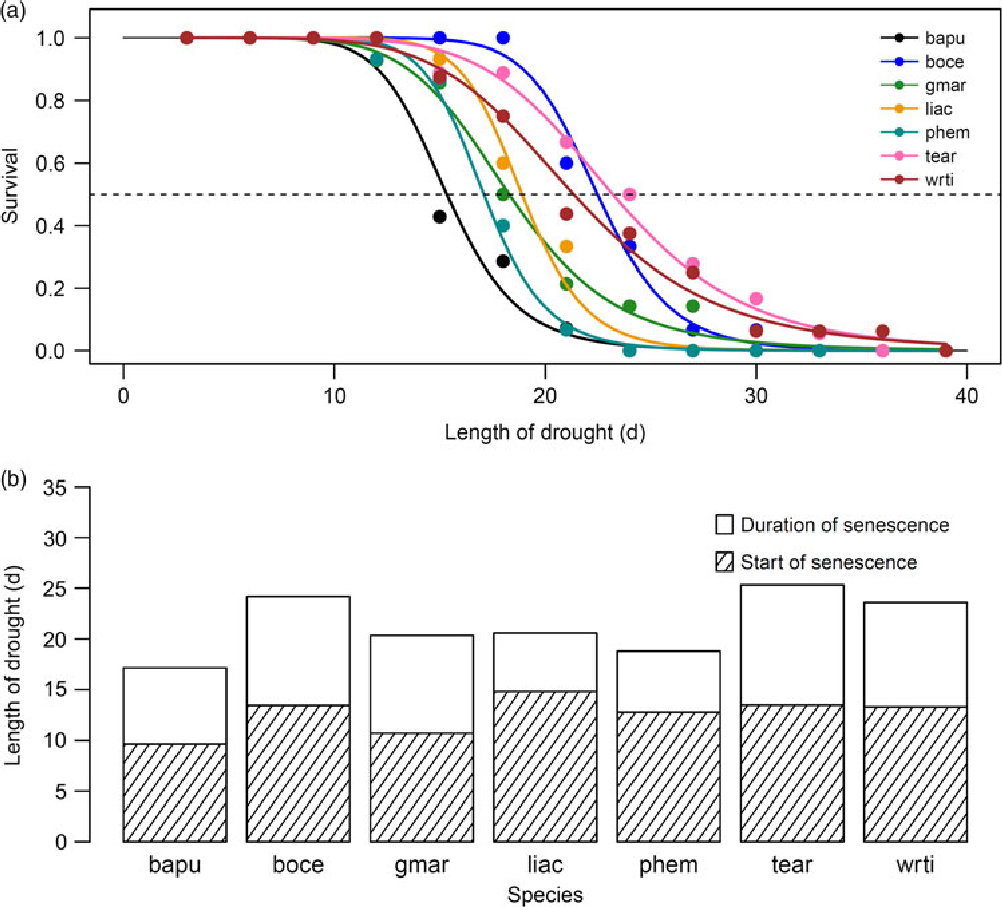
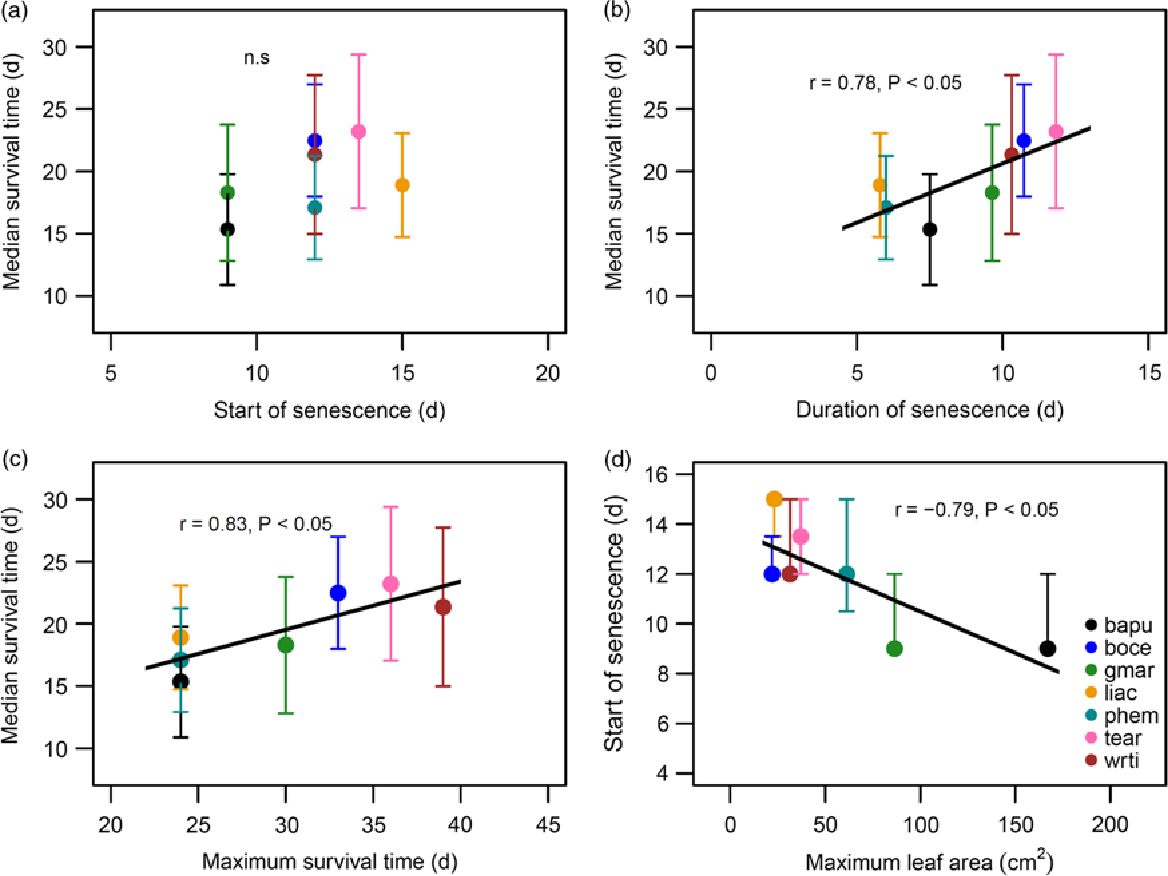
There was considerable variability in the responses of seedlings of the seven species to protracted drought. Median survival time differed significantly, and ranged from 15.3 d in Bauhinia purpurea to 23.2 d in Terminalia arjuna (Figure 1a; significant effect of species in the Mantel–Haenszel log-rank; χ² = 39.4, P < 0.001). The survival time of species includes both the time from the start of the drought until the start of drought-induced leaf necrosis and senescence, as well as the duration of the senescence. The proportion of both of these durations varied between species (Figure 1b). Median survival time for species was not significantly correlated with time to start of senescence (Figure 2a), but was significantly and positively correlated with duration of senescence (Figure 2b; Pearson’s r = 0.78, P < 0.05), and maximum survival time (Figure 2c; Pearson’s r = 0.83, P < 0.05). Additionally, we found a significant inverse correlation between maximum leaf area attained and start of senescence (Figure 2d; Pearson’s r = −0.79, P < 0.05).

Figure 1. Proportion of seedlings growing in a greenhouse in Bangalore, India surviving as a function of time from the start of drought (a). Each species is plotted in a different colour, as shown in the legend, where species are referred to by their four-letter codes which are used throughout the text and figures. Species names and corresponding codes are given in Table 1. The dashed line demarcates 50% survival. Bar plot showing median survival for a each species (b). Each bar is split into the time from the start of drought until the start of senescence (shaded portion), and the duration of senescence until death (unshaded portion).

Figure 2. Correlations between survival parameters of seedlings subjected to drought, within a greenhouse in Bangalore, India. Median survival plotted against time to start of senescence (a), duration of senescence (b), and maximum survival time (c). Time to start of senescence plotted against maximum leaf area (d). Legend provided in (d) contains the species codes corresponding to each colour for all four plots. Species names and corresponding codes are given in Table 1.
Of the functional traits examined, seed size and SLA were significant predictors of growth rates of control (well-watered) seedlings (Figure 3). As expected, species with larger seeds and higher SLA grew faster and were taller, both at the very early stages of growth following germination (6-d old; Figure 3a and b) as well as over longer time periods (42-d old; Figure 3c and d). Overall the fixed effects of seed size and SLA explained 45% of the variation in height of 6-d old seedlings (R 2M = 0.45, R 2C = 0.598), and 68% of the variance for 42-d old seedlings (R 2M = 0.682, R 2C =0.682).
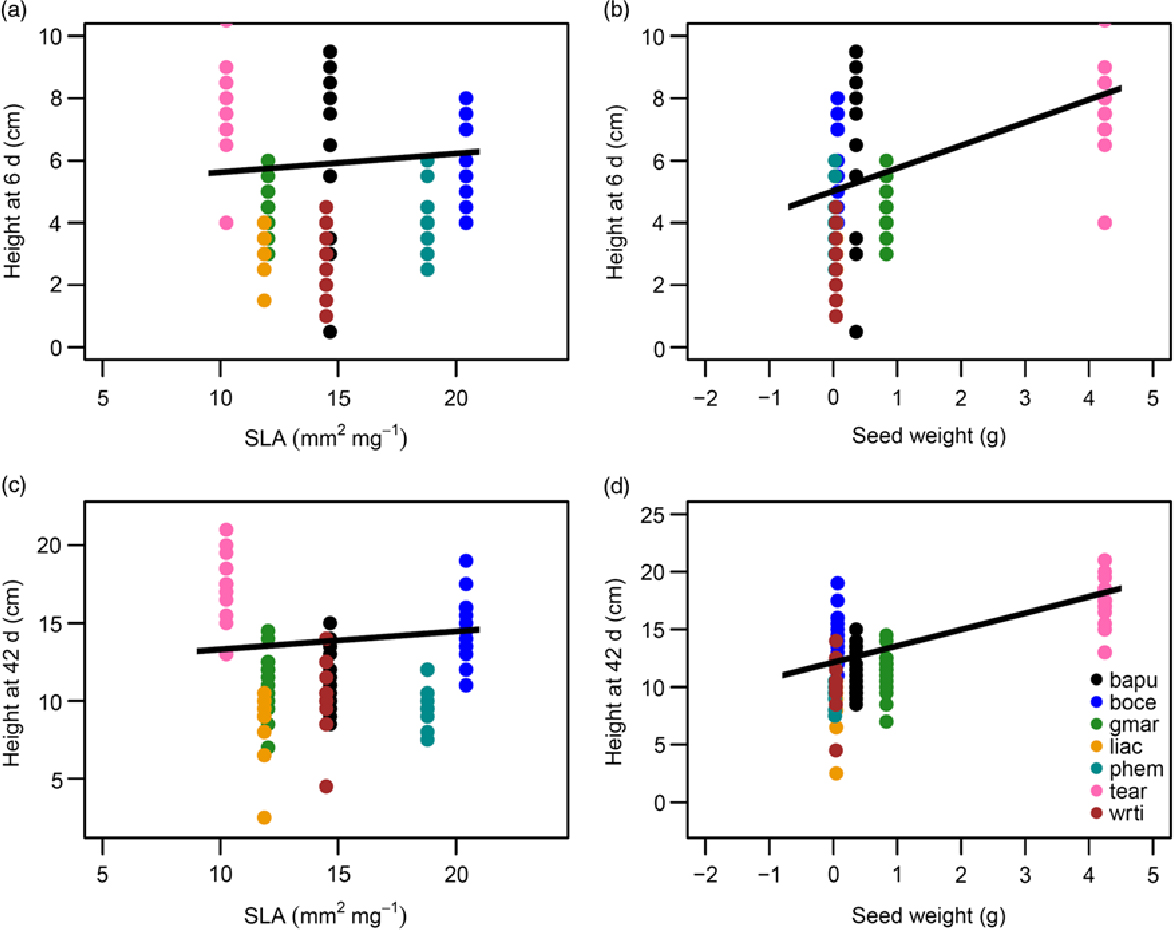
Figure 3. Functional traits as predictors of growth in control or well-watered seedlings in a greenhouse in Bangalore, India: height of seedlings at 6-d of age as a function of specific leaf area (SLA) (a), and seed weight (b). Height of seedlings at 42-d of age as a function of SLA (c), and seed weight (d). The equations for the lines of best fit were obtained from GLMMs and then back-transformed to permit plotting on the original axes. All predictors shown were significant at P < 0.05. Legend provided in (d) contains the species codes corresponding to each colour for all four plots. Species names and corresponding codes are given in Table 1.
Survival time was positively associated with seed size (β = 0.068, SE = 0.033, P < 0.05; Figure 4a) and negatively associated with SSD (β = −0.075, SE = 0.032, P < 0.05; Figure 4b). The addition of the species random effect marginally improved the predictive power of the model (R 2M = 0.171, R 2C = 0.240). Additionally, water-use rates of the species followed a similar pattern with soil moisture levels beginning to level off in all species after about 9 d of drought (Figure 5).
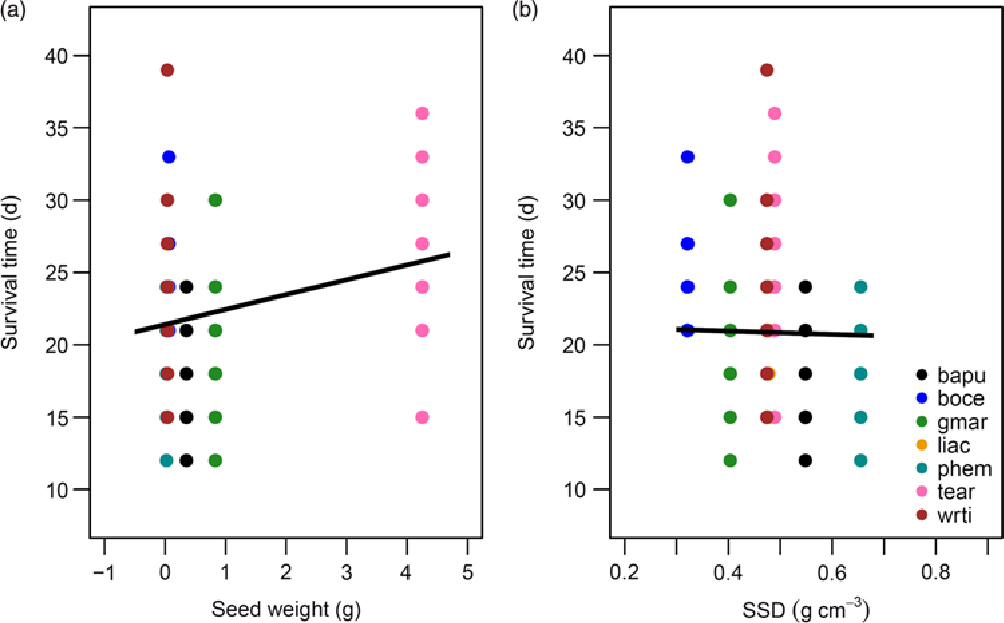
Figure 4. Functional traits as predictors of survival time of seedlings subjected to drought in a greenhouse in Bangalore, India. Log survival time as a function of seed weight (a), and stem specific density (SSD) (b). Equations for the lines of best fit were obtained from GLMMs and then back-transformed to permit plotting on the original axes. All predictors shown were significant at P < 0.05. Legend provided in (b) contains the species codes corresponding to each colour for both plots. Species names and corresponding codes are given in Table 1.

Figure 5. Water use in dry-forest tree seedlings at the beginning of a drought in a greenhouse in Bangalore, India. Gravimetric Water Content (GWC) plotted as a function of the first 12 d of drought for each species (a–g). Each plot is titled with the corresponding four-letter species code; species names and corresponding codes are given in Table 1. The lines of best fit are plotted for each species and are described by an exponential function.
Discussion
Our results show that dry-forest tree seedlings display substantial drought resistance, and are capable of surviving for more than 2 wk during a protracted drought when they are just 3 wk of age. The species examined differed significantly in drought tolerance, and as expected, individuals of larger-seeded species survived droughts for longer. Median survival time was positively correlated with the time from start of senescence until death, but not with time to start of senescence. The time from the start of drought until species started senescing was greater when they supported fewer leaves. The relatively long survival times in this study suggest that young dry-forest tree seedlings may be fairly resilient to intra-seasonal droughts. The significant variation in drought tolerance among species suggests that dry-forest species are likely to be differentially affected by the increased duration of growing-season droughts.
Seed size was positively related to relative growth rate of seedlings under well-watered conditions. Higher total biomass of seedlings in the first few mo after germination has been previously reported for large-seeded species (Fenner Reference Fenner1983, Jurado & Westoby Reference Jurado and Westoby1992, Milberg & Lamont Reference Milberg and Lamont1997). Similarly, studies of intra-specific variation in seed size have reported faster growth rates of seedlings that have come from larger seeds (Khurana & Singh Reference Khurana and Singh2001). However, comparative studies that have examined a broad taxonomic range of species show that seed size can be either unrelated (Dalling & Hubbell Reference Dalling and Hubbell2002), or negatively related to species RGR (Fenner Reference Fenner1983, Leishman et al. Reference Leishman, Wright, Moles, Westoby and Fenner2000, Shipley & Peters Reference Shipley and Peters1990). It is important to note that RGR and absolute growth rate or size can show different relationships with seed size (Fenner Reference Fenner1983).
Species with higher SLA showed greater growth rates under well-watered conditions, congruent with previous studies which suggest that this key leaf functional trait is a good indicator of growth strategies (Reich et al. Reference Reich, Ellsworth and Walters1998, Shipley Reference Shipley2006, Wright & Westoby Reference Wright and Westoby2001). Interestingly, SSD was not a good indicator of seedling growth rates under well-watered conditions for the species examined here, although high SSDs have been previously linked to lower growth rates for young seedlings (Castro-Diez et al. Reference Castro-Diez, Puyravaud, Cornelissen and Villar-Salvador1998) and also for adult trees (Enquist et al. Reference Enquist, West, Charnov and Brown1999, King et al. Reference King, Davies, Tan and Noor2006). Species with harder stems invest more resources, specifically carbon, to create denser wood (Enquist et al. Reference Enquist, West, Charnov and Brown1999, King et al. Reference King, Davies, Tan and Noor2006). The benefits of denser wood include reduced susceptibility to drought stress and mortality via formation of xylem embolisms (Hacke et al. Reference Hacke, Sperry, Pockman, Davis and McCulloh2001, Lens et al. Reference Lens, Tixier, Cochard, Sperry, Jansen and Herbette2013, Martínez-Cabrera et al. Reference Martínez-Cabrera, Jones, Espino and Schenk2009). However, species with lower SSD may still demonstrate high drought resistance by using water stored within stems when drought stressed (Pineda-Garcia et al. Reference Pineda-Garcia, Paz and Meinzer2013, Wolfe Reference Wolfe2017), which was not accounted for in this study. The constrained range of SSDs among our study species, and specifically, the absence of species with very low SSDs in our study (< 0.3 g cm−3) might have precluded identifying a significant relationship between SSD and growth. Additionally, such relationships may be weaker in young seedlings, since they generally have less dense stems (Cornelissen et al. Reference Cornelissen, Cerabolini, Castro-Diez, Villar-Salvador, Montserrat-Martí, Puyravaud, Maestro, Werger and Aerts2003) and less need for the mechanical support provided by denser wood.
Seed size and SSD collectively explained 17–23% of the variation in survival of seedlings, with seed size positively, and SSD negatively related to survival. Our results suggest that seed resources continue to contribute to seedling survival up until at least 1.5 mo of age. Previous studies have reported greater survivorship of larger-seeded species for as long as 6 mo after germination (Khurana & Singh Reference Khurana and Singh2004, Moles & Westoby Reference Moles and Westoby2004a). However, in contrast to expectations, seedlings with high SSD died sooner than those with lower SSDs. Denser stems are typically associated with thinner xylem vessels with thicker cell walls that help protect the seedlings from embolism and subsequent mortality (Hacke et al. Reference Hacke, Sperry, Pockman, Davis and McCulloh2001, Lens et al. Reference Lens, Tixier, Cochard, Sperry, Jansen and Herbette2013, Poorter & Markesteijn Reference Poorter and Markesteijn2008). Thus, it is possible that the benefits of denser stems only become apparent once the seedlings are older and have had the opportunity to accumulate greater carbon stores in their woody stem tissues.
Median survival time was used in this study as the main measure of survival. It was strongly positively correlated with maximum survival time of species. Median survival was also positively correlated with duration of senescence or the time between the appearance of the first yellow leaf and death, but not with the number of days from the start of the drought until the first yellow leaf appeared. This suggests the process of senescence influences the survival time of species experiencing drought more than time leading up to leaf senescence, when the plant is less stressed. This finding corroborates past studies which also assert the importance of the process of senescence in seedling survival (Engelbrecht & Kursar Reference Engelbrecht and Kursar2003, Munné-Bosch & Alegre Reference Munné-Bosch and Alegre2004, Tyree et al. Reference Tyree, Engelbrecht, Vargas and Kursar2003). A longer senescence period suggests the use of drought tolerance strategies, while a shorter time to the start of leaf senescence indicates the use of drought avoidance strategies. Thus, all of our species appear to use a combination of strategies, yet preferences can be detected when comparing species. Both Bauhinia purpurea and Gmelina arborea appear to be drought avoiders since they were the first to start leaf senescence, while Bombax ceiba and Terminalia arjuna appear to be tolerators since they were the last to start senescence and also had the longest survival times. These two drought-resistance phenotypes have been discussed before and other dry-forest communities also encompass a similar combination of strategies (Markesteijn & Poorter Reference Markesteijn and Poorter2009, Slot & Poorter Reference Slot and Poorter2007). Furthermore, the time to the start of senescence was shorter in those species which supported a larger leaf area when the drought started. This was an expected pattern since those are the species which will transpire more and therefore use up their soil moisture reserves faster (Grant Reference Grant, Ahmad and Prasad2012, Vertessy et al. Reference Vertessy, Benyon, O’Sullivan and Gribben1994).
This study focused on isolated seedlings in a greenhouse. In tropical dry forests however, newly emerged seedlings will be surrounded by other individuals, including established grasses, which are strong competitors for water (Cramer et al. Reference Cramer, Van Cauter and Bond2010, Davis et al. Reference Davis, Wrage and Reich1998, Dios et al. Reference Dios, Weltzin, Sun, Huxman and Williams2014). Thus, early growth and establishment may be very important where individuals are competing for a shared pool of water. Additionally, the presence of competitors, particularly grasses may significantly diminish soil water availability and thus substantially reduce seedling ability to withstand drought stress.
Given that seeds germinate at the start of the wet season in order to avoid water limitation in the first few weeks of life, dry-forest tree seedlings appear to be able to survive relatively long growing-season droughts, despite the fact that the seedling stage is the most drought-sensitive stage of life (Grossnickle Reference Grossnickle2005, Reference Grossnickle2012; Moles & Westoby Reference Moles and Westoby2004b, Padilla et al. Reference Padilla, De Dios Miranda and Pugnaire2007). However, our results indicate that increased duration of growing-season droughts will differentially affect species, and these negative effects are likely to be more pronounced for small-seeded species which have fewer seed resources to fall back on.
Acknowledgements
We would like to thank Dr J. Ratnam, Assoc. Prof. K. Isvaran and Dr S. Quader for the advice and help they generously gave during the initial planning of the project and also during the analysis stage. We would also like to thank the National Centre for Biological Sciences (NCBS) for the use of their greenhouse facilities and for providing all of the materials and equipment for the experiments. We are grateful for the help and support given by Y. V. Tiruvaimozhi during the setting up of the experiment. Finally, we would like to thank the anonymous reviewers and the editor for their comments and suggestions which greatly improved the manuscript.
Financial support
None.