INTRODUCTION
The global significance of South-East Asia's biodiversity hotspots is well recognized (Corlett Reference CORLETT2009, Sodhi et al. Reference SODHI, KOH, BROOK and NG2004), but the diversity and distributions of species in transitional areas between these hotspots is less well understood. Recent attention has focused on the determinants of biological transitions between the Sunda and Indochinese biogeographical regions that occur in the Malay-Thai Peninsula; at the Kangar-Pattani line (6°–6.5°N) for plants (Morley Reference MORLEY2000), and 500 km further north at the Isthmus of Kra (11°–13°N) for birds (Hughes et al. Reference HUGHES, ROUND and WOODRUFF2003) and mammals (Hughes et al. Reference HUGHES, SATASOOK, BATES, BUMRUNGSRI and JONES2011, Woodruff & Turner Reference WOODRUFF and TURNER2009).
Explanations for geographical variation in species diversity over the Malay-Thai Peninsula encompass both historical and contemporary factors. Some propose that the peninsula's forest replaced savanna-like habitats that occurred at the Last Glacial Maximum (LGM) (Gathorne-Hardy et al. Reference GATHORNE-HARDY, SYAUKANI, DAVIES, EGGLETON and JONES2002, Wurster et al. Reference WURSTER, BIRD, BULL, CREED, BRYANT, DUNGAIT and PAZ2010), implying that populations of forest-dependent taxa have since colonized from further south. Others argue for a longer history of forest across the Sunda Shelf (Cannon et al. Reference CANNON, MORLEY and BUSHE2009), implying more ancient, uniform and species-rich biological communities. Pleistocene sea-level fluctuations might also have shaped broader patterns of vertebrate diversity in this region, by causing local extinctions in low-lying areas where the peninsula is narrower (Hughes et al. Reference HUGHES, SATASOOK, BATES, BUMRUNGSRI and JONES2011, Woodruff & Turner Reference WOODRUFF and TURNER2009). Contemporary factors might also shape assemblage structure; for example, a recent synthesis of research in Atlantic forests of South America demonstrated temperature seasonality to be the main predictor of phyllostomid bat richness among a suite of other potential variables (Stevens Reference STEVENS2013).
Here we characterize geographical variation in insectivorous bat species assemblages across the Malay Peninsula, and test simultaneously for the impact of both historical factors and present-day seasonality on diversity. In Peninsular Malaysia, bats are key components of rain-forest communities; they number over 120 species (Kingston Reference KINGSTON2010, Kingston et al. Reference KINGSTON, LIM and ZUBAID2006, Simmons Reference SIMMONS, Wilson and Reeder2005) of which around half are insectivorous. Broad, short wings that confer slow flight (Aldridge & Rautenbach Reference ALDRIDGE and RAUTENBACH1987, Stockwell Reference STOCKWELL2001), together with small body size (Stockwell Reference STOCKWELL2001) and high-frequency echolocation calls (Kingston et al. Reference KINGSTON, FRANCIS, ZUBAID and KUNZ2003), all suggest adaptations for hunting in dense forested vegetation. Current distributions in South-East Asia (Francis Reference FRANCIS2008) support this tight association between this guild of bats and rain forest, however, site inventory data are lacking and limited in terms of latitude. To date, nearly all published data come from central areas (3–4°N), with Krau Wildlife Reserve, at 3.72° N, holding the record as the most species-rich site for bats in the palaeotropics (Francis Reference FRANCIS1990, Heller & Volleth Reference HELLER and VOLLETH1995, Kingston et al. Reference KINGSTON, FRANCIS, ZUBAID and KUNZ2003, Struebig et al. Reference STRUEBIG, KINGSTON, AKBAR, MOHD-ADNAN and ROSSITER2008, Reference STRUEBIG, KINGSTON, ZUBAID, LE COMBER, MOHD-ADNAN, TURNER, KELLY, BOZEK and ROSSITER2009, Reference STRUEBIG, KINGSTON, PETIT, COMBER, ZUBAID, MOHD-ADNAN and ROSSITER2011).
By examining patterns of diversity of forest-dependent bat species across Peninsular Malaysia, we tested between two competing hypotheses proposed in the literature. First, that forest has undergone a historical shift north following the LGM, in which we would expect a northward decline in species richness. Second, that there has been no major post-LGM shift in forest, in which case we would see no latitudinal cline. In our models we also accounted for the potential contributing role of present-day seasonality and peninsular width on bat species diversity.
METHODS
Forest study sites
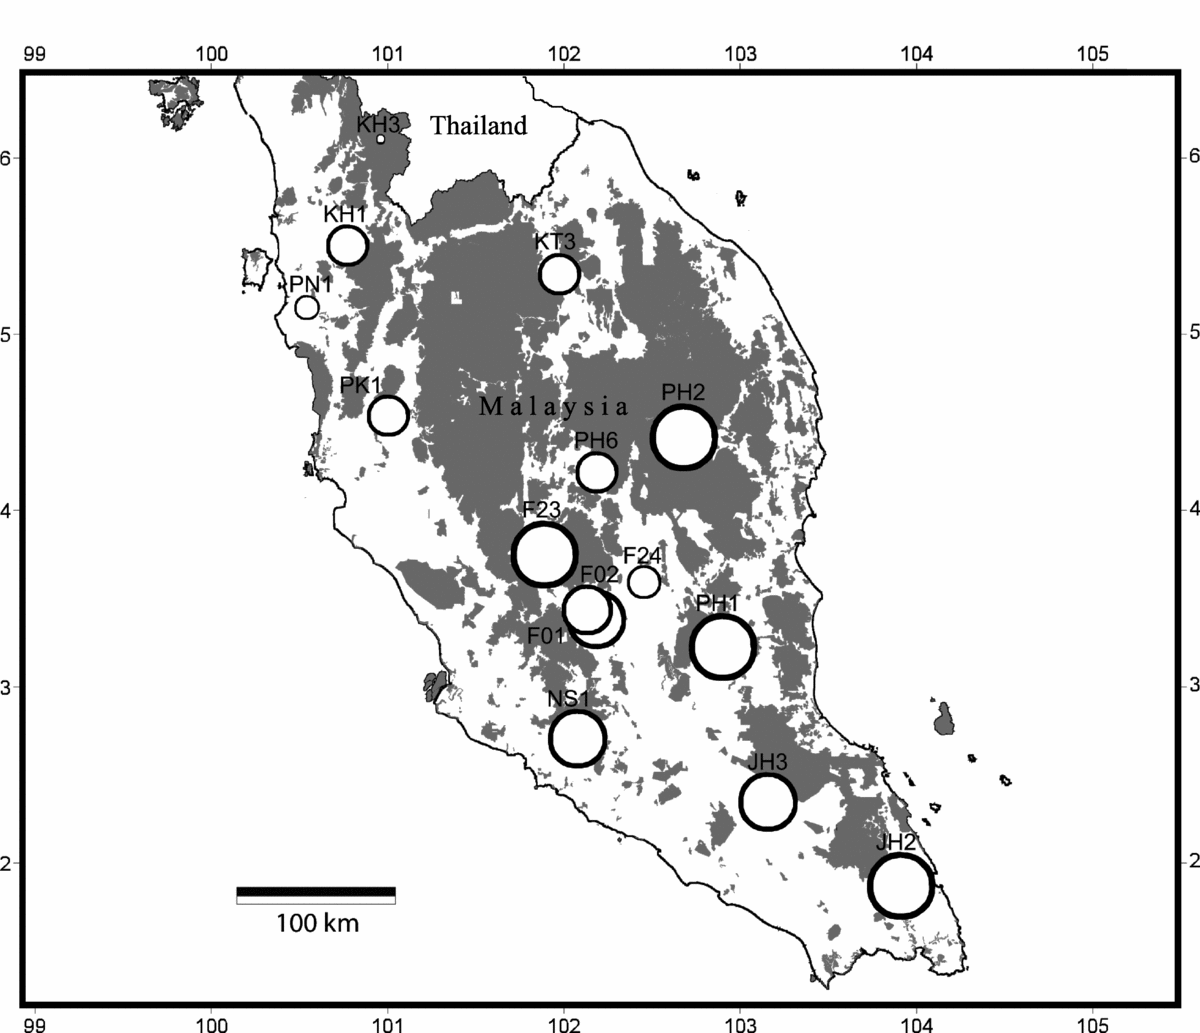
Bat sampling was undertaken between 2007 and 2009 in continuous lowland mixed dipterocarp forest, using forest maps (from the Department of Agriculture, Peninsular Malaysia) to select sites distributed across the Peninsula (Figure 1). Because bat diversity in the Asian tropics is typically comparable between large areas of logged and unlogged forest (Struebig et al. Reference STRUEBIG, KINGSTON, AKBAR, MOHD-ADNAN and ROSSITER2008, Reference STRUEBIG, TURNER, GILES, LASMANA, TOLLINGTON, BERNARD and BELL2013) we included sites in timber and mining concessions as well as protected areas. All sites were in forest blocks >1000 ha in size that had been logged once within the last 30 y (Appendix 1), but at the time of sampling had recovered to tall forest. A total of 15 sites were included in analyses; 11 sites from this study, and an additional four sites from previous research in the centre of the peninsula using the same protocol (Struebig et al. Reference STRUEBIG, KINGSTON, AKBAR, MOHD-ADNAN and ROSSITER2008, Reference STRUEBIG, KINGSTON, ZUBAID, LE COMBER, MOHD-ADNAN, TURNER, KELLY, BOZEK and ROSSITER2009, Reference STRUEBIG, KINGSTON, PETIT, COMBER, ZUBAID, MOHD-ADNAN and ROSSITER2011).

Figure 1. Map of Peninsular Malaysia showing the gradient of bat species richness with latitude. Radii of circles are scaled by predicted species richness based on the Shen Multinomial Model (SShen).
Bat capture and species identification
Surveys were restricted to non-monsoonal seasons (March–September) as heavy rain can bias bat captures and thus affect species composition and sample sizes (Kingston et al. Reference KINGSTON, FRANCIS, ZUBAID and KUNZ2003). We targeted narrow-space insectivorous bats (Rhinolophidae, Hipposideridae, Megadermatidae, Nycteridae, Kerivoulinae and Murininae, sensu Kingston et al. Reference KINGSTON, FRANCIS, ZUBAID and KUNZ2003) using four-bank harp traps set across potential foraging routes along trails, old logging skids and small streams. Between two to eight traps were set each night, and checked for bats at 22h00 and the following morning after sunrise. Trapping effort was uneven across sites.
Individual bats were identified following Kingston et al. (Reference KINGSTON, LIM and ZUBAID2006) and Francis (Reference FRANCIS2008) using external measurements (length of forearm, tibia and tail, as well as body mass), before being released near to the capture point within 10 h of processing. We focused analyses on the ‘narrow-space’ guild of bats that forage in the forest interior (sensu Kingston et al. Reference KINGSTON, FRANCIS, ZUBAID and KUNZ2003). The full protocol is described in Struebig et al. (Reference STRUEBIG, KINGSTON, AKBAR, MOHD-ADNAN and ROSSITER2008).
Site species richness, diversity and species abundance
Estimates of species richness can be very sensitive to sample size (Colwell et al. Reference COLWELL, MAO and CHANG2004, Mao et al. Reference MAO, COLWELL and CHANG2005). To account for this potential problem, we estimated richness using rarefaction techniques and compared values using 95% confidence intervals at a standard sample size. Two methods were used; first, observed richness (Sobs) was estimated by rarefying the total captured individuals of each site down to the minimum number of individuals (104 bats) using sample-based species accumulation curves in EstimateS 8.2 (http://purl.oclc.org/estimates), with individuals recoded as samples. Second, because information from the more thoroughly sampled sites could potentially be lost using this method, we also used rarefaction to predict species richness of sites up to the same survey effort of the site with the maximum number of individuals (694 bats, to match bat numbers at the most abundant site). These predicted species richness values were calculated using the Shen multinomial model (SShen) (Shen et al. Reference SHEN, CHAO and LIN2003) in SPADE (Species Prediction And Diversity Estimation, http://chao.stat.nthu.edu.tw) with 1000 bootstrap replicates. The Shen predictor was chosen as it performed better than other estimators in a previous bat assemblage study in the region (Kingston Reference KINGSTON, Kunz and Parsons2009), and has also performed favourably at similar prediction levels elsewhere in South-East Asia (Struebig et al. Reference STRUEBIG, BOŻEK, HILDEBRAND, ROSSITER and LANE2012).
In addition to species richness, rarefied species evenness was estimated at each site using the reciprocal Simpson index (1/D) calculated in EstimateS. The Simpson index is a robust measure of dominance as it considers the variance of the species abundance distribution (Simpson Reference SIMPSON1949); the reciprocal of the Simpson index, has been shown to have a high degree of discrimination with large values indicating high levels of evenness, with the maximum equal to the total species in a sample.
To test for an effect of latitude on bat species richness over the peninsula, relationships between bat diversity metrics (Sobs, SShen and 1/D) and site characteristics were further investigated using generalized linear models in R Version 2.1.1. In our models we also accounted for potential contributions of land area (peninsula width) and temperature seasonality. Values of temperature seasonality at study sites were extracted from the 1-km2 resolution map of ‘Bioclim 4’ provided by WorldClim (Hijmans et al. Reference HIJMANS, CAMERON, PARRA, JONES and JARVIS2005). The WorldClim bioclimatic dataset has been generated through interpolation of average monthly climate data from a network of weather stations during the period 1950 to 2000. Temperature seasonality is a measure of temperature change over the course of a year, and is calculated as the coefficient of variation of mean monthly values (Hijmans et al. Reference HIJMANS, CAMERON, PARRA, JONES and JARVIS2005).
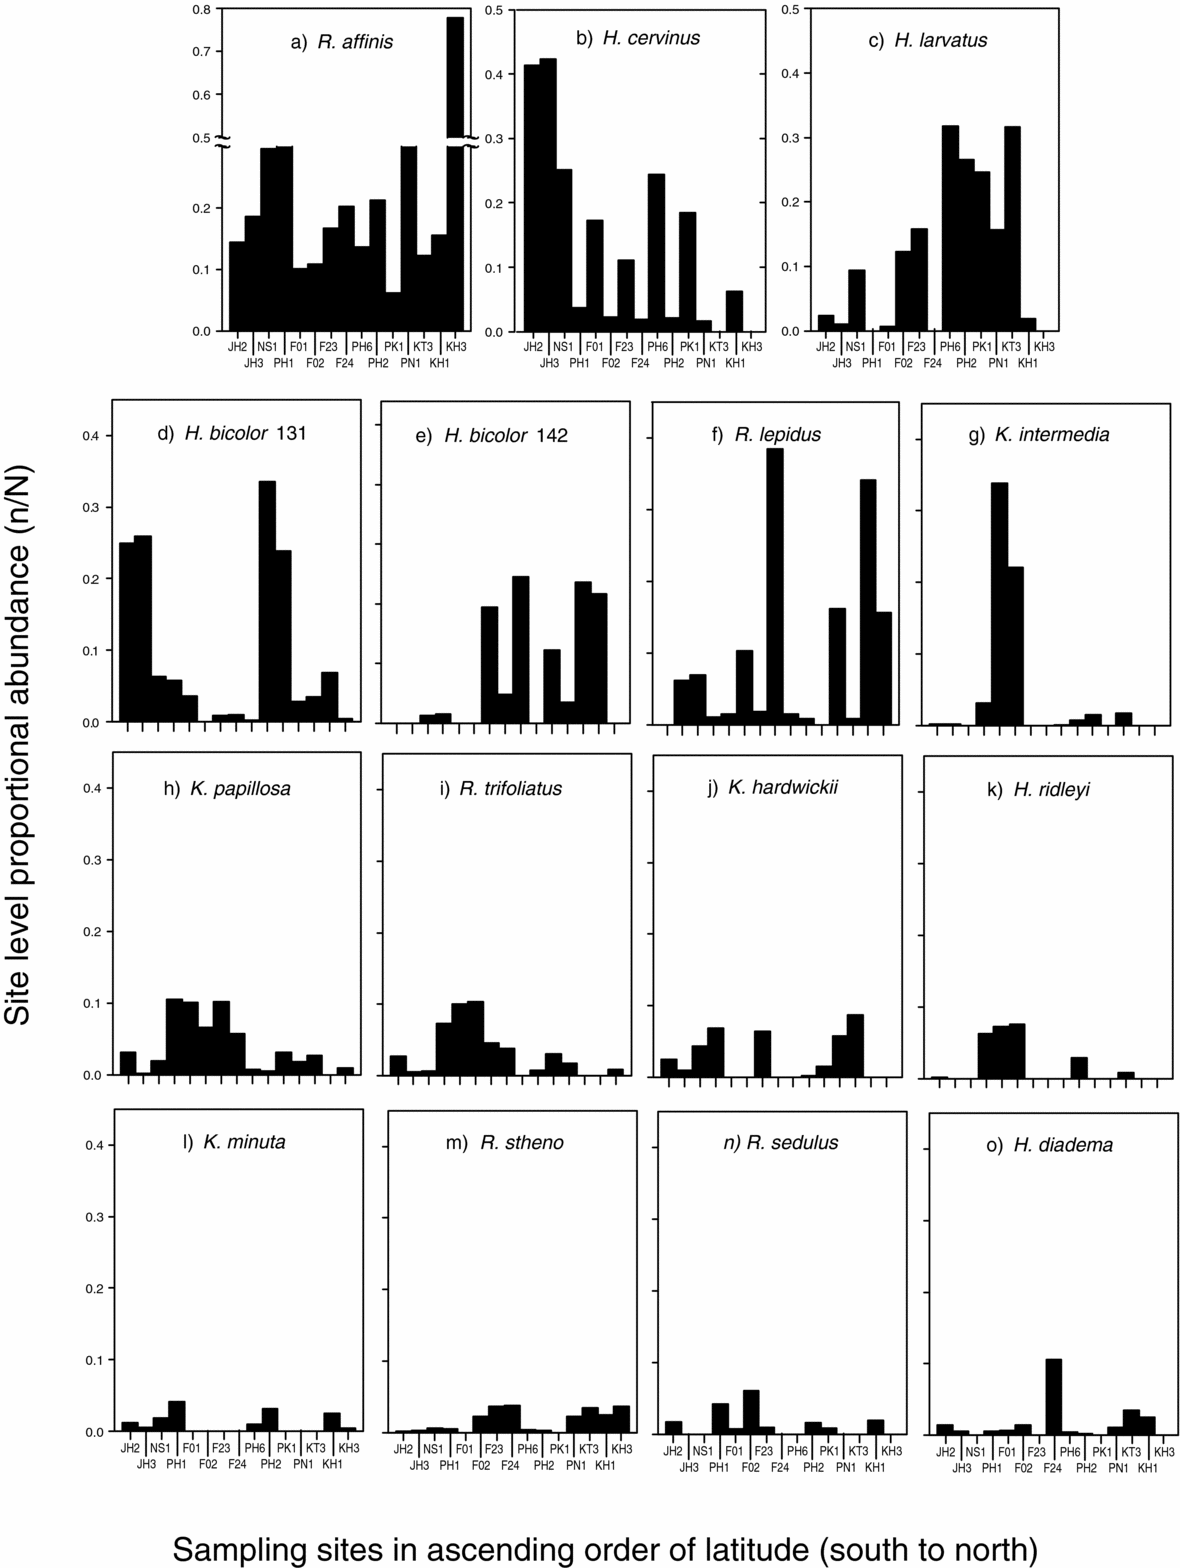
Variation in the abundance of species between sites was investigated by visually comparing relative abundance across pooled sites and calculating proportional abundance of each species per site. Proportional abundances were then plotted against latitude for the 15 most abundant species. Spearman rank correlations were used to test for association between latitude and bat abundance.
Assemblage structure and β-diversity
To determine patterns of species turnover and assemblage similarity between sites, beta (β) diversity was calculated based on pairwise or multiple-site comparisons. Similarity indices suffer the same biases as estimates of alpha diversity, and so are strongly influenced by sample size. We therefore used the Morisita-Horn similarity index, calculated in SPADE, which is biased towards more common species and so is less sensitive to the absence of rare species in under-sampled assemblages (Chao et al. Reference CHAO, JOST, CHIANG, JIANG and CHAZDON2008). We also repeated analyses using a modified version of the Sørensen similarity index (Chao et al. Reference CHAO, CHAZDON, COLWELL and SHEN2005), calculated in EstimateS with 1000 bootstrap replications to generate standard errors, which accounts for potentially undetected rare species in assemblages. These distance measures consider the abundance of species in assemblages as well as their presence/absence, with higher values indicating higher similarity between the two communities.
When biological communities are in equilibrium, those that are close to each other are expected to be more similar than those that are further apart; a process known as distance decay (Whittaker Reference WHITTAKER1972). To test for distance-decay, pairwise assemblage similarity among sites was plotted against corresponding pairwise geographical distance, and correlation tested using a Mantel test in GenAlEx 6.2 (Peakall & Smouse Reference PEAKALL and SMOUSE2006) with 999 permutations. This was also verified using the RELATE analysis in Primer version 5 (Clarke Reference CLARKE1993), which is a non-parametric technique that is robust to non-linearity between the variables.
Finally, the potential determinants of β-diversity, and the species that contribute to these patterns, was also explored using non-metric multidimensional scaling (NMDS) ordination, based on Sørensen dissimilarity using PC-ORD 5 (MJM Software). We determined the appropriate number of ordination axes using 250 iterations of our assemblage data and a Monte Carlo test. For the final ordination, species that contributed most to the variation in the assemblage structure were identified by correlating abundance with the ordination axis score, based on tau coefficients. The correlation between axis scores and both latitude and longitude was also determined.
RESULTS
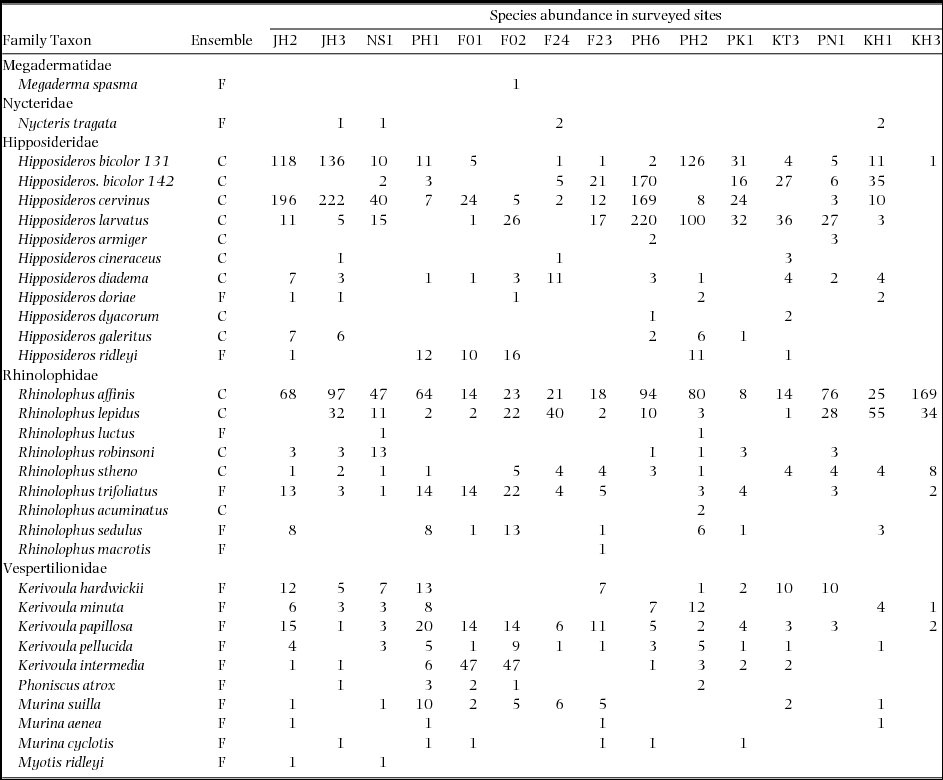
With a total survey effort of 291 harp trap nights (HTN) across 15 sites we captured 3847 individuals, representing 32 species from five families. Of these captures, 3776 individuals were ‘narrow-space’ insectivorous species and were the subject of further analyses.
The three most commonly represented families across the length of the peninsula were the Rhinolophidae (9 species), Hipposideridae (11 species) and Vespertilionidae (10 species), with the latter consisting of six species of the subfamily Kerivoulinae, three species of the subfamily Murininae, and one species of genus Myotis (Table 1). Of these 32 species, 18 were categorized as tree-roosting taxa and 14 cave-roosting taxa.
Table 1. Species abundance of insectivorous bat species captured at 15 sites in Peninsular Malaysia. Ensembles are defined by roosting ecology following Struebig et al. (Reference STRUEBIG, KINGSTON, AKBAR, MOHD-ADNAN and ROSSITER2008): predominantly tree cavity and/or foliage roosting, F; and predominantly cave roosting, C. Nomenclature follows Simmons (Reference SIMMONS, Wilson and Reeder2005), except for Hipposideros bicolor, which is now recognized as two genetically divergent taxa that call at distinct frequencies – 131 and 142 kHz (Murray et al. Reference MURRAY, CAMPBELL, KINGSTON, ZUBAID, FRANCIS and KUNZ2012).

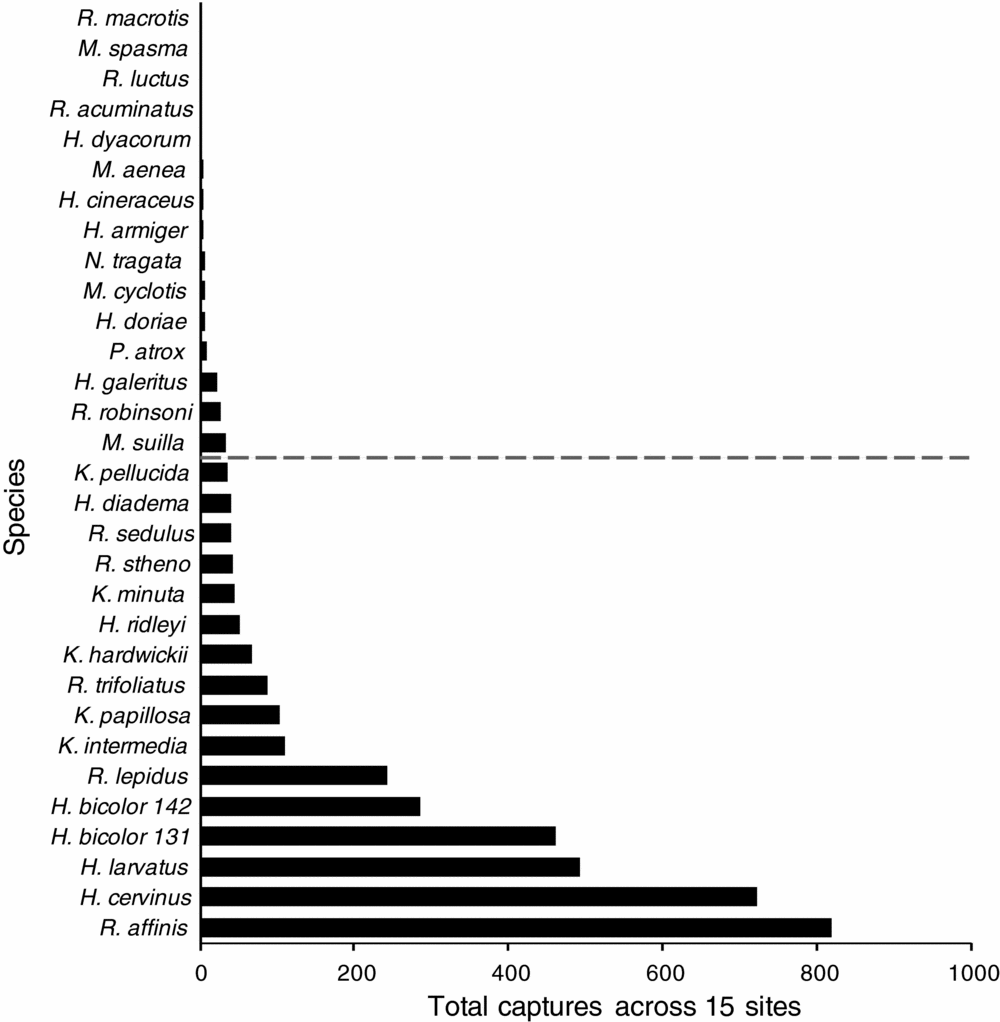
Stepwise patterns in species dominance in assemblages were clearly evident in plots of proportional abundance (Figure 2). The two most dominant species across the entire study region were Rhinolophus affinis (21.7% of total captures) and Hipposideros cervinus (19.1%), although their abundance was variable across the Peninsula (Appendix 1). All six of the most dominant species were cave-roosting taxa from the families Rhinolophidae and Hipposideridae. The 15 most dominant species together represented 95.6% of total captures (Table 1). Based on a cut-off point of less than 1% of total captures (37 individuals), 16 species were classified as rare (Figure 2). For R. luctus and R. acuminatus, a maximum of two individuals were recorded for any assemblage, whereas Megaderma spasma and R. macrotis were represented by only one capture over the entire 15 sites (Table 1).

Figure 2. Overall insectivorous bat abundance from combined captures from 15 sites with standardized trapping effort across Peninsular Malaysia. The dashed line depicts the threshold of rarity (less than 1% of total capture individuals of all species), with more common species above, and rarer ones below, the line. Full species names are given in Table 1.
Site species richness, diversity and species abundance
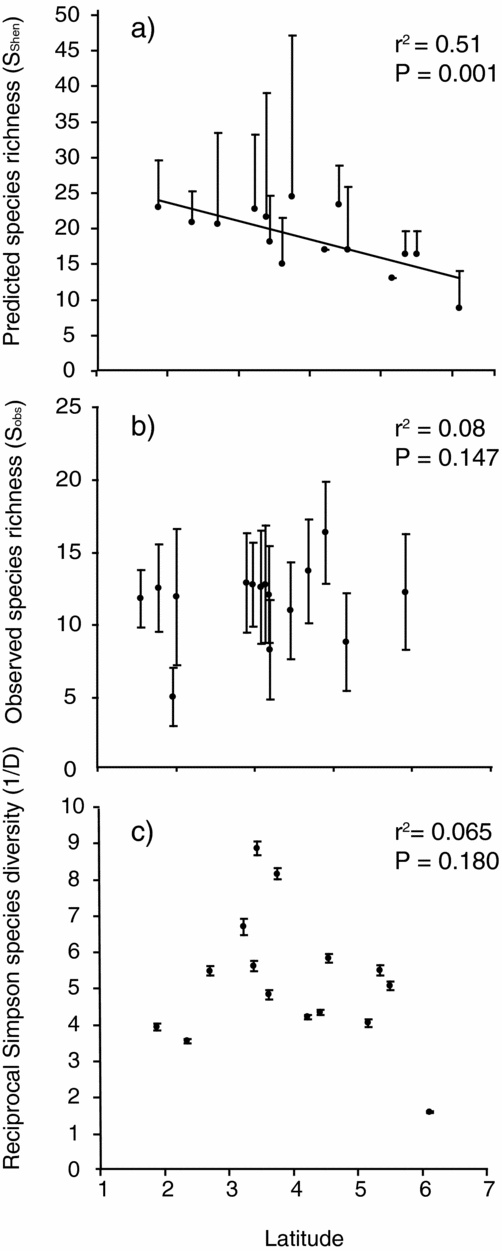
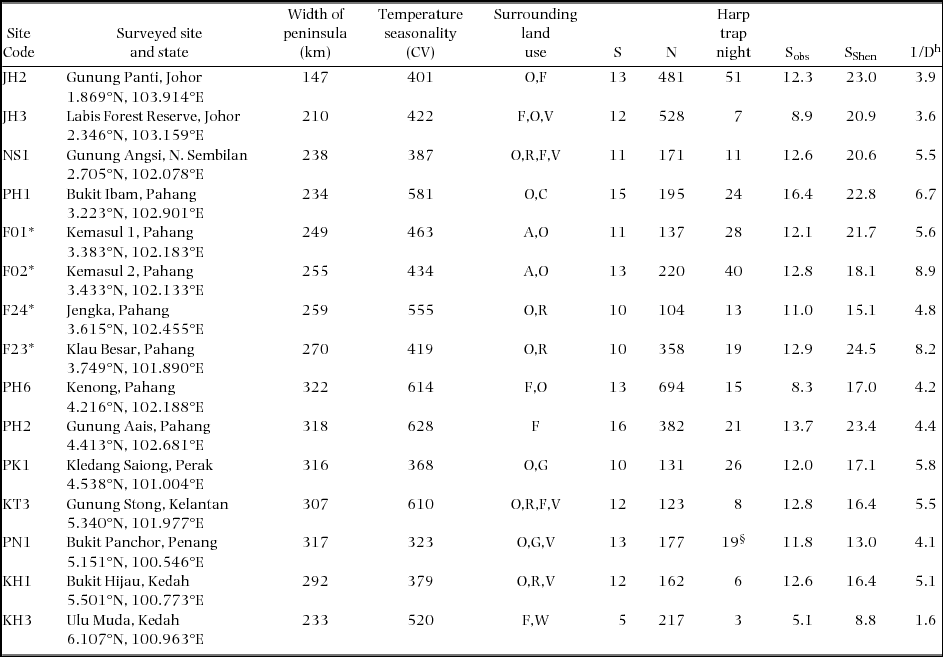
Species richness was typically low at the north of the study area. Rarefied observed species richness (Sobs) was greatest at site PH1 (16.4 ± 1.79, 95% confidence intervals) near the centre of the peninsula, whereas only 5.07 ± 1.04 species were found at KH3 (Appendix 1), the northernmost site. This pattern was consistent when species richness was predicted (SShen) to the maximum sample size available (694 bats at PH6): 22.8 species at PH1, compared with 8.8 species for KH3 (Table 1). The highest Simpson evenness was recorded at sites in the centre of the peninsula: F02 (1/D = 8.86) and F23 (1/D = 8.16). In contrast, KH3 exhibited low bat diversity (1/D = 1.60), as only seven species were captured for 217 individuals, and the assemblage was dominated by one species (R. affinis) (Table 1).
Plots of species diversity (Sobs, SShen and 1/D) against site latitude revealed a significant negative relationship between predicted richness (SShen) and latitude (Figure 3a; r2 = 0.51, P = 0.001). All of the indices examined (Sobs, SShen and 1/D), revealed a broad reduction in diversity with increasing latitude (south to north), although these were not always significant (Figure 3). A generalized linear model (GLM) of SShen versus latitude, peninsula width and seasonality revealed the importance of latitude (b = −3.46 ± 0.94, t = −3.70, P < 0.01), but showed no effect of either width (t = 1.30, P = 0.22) or site seasonality (t = 0.581, P = 0.57). Following backward stepwise regression and AIC model selection for these predictors, the final model confirmed the importance of latitude (b = −3.46 ± 0.91, t = −3.79, P < 0.01), but revealed no significant effect of width (b = 0.03 ± 0.02, t = 1.42, P > 0.18) and excluded seasonality (ΔAIC = 1.6). To test whether the observed latitudinal decline in predicted species diversity was driven by the three most northerly sites (with the lowest species richness), we removed these and found a loss in significance (t = −1.92, P = 0.09). No significant effects of the three predictor variables were revealed by GLMs for Sobs (t latitude = −1.74; width = 1.38; seasonality = −0.12; P > 0.1) or 1/D (t latitude = −1.78; width = 1.65; seasonality = −0.54; P > 0.1).

Figure 3. Clinal patterns of bat species richness (predicted, a; and observed, b) and Simpson diversity (c) with latitude (ºN) across Peninsular Malaysia. Error bars are 95% CI of the mean extrapolated diversity values (limited to upper CI for (a) and (b) because these values are estimated from upward extrapolations only).
The proportional abundance for two of the 15 common species was correlated with latitude (Figure 4). Abundance of H. cervinus was lower at higher latitude (rSpearman = −0.693, P = 0.002), and the abundance of H. bicolor (142 lineage, Table 1) was higher at higher latitude (rSpearman = 0.456, P = 0.044). No significant correlation was detected between abundance and latitude for any of the remaining 15 common species.

Figure 4. Latitudinal variation in the relative abundance (proportional to total number of captures) of the 15 most common species. For one species, Rhinolophus affinis (a), proportional abundance was exceptionally high (> 0.7) at one site. For all other species examined (b–c) proportional abundance was less than 0.5.
Assemblage structure and β-diversity
Mantel tests revealed weak and non-significant associations between bat assemblage similarity across the peninsula and geographical distance: Morisita-Horn similarity (r2 = 0.029, PMantel = 0.074), estimated Chao-Sørensen (r2 = 0.034, PMantel = 0.084) and raw-Sorensen (r2 = 0.024, PMantel = 0.122). When analyses were repeated using the RELATE procedure with non-parametric assumptions the associations remained non-significant: Chao-Morisita similarity (rSpearman = 0.147, P = 0.101), estimated Chao-Sørensen (rSpearman = 0.169, P = 0.089) and raw Sørensen (rSpearman = 0.107, P = 0.196). Therefore, similarity in assemblage structure did not show a pattern of distance decay, and neighbouring bat assemblages were no more similar than distant ones. However, pairwise differences in species richness were positively correlated with pairwise geographical distance (r2 = 0.193, PMantel = 0.010).
Patterns of assemblage structure
Non-metric multidimensional scaling revealed that a three-axis ordination was the most reliable stable solution (stress = 7.26; Monte Carlo randomization, P = 0.004), which together represented 86.3% of assemblage variation. The majority of the variation (69.5%) was represented on the first two axes and so these were the subject of further analyses.
Most assemblage dissimilarity across the study area was caused by the changes in abundance of two cave-roosting species, R. affinis and R. lepidus. Although the abundance of six species was correlated with NMDS axes scores, closer inspection of abundance-NMDS axes plots revealed that these correlations were statistical artefacts for all but three species: R. affinis, R. lepidus and R. stheno. Latitude was moderately correlated with axis 1 (rtau = −0.314) and axis 2 (rtau = 0.314).
DISCUSSION
We investigated bat assemblage structure across Peninsular Malaysia and inferred how this structure might have been shaped by proposed changes in the extent and distribution of tropical rain forest after the LGM. At the alpha diversity level, three indices revealed a weak decline in species richness from the south of Peninsular Malaysia towards the north, although the trend was only significant when using predicted SShen, indicating that more sampling might be needed in order to observe the trend based on the empirical data alone. Based on the SShen index, there were only two sites (PN1 and PH6) at which species inventories were near complete. Generalized Linear Models confirmed latitude as an explanatory variable, however, they revealed no effect of seasonality or peninsular width on bat richness at sites. A latitudinal cline in diversity was also evident from the significant relationship between pairwise difference in species richness among sites and corresponding geographical distance. In other words, this confirmed that the biggest differences occurred between the most distant (i.e. south-east and north-west) sites. However, the other measures of beta diversity, which included information on the abundance of species as well as richness, did not reveal an effect of distance. This finding supports recent studies in north Borneo (Struebig et al. Reference STRUEBIG, BOŻEK, HILDEBRAND, ROSSITER and LANE2012, Reference STRUEBIG, TURNER, GILES, LASMANA, TOLLINGTON, BERNARD and BELL2013) and West Africa (Fahr & Kalko Reference FAHR and KALKO2011), in which it was also found that distance-decay of bat assemblages was weak and non-significant over similar geographical distances to this study.
The absence of an effect of seasonal variation on bat richness implies that current climate might have a relatively weak influence on bat assemblage structure compared with other contemporary or historic processes. This has implications for studies that attempt to predict the distributions of bats from climatic variables, and suggests that other geographical variables relevant to species ecology should also be explored as predictors. That said, the influence of climatic variation on species distributions is likely to be scale-dependent. Notably, Stevens (Reference STEVENS2013) found seasonality to be an important predictor of bat richness over a much larger seasonality gradient than that seen in this study.
The absence of a clear effect of peninsula width does not support a previous study that found more mammal species occur at the wider parts of the peninsula, where land surface area is greater and thus was less impacted by repeated sea level fluctuations (Woodruff & Turner Reference WOODRUFF and TURNER2009). Peninsula effects have also been invoked to explain southward decreases in the species richness of sphingid moths, which peak in northern Thailand (Beck et al. Reference BECK, KITCHING and HAXAIRE2007). At around 11 000 y BP, the sea level in South-East Asia is thought to have risen to 40 m below present, covering part of east Sundaland and remaining at this level for over half of the interglacial period (Sathiamurthy & Voris Reference SATHIAMURTHY and VORIS2006, Voris Reference VORIS2000). Further increases in sea level disconnected the Malay-Thai Peninsula from Sumatra and Borneo and formed the exposed land shape that we see today. Yet while Woodruff & Turner (Reference WOODRUFF and TURNER2009) included published data on 103 bat species from the Malay-Thai Peninsula, they did not distinguish between generalist open-space bat species versus forest specialists. Here we excluded open-space insectivorous bat species and fruit bats from analyses and all data were obtained from actual field surveys, and so considered both species abundance and species richness to provide more insight into the species diversity of forest-dependent mammals.
We suggest that the detected effect of latitude on bat species diversity could reflect a wider cline that has arisen from historical changes in the extent of forest, specifically if forest habitat has spread northwards since the LGM. The extent of historical forest cover in Peninsular Malaysia has been contested; Cannon et al. (Reference CANNON, MORLEY and BUSHE2009) conducted past vegetation reconstructions and suggested that forest at the LGM was more widely distributed than at present, occurring across exposed land in the coastal areas now covered by the South China Sea. The patterns we find are more consistent with scenarios proposed by Wurster et al. (Reference WURSTER, BIRD, BULL, CREED, BRYANT, DUNGAIT and PAZ2010), who interpreted data from guano deposits and inferred that rain forest in the peninsula was replaced by open grassland. Nevertheless, we cannot dismiss the possibility that the observed effect of latitude as a predictor of richness in our models may have been influenced by a few sites in the north where diversity was particularly low. More sampling at higher latitudes is therefore required to distinguish between a step-wise northerly decrease in richness, and a more gradual decline along the peninsula.
Spatial variation in species diversity could also result from finer-scale habitat variability due to present conditions rather than re-colonization events. Wikramanayake et al. (Reference WIKRAMANAYAKE, DINERSTEIN, LOUCKS, OLSON, MORRISON, LAMOREAUX, MCKNIGHT and HEDAO2002) classified Peninsular Malaysia into three eco-regions: rain forest, montane rain forest and peat swamp forest. Lowland evergreen dipterocarp tropical rain forest occurs below 300 m asl and, within Peninsular Malaysia, is distributed between 1°N and 6°N degrees latitude with the vegetation transition to monsoonal forests reported to be at around 6.1°N at the so-called Kangar-Pattani Line (Vincent & Yusuf Hadi Reference VINCENT and YUSUF1993, Woodruff Reference WOODRUFF2003). While we attempted to minimize the impact of habitat variation across the study region (the northernmost site was located at 6.1°N and all sites were below 300 m, and avoided peat swamp) we cannot completely rule out the possibility of local conditions influencing assemblage structure. Of particular importance to many bat species is the presence of large cave systems. In tropical landscapes these features can greatly influence bat assemblage structure, with cave-roosting species being more abundant near large roosts (Struebig et al. Reference STRUEBIG, KINGSTON, ZUBAID, LE COMBER, MOHD-ADNAN, TURNER, KELLY, BOZEK and ROSSITER2009). Although our sampling was purposefully undertaken away from large cave structures, it is noteworthy that limestone karst landscapes characterize the north of the Malay peninsula more than the south.
Greater numbers of studies of latitudinal clines in community structure have been conducted in the New World, on groups such as birds (Blackburn & Gaston Reference BLACKBURN and GASTON1996), large mammals (McCoy & Connor Reference MCCOY and CONNOR1980) and insects (Stout & Vandermeer Reference STOUT and VANDERMEER1975). Stevens & Willig (Reference STEVENS and WILLIG2002) studied the latitudinal patterns of bat species across both South and North America continents, covering three climatic zones (temperate, subtropical and tropical) and found that local species richness (alpha diversity) increases and is more variable with decreasing latitude. We reiterate that additional surveys are needed in the remaining diverse forests of the Old World to gain a better picture of latitudinal patterns of species diversity and the processes that shaped these patterns. A secondary finding of our study was the highest alpha diversity detected in the centre (Pahang) and south (Johor) parts of the peninsula. This region is under intensive pressure for agricultural development, and has already undergone large-scale conversion to industrial plantation in recent decades (Fitzherbert et al. Reference FITZHERBERT, STRUEBIG, MOREL, DANIELSEN, BRUHL, DONALD and PHALAN2008). High levels of species diversity found in remaining forest here may be expected to decline over time if disturbed forests owe an extinction debt as documented nearby on the island of Singapore (Brook et al. Reference BROOK, SODHI and NG2003). More ecological research and conservation attention in this region of Malaysia is therefore warranted.
ACKNOWLEDGEMENTS
The project was funded by scholarship grants awarded by the Universiti Sains Malaysia and Bat Conservation International to L. S. Lim, and a UKMTOPDOWN-ST-08-FRGS00032010 grant awarded to A. Zubaid. We thank the Economic Planning Unit of Malaysia (EPU), the Forestry Department of Peninsular Malaysia and the Department of Wildlife and National Parks (DWNP) for granting research permissions. We also thank the following people for assistance in the field: Roslan Yusof, Mohd. Yusof, Guan Eng Tan, Hasri, Milla Loumbar, Cheng Min Wong, Ching Fong Lau, Hao-Chih Kuo, Juliana Senawi, Hong Diem Vo, Mr Man, Uncle Lah, Nor Zalipah Mohamed, Mr and Mrs Siow Kok Wai.
Appendix 1. Site and bat assemblage characteristics of 15 forest sites surveyed across Peninsular Malaysia. Temperature seasonality is a measure of temperature change over the course of a year, and is calculated as the coefficient of variation (CV) of mean monthly values from interpolated weather station data (Hijmans et al. Reference HIJMANS, CAMERON, PARRA, JONES and JARVIS2005). Land-uses surrounding the sampling sites are Acacia plantation, A; oil palm plantation, O; rubber plantation, R; cleared land, C; forest, F; mixed gardens in villages, G; vegetable and fruit plantation, V; water bodies, W. Diversity is presented as the total captured species per site (S), total number of individuals captured (N), rarefied richness (Sobs), predicted richness using the Shen multinomial model (SShen), and reciprocal Simpson index (1/D). Asterisks indicate sites for which data were made available from Struebig et al. (Reference STRUEBIG, KINGSTON, AKBAR, MOHD-ADNAN and ROSSITER2008).


