


Introduction
Sampling biases are persistent and pervasive issues in biodiversity and ecological research that result in knowledge shortfalls across regions, taxa and species traits, with profound consequences for biodiversity conservation and management strategies (Clark & May Reference Clark and May2002, Mokany & Ferrier Reference Mokany and Ferrier2011, Nemésio et al. Reference Nemésio, Seixas and Vasconcelos2013, Ribeiro et al. Reference Ribeiro, Teixido, Barbosa and Silveira2016). For example, birds and mammals are disproportionately more sampled in biodiversity research across the world (e.g., Shine & Bonnet Reference Shine and Bonnet2000, Trimble & Van Aarde Reference Trimble and Van Aarde2010, Troudet et al. Reference Troudet, Grandcolas, Blin, Vignes-Lebbe and Legendre2017). Likewise, biogeographic biases result in areas, countries or ecosystems neglected or undersampled, which is particularly apparent in developing and in large countries wherein research institutions are unevenly distributed (e.g., Deikumah et al. Reference Deikumah, Mcalpine and Maron2014, Moerman & Estabrook Reference Moerman and Estabrook2006, Oliveira et al. Reference Oliveira, Paglia, Brescovit, Carvalho, Silva, Rezende, Leite, Batista, Barbosa, Stehmann, Ascher, Vasconcelos, De Marco, Löwenberg-Neto, Dias, Ferro and Santos2016). Reviewing published literature through electronic databases allows us to identify knowledge gaps, suggesting future research effort towards neglected regions and taxa, which deserve further attention.
Research related to habitat loss and fragmentation is both biogeographic and taxonomically biased across world’s tropical forests (Deikumah et al. Reference Deikumah, Mcalpine and Maron2014). Given that habitat loss and fragmentation are among the most important threats to biodiversity (Fahrig Reference Fahrig2003, Hanski Reference Hanski2015, Kruess & Tscharntke Reference Kruess and Tscharntke1994, Wintle et al. Reference Wintle, Kujala, Whitehead, Cameron, Veloz, Kukkala, Moilanen, Gordon, Lentini, Cadenhead and Bekessy2019), detecting unevenness in studies of these processes across regions and among taxa is of paramount importance to provide decision-making for conservation policies (Deikumah et al. Reference Deikumah, Mcalpine and Maron2014). Although habitat loss and fragmentation usually occur simultaneously, habitat loss is directly associated with habitat quantity (i.e., reduction in the suitable habitat area in the landscape over time), whereas fragmentation per se is mostly related to differences in landscape spatial configuration (i.e., subdivision of the natural habitat in fragments) (Didham et al. Reference Didham, Kapos and Ewers2012, Fahrig, Reference Fahrig2003, Reference Fahrig2017, Hanski Reference Hanski2015). However, fragmentation per se can generate positive effects under particular landscape-level contexts (Fahrig Reference Fahrig2017), although the relative importance of negative versus positive effects caused by fragmentation regardless of habitat loss remains in an intense debate (see Fahrig Reference Fahrig2017, Fahrig et al. Reference Fahrig, Arroyo-Rodríguez, Bennett, Boucher-Lalonde, Cazetta, Currie, Eigenbrod, Ford, Harrison, Jaeger, Koper, Martin, Martin, Metzger, Morrison, Rhodes, Saunders, Simberloff, Smith, Tischendorf, Vellend and Watling2019, Fletcher et al. Reference Fletcher, Didham, Banks-Leite, Barlow, Ewers, Rosindell, Holt, Gonzalez, Pardini, Damschen, Melo, Ries, Prevedello, Tscharntke, Laurance, Lovejoy and Haddad2018 for opposite views). Here, we embrace fragmentation in a broad sense, thus including both habitat loss and fragmentation per se. We also focus on fragmentation-related research biases without considering effects on biodiversity.
In this study, we aim to address biogeographic and fragmentation-related biases and knowledge gaps in antbirds (family Thamnophilidae) and non-flying small mammals (hereafter, small mammals, i.e., rodent species of the families Caviidae, Cricetidae, Echimyidae and marsupials of the family Didelphidae, with a body mass < 1.5 kg: Bovendorp et al. Reference Bovendorp, Villar, Abreu-Junior, Bello, Regolin, Percequillo and Galetti2017, Lopes & Mendes-Oliveira Reference Lopes, Mendes-Oliveira, Mendes-Oliveira and Miranda2015, Mendes-Oliveira et al. Reference Mendes-Oliveira, Bobrowiec, Silva, Pinto, Trevelin, Mendes-Oliveira and Miranda2015, Mendonça et al. Reference Mendonça, Percequillo, Camargo, Ribeiro, Palma, Oliveira, Câmara and Vieira2018, Paglia et al. Reference Paglia, Fonseca, Rylands, Herrmann, Aguiar, Chiarello, Leite, Costa, Siciliano, Kierulff, Mende, Tavares, Mittermeier and Patton2012) across Brazilian biomes (i.e., Amazon, Atlantic Forest, Caatinga, Cerrado, Pampa and Pantanal). Brazilian biomes are well-defined regional ecosystems characterised by a dominant vegetation and similar floristic characteristics, climatic conditions and geological structure, which have experienced the same historical processes of landscape formation (IBGE 1992, 2018a). Brazilian biomes have the following equivalence in the classification of Olson et al. (Reference Olson, Dinerstein, Wikramanayake, Burgess, Powell, Underwood, D’amico, Itoua, Strand, Morrison, Loucks, Allnutt, Ricketts, Kura, Lamoreux, Wettengel, Hedao and Kassem2001): Amazon and Atlantic Forest = Tropical and Subtropical Moist Broadleaf Forests; Caatinga = Deserts and Xeric Shrublands; Cerrado and Pampa = Tropical and Subtropical Grasslands, Savannas, and Shrublands; and Pantanal = Flooded Srasslands and Savannas.
Biogeographic research biases were determined considering both the species richness for each taxonomic group and human population density across biomes. We focused on antbirds and small mammals because of their overrepresentation in fragmentation research in Brazil and their vulnerability to anthropogenic impacts on landscape. Mammals and birds together contain >50% of fragmentation-related papers focused on fauna in Brazil and, specifically, small mammals and antbirds represent 46% and 59% for each group, respectively (Teixido et al. Reference Teixido, Gonçalves, Fernández-Arellano, Dáttilo, Izzo, Layme, Moreira and Quintanilla2020; see also Figure 1). Antbirds and small mammals are also frequently used as biological indicators, acting as good predictors of responses to ecosystem changes (Avenant Reference Avenant2011, Pardini et al. Reference Pardini, Bueno, Gardner, Prado and Metzger2010, Piratelli et al. Reference Piratelli, Sousa, Corrêa, Andrade, Ribeiro, Avelar and Oliveira2008). Antbirds show the world’s highest diversity in the Neotropical region (Lepage, Reference Lepage2018) and comprise species highly sensitive to fragmentation due to their limited dispersal capacity in non-forest areas (Sick Reference Sick1997, Zimmer & Isler Reference Zimmer, Isler, Del Hoyo, Elliot and Christie2018). These bird species are mainly insectivorous, thus regulating insect populations and subsequently reducing herbivore-mediated plant damage (Sekercioglu Reference Sekercioglu2006, Van Bael et al. Reference Van Bael, Brawn and Robinson2003, Whelan et al. Reference Whelan, Şekercioğlu and Wenny2015). Small mammals are a diverse group widely distributed worldwide (Eisenberg & Redford Reference Eisenberg and Redford1999, Reis et al. Reference Reis, Peracchi, Pedro and Lima2011), including key components of the trophic webs within communities and playing a relevant role as seed dispersers, contributing to forest regeneration and connectivity between forest remnants (Brewer & Rejmánek Reference Brewer and Rejmánek1999, Galetti et al. Reference Galetti, Guevara, Galbiati, Neves, Rodarte and Mendes2015). Patch area, isolation and habitat quality have been reported in determining the abundance and composition of several small mammal species (Delciellos et al. Reference Delciellos, Vieira, Grelle, Cobra and Cerqueira2016, Prugh et al. Reference Prugh, Hodges, Sinclair and Brashares2008, Santos-Filho et al. Reference Santos-Filho, Peres, Da Silva and Sanaiotti2012).

Figure 1. Percentage of fragmentation papers found in the Web of Science and the Scielo database for different taxonomic groups in Brazil. Numbers on each bar show the total number of fragmentation papers for each taxonomic group.
We used Brazil as a model system for manifold reasons. First, Brazil is a megadiverse and huge country that contains heterogeneous ecosystems such as rainforests, savannas, grasslands and seasonally dry woodlands (Myers et al. Reference Myers, Mittermeier, Mittermeier, Fonseca and Kent2000, Overbeck et al. Reference Overbeck, Vélez-Martin, Scarano, Lewinsohn, Fonseca, Meyer, Müller, Ceotto, Dadalt, Durigan, Ganade, Gossner, Guadagnin, Lorenzen, Jacobi, Weisser and Pillar2015). This large diversity includes the Amazon, the world’s largest rainforest, the Pantanal, one of the world’s largest tropical wetlands, and two biodiversity hotspots, the Atlantic Forest and the Cerrado (Myers et al. Reference Myers, Mittermeier, Mittermeier, Fonseca and Kent2000). However, these biomes have been traditionally managed and human-induced changes have extensively reduced the original vegetation (Lapola et al. Reference Lapola, Martinelli, Peres, Ometto, Ferreira, Nobre, Aguiar, Bustamante, Cardoso, Costa, Joly, Leite, Moutinho, Sampaio, Strassburg and Vieira2014). Second, small mammals and antbirds are unevenly distributed across these biomes (Paglia et al. Reference Paglia, Fonseca, Rylands, Herrmann, Aguiar, Chiarello, Leite, Costa, Siciliano, Kierulff, Mende, Tavares, Mittermeier and Patton2012, Piacentini et al. Reference Piacentini, Aleixo, Agne, Maurício, Pacheco, Bravo, Brito, Naka, Olmos, Posso, Silveira, Betini, Carrano, Franz, Lees, Lima, Pioli, Schunck, Amaral, Bencke, Cohn-Haft, Figueiredo, Straube and Césari2019), which allows us to evaluate biogeographic research effort based on species richness for each biome. Lastly, Brazilian biodiversity is undersampled and research is unevenly distributed among biomes, concentrated near large cities (Oliveira et al. Reference Oliveira, Paglia, Brescovit, Carvalho, Silva, Rezende, Leite, Batista, Barbosa, Stehmann, Ascher, Vasconcelos, De Marco, Löwenberg-Neto, Dias, Ferro and Santos2016, Ribeiro et al. Reference Ribeiro, Teixido, Barbosa and Silveira2016, Teixido et al. Reference Teixido, Gonçalves, Fernández-Arellano, Dáttilo, Izzo, Layme, Moreira and Quintanilla2020). Our study can provide compelling evidence to steer future research effort and to guide decision-making for conservation policies on antbirds and small mammals.
Methods
Data source
We surveyed papers on 30 November 2018 in the Web of Science (hereafter, WOS; www.webofkowledge.com) and the Scielo database (www.scielo.br) to analyse biogeographic bias and subsequent gaps on small mammal and antbird research across Brazilian biomes (Amazon, Atlantic Forest, Caatinga, Cerrado, Pampa and Pantanal). All papers provided by our survey were considered (most recent paper from January 2019). The WOS is an online tool that provides access to a large database comprising more than 9,000 journals about diverse knowledge areas. The Scielo is a free-access database that includes the most relevant Brazilian journals published in English or Portuguese. For the small mammal and antbird research, we searched for ‘small mammals’ and ‘antbirds’ or ‘Thamnophilidae’, respectively, and ‘Brazil’, included in the title, abstract and key words of papers. We also searched for each of the biomes and included a specific survey using the key words in Portuguese to include any paper missing exclusively published in this language. Since several small mammal species are largely used for laboratory experiments with medical purposes, we filtered our selection criteria by selecting the following topics: ‘Biodiversity and conservation’, ‘Biology’, ‘Ecology’, ‘Environmental sciences’, ‘Evolutionary biology’, ‘Forestry’, ‘Parasitology’ and ‘Zoology’. Species richness was recorded in Bovendorp et al. (Reference Bovendorp, Villar, Abreu-Junior, Bello, Regolin, Percequillo and Galetti2017), Mendes-Oliveira et al. (Reference Mendes-Oliveira, Bobrowiec, Silva, Pinto, Trevelin, Mendes-Oliveira and Miranda2015), Mendonça et al. (Reference Mendonça, Percequillo, Camargo, Ribeiro, Palma, Oliveira, Câmara and Vieira2018) and Paglia et al. (Reference Paglia, Fonseca, Rylands, Herrmann, Aguiar, Chiarello, Leite, Costa, Siciliano, Kierulff, Mende, Tavares, Mittermeier and Patton2012) for small mammals, and Piacentini et al. (Reference Piacentini, Aleixo, Agne, Maurício, Pacheco, Bravo, Brito, Naka, Olmos, Posso, Silveira, Betini, Carrano, Franz, Lees, Lima, Pioli, Schunck, Amaral, Bencke, Cohn-Haft, Figueiredo, Straube and Césari2019) for antbirds. We also restricted our data to native species included in those references, respectively. After literature survey, we exclusively selected papers following our criteria (i.e., studies with small mammal or antbird species native to Brazil) based on the title and abstract. Besides the papers found in the databases, we completed the number of publications for small mammals using three recently published reviews (Bovendorp et al. Reference Bovendorp, Villar, Abreu-Junior, Bello, Regolin, Percequillo and Galetti2017 for Atlantic Forest, Mendes-Oliveira et al. Reference Mendes-Oliveira, Bobrowiec, Silva, Pinto, Trevelin, Mendes-Oliveira and Miranda2015 for Amazon, and Mendonça et al. Reference Mendonça, Percequillo, Camargo, Ribeiro, Palma, Oliveira, Câmara and Vieira2018 for Cerrado).
Subsequently, we selected the fragmentation papers for each taxonomic group based on landscape ecology metrics (i.e., connectivity, deforestation, edge effect, fragment number, fragment size, habitat quality, habitat loss, land use change and matrix quality). We excluded those papers conducted on naturally fragmented landscapes (e.g., natural forest patch interspersed in a non-forest ecosystem). The results of our criteria that included any of the taxonomic groups are hereafter called ‘general papers’ (i.e., papers intended to examine biogeographic biases), whereas those studies exclusively related to fragmentation are denominated as ‘fragmentation papers’. Therefore, general papers include fragmentation-related studies.
Data analysis
To determine biogeographic research bias (i.e., across biomes), we obtained geographic coordinates showed in the papers for each taxonomic group. When coordinates were missing, they were procured from the studied sites by point plotting using the Google Earth satellite imagery. Subsequently, we sorted out the geographic coordinates between general and fragmentation papers for each taxon. We used the ArcGis 10.5 software (ESRI, Redlands, California, USA) to assess the density of studies for each biome by elaborating density raster layers by kernel interpolation (Oliveira et al. Reference Oliveira, Brescovit and Santos2015, Ribeiro et al. Reference Ribeiro, Teixido, Barbosa and Silveira2016, Yang et al. Reference Yang, Ma and Kreft2013) with a resolution of 0.0083º (˜1 km). To do this, we used the geographical coordinates included in the papers together with the coordinates that we obtained from the study sites as explained above. Therefore, each point in our kernel density maps corresponds to a sampling point with a specific coordinate. The official limits of the Brazilian biomes were acquired from the Brazilian Institute of Geography and Statistics (IBGE 2010a). The kernel interpolation method is based on the definition of circular areas of influence around occurrence points (i.e., sampling points) of a phenomenon. Within the area of influence, the occurrence of the phenomenon decreases from the point to the limits according to a Gaussian function (Silverman Reference Silverman1986). Thus, the kernel density calculates the density of points around each output raster cell and the kernel density values indicate the studies’ density per square kilometre. For example, the more the quantity of occurrence points within a given area of influence, the higher the density, whereas the more the spreading of points within a specific area, the larger the circular area around the points. We calculated a default search radius (bandwidth) based on the spatial configuration and number of input points, showing the best visual result of the data distribution (Silverman Reference Silverman1986). We generated four maps, each including either general or fragmentation papers on small mammals and antbirds, respectively, depicting areas with higher or lower density of studies by a red-to-blue (i.e., high-to-low) colour gradient. To determine differences in density among biomes for each of maps, we generated 50,000 uniformly random points within the whole country and subsequently calculated the mean kernel density values for each biome (Ribeiro et al. Reference Ribeiro, Teixido, Barbosa and Silveira2016). To test differences in mean kernel density values among biomes for each map, we conducted a Generalised Linear Model (GLM) assuming a quasi-Poisson distribution with subsequent Tukey’s post hoc test to compare significant differences among biomes. Within each map, we also included a smaller map showing the most current data for human population in Brazil (IBGE 2010b). Thus, our maps depict areas with higher or lower density of studies comparing with more or less populated cities across the country, beyond merely showing differences in kernel density among biomes. Although the maps show sampling points rather than number of studies as most of the papers included several sampling points with a specific coordinate, density of studies is still depicted since the number of studies and sampling points were proportional for both antbirds and small mammals for each biome (Table S1).
We also regressed the number of general papers for both small mammals and antbirds against (1) the species richness for each taxonomic group and (2) human population density, thus considering biome area and population, which influences on the number of research institutions in Brazil (Ribeiro et al. Reference Ribeiro, Teixido, Barbosa and Silveira2016), for each biome. For both taxonomic groups, the percentages of papers and richness per biome over the total number of articles and number of species, respectively, and the percentage of human population density per biome were previously calculated and subsequently squared root-transformed to improve normality (Ribeiro et al. Reference Ribeiro, Teixido, Barbosa and Silveira2016). After the regression, a t-test was used to compare the slopes between the expected (i.e., b ± SE = 1 ± 0) and the observed relationship for each biome (Zar Reference Zar1999). When the observed slope is significantly >1, the bias is positive (i.e., the increase in number of papers is disproportionately higher than the increase in biome richness for each group), and when slope is <1 the bias is negative (i.e., the increase in number of papers is disproportionately lower than the increase in biome richness for each group). We followed the same procedure to evaluate whether the number of fragmentation papers is proportional to the number of general papers. Thus, we regressed the squared root-transformed percentage of the number of fragmentation papers which each biome contributed against squared root-transformed percentage of the number of papers that included that biome. All analyses were conducted in R, version 3.6.2 (R Core Development Team 2018).
Results
Our search for general papers for the two taxonomic groups resulted in 566 articles published from 1945 to 2018. Small mammals were the most studied group, containing four times the number of publications of antbirds (451 vs. 115, respectively; Figure 2). The richness of small mammals and antbirds in Brazil is 254 and 188 species, respectively. However, some species occur in two or more biomes, so richness per biome does not show endemicity (Figure 2). The greatest richness of small mammals is recorded for the Atlantic Forest, but both the Amazon and the Cerrado show a number of species close to the Atlantic Forest (Figure 2A). Otherwise, Amazon is clearly dominant for antbird richness in relation to the other biomes (Figure 2B).
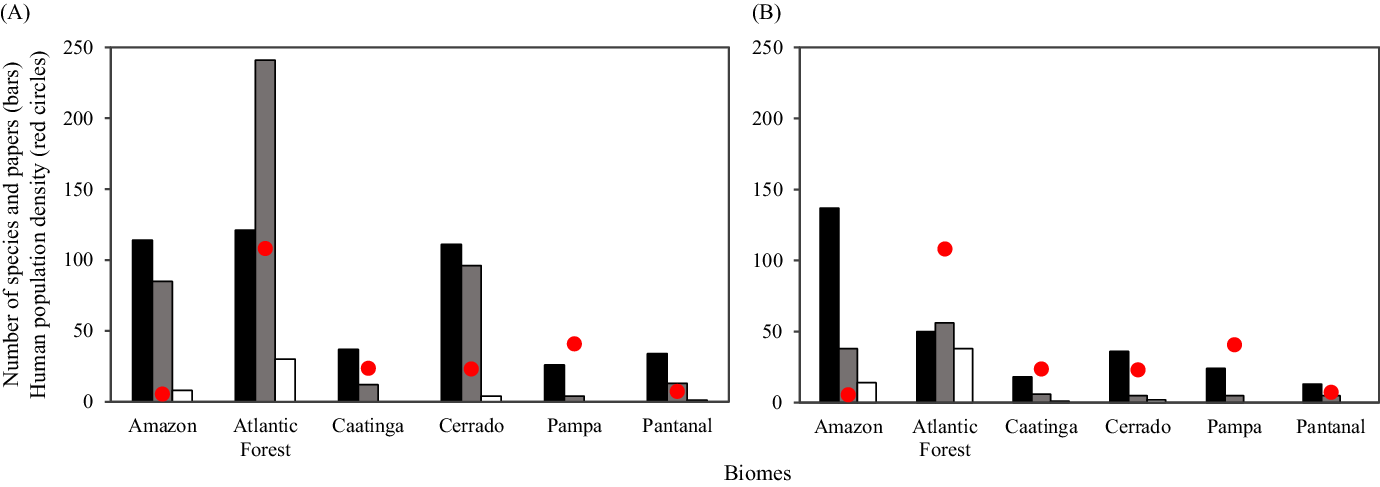
Figure 2. Species richness (black bars), number of general papers (grey bars), number of fragmentation papers (white bars) published from 1945 to 2018 and human population density (inhabitants/km2; red circles) across Brazilian biomes for (A) small mammals and (B) antbirds.
The Atlantic Forest, the most densely populated biome, contained about 50% of general papers for both taxonomic groups, which represents about two times more publications on small mammals than the Amazon and the Cerrado, and 1.4 times more general papers on antbirds than the Amazon (Figure 2). Overall, the Atlantic Forest also showed the highest kernel mean density (i.e., higher number and spatial coverage of studies and corresponding sampling points), and studies were also mostly concentrated near the largest and most human-populated cities (Figures 3 and 4). However, the Amazon showed a disproportionately high number of studies considering its low human population density, whereas the biomes with the lowest number of species were also less researched (i.e., Caatinga, Pampa and Pantanal), specially for small mammals when comparing with the richest biomes (Figure 2). Following these patterns, we found a trend for a positive biogeographic bias for small mammals when considering their richness, as the number of studies tended to disproportionally increase with increasing the number of species across biomes (Figure 5A). For antbirds, we found a proportional research effort, that is, the number of studies tended to proportionately increase with richness across biomes (Figure 5B). Otherwise, we detected a biogeographic negative bias for both taxonomic groups when considering human population density (Figure 5C,D). This implies that less densely populated biomes (e.g., Amazon) contained disproportionately more studies than most densely populated biomes (e.g., Atlantic Forest).

Figure 3. Mean kernel density across Brazilian biomes containing general papers for small mammals. The kernel density shows the number and distribution of sampling points (i.e., geographical coordinates included in the papers together with the coordinates that we obtained from the study sites using Google Earth, represented by the black dots), which is proportional to the number of studies for each biome (Table S1). The smaller map on the lower left margin shows the human population following the Brazilian Institute of Geography and Statistics (IBGE 2010b). Different letters in the boxplot show significant differences in mean kernel density (P < 0.05).

Figure 4. Mean kernel density across Brazilian biomes containing general papers for antbirds. The kernel density shows the number and distribution of sampling points (i.e., geographical coordinates included in the papers together with the coordinates that we obtained from the study sites using Google Earth, represented by the black dots), which is proportional to the number of studies for each biome (Table S1). The smaller map on the lower left margin shows the human population following the Brazilian Institute of Geography and Statistics (IBGE 2010b). Different letters in the boxplot show significant differences in mean kernel density (P < 0.05).

Figure 5. Relationship between the number of general papers and species richness for (A) small mammals and (B) antbirds, and between the number of general papers and human population density for (C) small mammals and (D) antbirds across Brazilian biomes. The black dots correspond to the biomes, the solid lines show the observed slope of the regression and the dashed lines show the expected slope (i.e., b ± SE = 1 ± 0).
The number of fragmentation papers involving antbirds and small mammals was 55 and 43, respectively, published from 1989 to 2018. This entails about the half of general papers (48%) for antbirds and near 10% for small mammals. Across the Brazilian biomes, most fragmentation papers studying small mammals or antbirds were conducted in the Atlantic Forest (about 70% for each group; Figure 2). The Caatinga and the Pampa for small mammals and the Pampa and the Pantanal for antbirds did not include any fragmentation-related paper (Figure 2).
Similar to general papers, this biographic bias translated into the highest kernel density in the Atlantic Forest concentrated near the most human-populated cities, but also near two cities in the Amazon (Manaus and Alta Floresta) for both groups (Figures 6 and 7). The number of fragmentation papers showed a trend to disproportionately increase in relation to the number of general papers for antbirds across biomes, but it was proportional for small mammals (Figure 8).

Figure 6. Mean kernel density across Brazilian biomes containing fragmentation papers for small mammals. The kernel density shows the number and distribution of sampling points (i.e., geographical coordinates included in the papers together with the coordinates that we obtained from the study sites using Google Earth, represented by the black dots), which is proportional to the number of studies for each biome (Table S1). The smaller map on the lower left margin shows the human population following the Brazilian Institute of Geography and Statistics (IBGE 2010b). Different letters in the boxplot show significant differences in mean kernel density (P < 0.05).

Figure 7. Mean kernel density across Brazilian biomes containing fragmentation papers for antbirds. The kernel density shows the number and distribution of sampling points (i.e., geographical coordinates included in the papers together with the coordinates that we obtained from the study sites using Google Earth, represented by the black dots), which is proportional to the number of studies for each biome (Table S1). The smaller map on the lower left margin shows the human population following the Brazilian Institute of Geography and Statistics (IBGE 2010b). Different letters in the boxplot show significant differences in mean kernel density (P < 0.05).

Figure 8. Relationship between the number of fragmentation papers and general papers for (A) small mammals and (B) antbirds across Brazilian biomes. The black dots correspond to the biomes, the solid lines show the observed slope of the regression and the dashed lines show the expected slope (i.e., b ± SE = 1 ± 0).
Discussion
Our study shows compelling evidence that research on small mammals and antbirds in Brazil is geographically biased. We demonstrate that the Atlantic Forest, the most densely populated biome with the most human-populated cities, contained the highest number and density of publications for both taxonomic groups, but studies included in the Amazon were disproportionately numerous considering the low human population density of this biome. Conversely, non-forest biomes were clearly undersampled, especially the Caatinga, Pampa and Pantanal. These findings reinforce the assumption that the Brazilian biodiversity research is unevenly distributed among biomes, concentrated near large cities (Oliveira et al. Reference Oliveira, Paglia, Brescovit, Carvalho, Silva, Rezende, Leite, Batista, Barbosa, Stehmann, Ascher, Vasconcelos, De Marco, Löwenberg-Neto, Dias, Ferro and Santos2016, Ribeiro et al. Reference Ribeiro, Teixido, Barbosa and Silveira2016). In agreement with our general results, the Atlantic Forest, the most fragmented biome (Lapola et al. Reference Lapola, Martinelli, Peres, Ometto, Ferreira, Nobre, Aguiar, Bustamante, Cardoso, Costa, Joly, Leite, Moutinho, Sampaio, Strassburg and Vieira2014), included a disproportional prevalence of fragmentation-related studies for small mammals and antbirds in relation to the number of fragmentation papers in other biomes. Although the effects of fragmentation on these groups and the number of threatened species considered were beyond of our scopes, our findings show practical evidence to guide research effort and overcome knowledge gaps, thus providing efficient management recommendations.
Several non-exclusive reasons are feasible to account for the predominance of studies for small mammals and antbirds in the Atlantic Forest: the highest human population density and largest cities (Rio de Janeiro and São Paulo) in Brazil and, subsequently, more research institutions, easy accessibility to sampling areas, and high fragmentation rates. Oversampling in highly human-populated locations is a prevalent issue in biodiversity studies (e.g., Pautasso & McKinney Reference Pautasso and McKinney2007) and it has been previously reported in Brazil (Arruda et al. Reference Arruda, Sousa, Teresa, Prado, Cunha and Izzo2018, Oliveira et al. Reference Oliveira, Paglia, Brescovit, Carvalho, Silva, Rezende, Leite, Batista, Barbosa, Stehmann, Ascher, Vasconcelos, De Marco, Löwenberg-Neto, Dias, Ferro and Santos2016). Some of the main research centres in the country (e.g., USP, UNIFESP, UNESP, UFRJ or National Museum of Brazil) are in cities within the Atlantic Forest biome, so researchers therein tend to focus field collections and studies on sites near their institutions (see Oliveira et al. Reference Oliveira, Paglia, Brescovit, Carvalho, Silva, Rezende, Leite, Batista, Barbosa, Stehmann, Ascher, Vasconcelos, De Marco, Löwenberg-Neto, Dias, Ferro and Santos2016). Likewise, the Atlantic Forest has been traditionally altered by human pressure, resulting in high fragmentation rates of native vegetation (Lapola et al. Reference Lapola, Martinelli, Peres, Ometto, Ferreira, Nobre, Aguiar, Bustamante, Cardoso, Costa, Joly, Leite, Moutinho, Sampaio, Strassburg and Vieira2014). This elevated habitat alteration associated with high human population density in this biome may potentially explain the overrepresentation of fragmentation-related studies for antbirds and small mammals in the Atlantic Forest, mainly concentrated on forest remnants (see Bovendorp et al. Reference Bovendorp, Villar, Abreu-Junior, Bello, Regolin, Percequillo and Galetti2017 for small mammals).
However, representation of studies in the Amazon, the largest and least densely populated biome, showed a disproportional increase in relation to the other biomes when considering human population density. This finding suggests that accessibility, especially through navigable rivers, is not so restricted as previously reported to perform research in the Amazon Basin (Mendes-Oliveira et al. Reference Mendes-Oliveira, Bobrowiec, Silva, Pinto, Trevelin, Mendes-Oliveira and Miranda2015, Oliveira et al. Reference Oliveira, Paglia, Brescovit, Carvalho, Silva, Rezende, Leite, Batista, Barbosa, Stehmann, Ascher, Vasconcelos, De Marco, Löwenberg-Neto, Dias, Ferro and Santos2016). Additionally, fragmentation research on antbirds and small mammals in the Amazon, concentrated near Manaus and Alta Floresta, demonstrates that fragmentation-related studies have been mostly conducted by two important research projects, the BDFFP (Biological Dynamics of Forest Fragments Project) and the PETRA (Plataforma Experimental para Gestão dos Territórios Rurais na Amazônia Legal), respectively. Specifically, the BDFFP is the world’s largest and ancient project about habitat fragmentation and its impacts on the Amazon biodiversity (Laurance et al. Reference Laurance, Camargo, Luizão, Laurance, Pimm, Bruna, Stouffer, Williamson, Benitez-Malvido, Vasconcelos, Van Houtan, Zartman, Boyle, Didham, Andrade and Lovejoy2011).
Studies for antbirds and small mammals were mostly overlooked in the non-forest Brazilian biomes, especially in relation to fragmentation. Biological and ecological research in non-forest biomes in this country has been historically neglected (Overbeck et al. Reference Overbeck, Müller, Fidelis, Pfadenhauer, Pillar, Blanco, Boldrini, Both and Forneck2007, Santos et al. Reference Santos, Leal, Almeida-Cortez, Fernandes and Tabarelli2011), and a similar pattern has been recently reported to fragmentation research (Teixido et al. Reference Teixido, Gonçalves, Fernández-Arellano, Dáttilo, Izzo, Layme, Moreira and Quintanilla2020), but they include large areas of native vegetation transformed into pasture and crops (Overbeck et al. Reference Overbeck, Vélez-Martin, Scarano, Lewinsohn, Fonseca, Meyer, Müller, Ceotto, Dadalt, Durigan, Ganade, Gossner, Guadagnin, Lorenzen, Jacobi, Weisser and Pillar2015). The intensive and traditional land use for farming in the Caatinga and the Pampa grasslands have resulted in high habitat loss rates in these biomes (IBGE 2018b). Even in the Pantanal, the Brazil’s best-conserved and least-populous biome, the spread of pastures and invasive species has considerably reduced the area of the native vegetation during the last 30 years (MapBiomas 2017). The Cerrado, the second largest and most densely human-populated biome, was especially undersampled for antbirds. This pattern may be due to the low number of specialists working on this group in the Cerrado, when compared to its richness. Given that the Cerrado is a biodiversity and priority conservation hotspot (Myers et al. Reference Myers, Mittermeier, Mittermeier, Fonseca and Kent2000, Strassburg et al. Reference Strassburg, Brooks, Feltran-Barbieri, Iribarrem, Crouzeilles, Loyola, Latawiec, Oliveira Filho, Scaramuzza, Scarano, Filho and Balmford2017), and the third most degraded biome in Brazil due to increasing expansion of agriculture, livestock and mining (Lapola et al. Reference Lapola, Martinelli, Peres, Ometto, Ferreira, Nobre, Aguiar, Bustamante, Cardoso, Costa, Joly, Leite, Moutinho, Sampaio, Strassburg and Vieira2014), the low number of studies conducted is somewhat worrying. Overall, our results reinforce the importance of increasing research and overcoming knowledge gaps, as well as monitoring fragmentation-related studies in the growing anthropogenic degradation of non-forest Brazilian biomes.
The knowledge shortfalls in the studied animal groups resulting from biased research in Brazil may depict subsequent gaps related to biological, ecological and/or functional responses of species to the impact of human-induced environmental changes and ecosystem services they provide (Chapin III et al. Reference Chapin, Zavaleta, Eviner, Naylor, Vitousek, Reynolds, Hooper, Lavorel, Sala, Hobbie, Mack and Díaz2000, Mason et al. Reference Mason, Mouillot, Lee and Wilson2005, Whelan et al. Reference Whelan, Şekercioğlu and Wenny2015). Antbirds regulate insect populations and reduce damage to plants due to their insectivorous diet (Sekercioglu Reference Sekercioglu2006, Van Bael et al. Reference Van Bael, Brawn and Robinson2003, Whelan et al. Reference Whelan, Şekercioğlu and Wenny2015), whereas small mammals play important roles in the trophic web and seed or mycorrhizal fungus dispersal (Galetti et al. Reference Galetti, Guevara, Galbiati, Neves, Rodarte and Mendes2015, Grenha et al. Reference Grenha, Macedo, Pires and Monteiro2010). Therefore, overcoming knowledge gaps on antbirds and small mammals and assessing their responses to fragmentation across different biomes are of paramount importance to fully understand the consequences of habitat degradation in forest and non-forest ecosystems.
In summary, the results reported here show that there are major gaps resulting of uneven research on antbirds and small mammals, mostly across non-forest biomes containing a lower number of species. Still, these biomes have been traditionally managed or are increasingly being degraded by anthropogenic actions and, consequently, further research determining the effects of fragmentation on these animal groups, especially relevant to ecosystem services, is required. We call future investigation to consider more studies across non-forest biomes and vast unexplored areas within forest biomes (e.g., Amazon) to better understand the diversity, distribution and ecology of antbirds and small mammals in Brazil, a megadiverse, unevenly sampled, country.
Supplementary material
To view supplementary material for this article, please visit https://doi.org/10.1017/S0266467421000250
Acknowledgements
We thank two anonymous reviewers for the suggestions provided during the earlier versions of the manuscript. Rafael de A. Barros contributed to data collection. This work results from Seminars I and II offered by the Postgraduate Program in Ecology and Biodiversity Conservation from the Federal University of Mato Grosso, Brazil. We thank Tiago V. Ferreira for his assistance during image editing.
Financial support
The Coordenação de Aperfeiçoamento de Pessoal de Nível Superior (CAPES) and the Fundação de Amparo à Pesquisa do Estado de Mato Grosso (FAPEMAT) granted PhD scholarships to LPC, MZ, SRAG and GSFB. TJI is supported by CNPq (309552/2018-4).


