


Ecologists have long been intrigued to explain the organisation of species within ecological communities. The two most influential concepts explaining the organisation of species within ecological communities are island biogeography and niche. The former explicates island size and geographic isolation while the latter explains habitat preference and resource partitioning as determinants of species richness (Vendermeer Reference Vendermeer1972). Based on the niche concept, the landscape heterogeneity hypothesis assumes that increasing landscape heterogeneity enhances species diversity (Rosenzweig Reference Rosenzweig1995). The heterogeneous landscape offers more niches and resources, providing species with a wide range of habitat preferences, foraging tactics, and prey to co-exist.
Landscape heterogeneity has two components: compositional and configurational heterogeneity (Gustafson Reference Gustafson1998). The former simply refers to the variation in the number and proportion of different cover types in a landscape, while configurational heterogeneity refers to variations in shapes of patches and their spatial arrangement (Li & Reynolds Reference Li and Reynolds1995). Landscape with high compositional heterogeneity supports more species (Anderson Reference Anderson2001; Bonilla et al. Reference Bonilla, León-Cortés and Rangel-Salazar2012; Katayama et al. Reference Katayama, Amano, Naoe, Yamakita, Komatsu, Takagawa, Sato, Ueta and Miyashita2014). Theoretically, two mechanisms were proposed underpinning the increasing richness of birds in a landscape with high compositional heterogeneity a) a heterogeneous landscape is likely to support more species owing to the specialisation on various resources (Benton et al. Reference Benton, Vickery and Wilson2003) and b) reduced competition between species in heterogeneous landscape (Fahrig et al. Reference Fahrig, Baudry, Brotons, Burel, Crist, Fuller, Sirami, Siriwardena and Martin2011). Additionally, a heterogeneous landscape is likely to support species that require two or more resources found in different cover types (landscape complementation; Dunning et al. Reference Dunning, Danielson and Pulliam1992). Accordingly, researchers have found a positive association between landscape compositional heterogeneity and species richness (Anderson Reference Anderson2001; Bonilla et al. Reference Bonilla, León-Cortés and Rangel-Salazar2012; Katayama et al. Reference Katayama, Amano, Naoe, Yamakita, Komatsu, Takagawa, Sato, Ueta and Miyashita2014; Lee & Martin Reference Lee and Martin2017; Ke et al. Reference Ke, Sibiya, Reynolds, McCleery, Monadjem and Fletcher2018). However, the strength of the relationship between landscape and biological variables varies with the spatial extent to which those are measured (Graf et al. Reference Graf, Bollmann, Suter and Bugmann2005; Boscolo & Metzger Reference Boscolo and Metzger2009; Morelli et al. Reference Morelli, Pruscini, Santolini, Perna, Benedetti and Sisti2013; Gestich et al. Reference Gestich, Arroyo-Rodríguez, Ribeiro, da Cunha and Setz2018) and the selection of a wrong scale may result in drawing erroneous conclusions. Hence, it would be imperative to determine response to landscape compositional heterogeneity at the scale of effect that is able to explain the most resilient relationship between landscape variables and biological responses (Jackson & Fahrig Reference Jackson and Fahrig2014).
Evidences suggest that different bird groups do not seem to perceive compositional heterogeneity similarly as their responses are variable. DeGraaf and Yamasaki (Reference DeGraaf and Yamasaki2003) illustrated that the reduction in patch size from a particular threshold (0.8 ha) could lead to the extinction of some shrubland species in the north-eastern United States. Ries et al. (Reference Ries, Fletcher, Battin and Sisk2004) concluded that the increased edge densities in a landscape attract generalist species at the expense of habitat specialists. Gil-Tena et al. (Reference Gil-Tena, Torras and Suara2008) found a positive influence of compositional heterogeneity (forest tree canopy cover diversity) on generalist birds and no influence on the specialist. Katayama et al. (Reference Katayama, Amano, Naoe, Yamakita, Komatsu, Takagawa, Sato, Ueta and Miyashita2014) opined that the heterogeneous landscapes benefit generalist species more than specialists.
Similarly, the birds of different feeding guilds are expected to respond differently because of diverse resource utilisation patterns and ecological tolerance. In southern Mexico, Bonilla et al. (Reference Bonilla, León-Cortés and Rangel-Salazar2012) found a positive influence of landscape compositional heterogeneity on birds of insectivore, frugivore, and granivore guilds, whereas omnivore and insectivore guilds were independent of such heterogeneity. In another study, Anderson (Reference Anderson2001) showed a positive relationship between the richness of raptors and landscape compositional heterogeneity in north-eastern Honduras.
Furtherance to the studies conducted elsewhere, and considering fewer such studies from tropics; we carried out this study in the mosaic landscape of Uttarakhand, India. The study was aimed to investigate a) the response of various avifaunal feeding guilds to the landscape compositional heterogeneity, b) the effect of scale on the biological response of feeding guilds to landscape variables, and c) drivers of the richness of overall bird species and various feeding guilds. The study is expected to fill the gap in our understanding of ecological patterns in tropics arising out of the effects of landscape heterogeneity and corresponding biological response of avian species and feeding guilds.
Methods
Study area
Ramnagar Forest Division (RFD), encompassing an area of 487 km2, is a multiple-use reserve forest and a part of the Terai-Arc landscape located in the Uttarakhand state of India (20013’40”- 29033’10 N & 7905’50”- 79032’40” E, Figure 1). The northern portion of RFD is occupied by the tertiary foothill rocks of Shivalik and the southern by the alluvium of Gangetic plains. The terrain is hilly with gentle slopes (50 to 100) alternating with flat areas and an altitude ranging between 307 and 1892 masl. Precipitation in the area is about 1925 mm, with an average relative humidity fluctuating between 60% and 70%. RFD represents a mosaic of tropical moist deciduous fragments such as Sal (Shorea robusta) forest, Sal-mixed forest, mixed forest, teak (Tectona grandis) plantations in various compositions and configurations intermixed with water bodies, human habitation, and barren land. Besides rich avifaunal diversity (Ahmed et al. Reference Ahmed, Bargali and Khan2019), the region supports a sizeable population of species of conservation importance, e.g. tiger (Panthera tigris), leopard (Panthera pardus), along with several species of wild herbivores (Jhala et al. Reference Jhala, Qureshi and Gopal2015).

Figure 1. Location of the study area and survey sites in Terai-Arc Landscape, Uttarakhand, India. The subset represents scales (0.5–1.75 km) of evaluating landscape variables; Shannon’s diversity (SHDI), edge density, and area of various landcover types around sampling locations.
Bird sampling
Data on bird species richness were collected employing Mckinnon’s Species Richness method (MacKinnon & Phillips 1993) on a kilometre linear transect at 30 randomly selected sampling sites within Ramnagar FD (Figure 1). Transects were laid at an altitude ranging between 400 and 900 masl keeping a minimum distance of one km between two transects, to maintain independence among samples (Buckland Reference Buckland2006). Each transect was traversed three times during morning hours (winters: 08.00–10.30 h, summer: 07.00–09.00 h) between mid-November 2016 and June 2017 to record the presence of avifaunal species. All the bird species identified by sight or sound within 30 m on either side of the transect were enumerated. A species considered present at a survey site if sighted at least once during the survey over the study period. Sampling was not carried out during adverse climatic conditions like rainy, cloudy, and foggy days.
Guild classification
The recorded bird species were grouped into the following eight feeding guilds according to their predominant food and feeding habits as adult individuals, following Ali & Ripley (Reference Ali and Ripley1983). The carnivore guild included species preying mainly upon animals (birds and rodents), excluding insects, while the insectivore guild included those species predominantly preying upon insects, earthworms, small crustaceans, and arthropods (Lim & Sodhi Reference Lim and Sodhi2004; Sohil & Sharma Reference Sohil and Sharma2020). Seed and grain-eating birds (e.g. doves and pigeons) were grouped under granivore and nectar-feeding birds (e.g. sunbirds) under the nectarivore guilds. Species feeding predominantly on fruits (e.g. barbet Megalaima spp.) were grouped in the frugivore guild and those feeding upon insects and fruits (e.g. bulbuls Pycnonotus spp.) in the frugi-insectivore guild. Species feeding predominantly on fish (e.g. kingfishers) were grouped under the piscivore guild and those mainly feeding on human refuse, plant, and animal material (e.g. House crow Corvus splendens) were categorised under the omnivore guild.
Landscape variables
A land use/land cover map of RFD (ESRI GRID; projection, UTM; datum, WGS 1984, cell size; 30 m) was prepared to classify Landsat 8 Operational Land Imager (OLI)/Thermal Infrared Sensor (TIRS) image with an accuracy of 87%, acquired on April 2015 (see Ahmed et al. Reference Ahmed, Bargali, Verma and Khan2018 for methodology). Eleven types of landscape elements were recognised a) Sal forest, b) Sal-mixed forest, c) mixed forest, d) teak plantation, d) scrubland, e) moist riverine forest, f) dry riverine forest, g) barren land, h) waterbody, i) agriculture with human habitation, and k) plantations. A classified image was used as a basic input data layer for landscape metrics around sampling sites in FRAGSTAT v. 4.2 (McGarigal & Marks Reference McGarigal and Marks1995). We used the circular moving window tool to evaluate landscape variables those representing proportions of various land cover types, edge density, Shannon’s diversity of land cover types at six spatial scales; 0.5 km (78.5 ha), 0.75 km (175.6 ha), 1 km (314 ha), 1.25 km (490.6 ha), 1.5 km (706.5 ha), and 1.75 km (961.6 ha, Table 1).
Table 1. Description of landscape variables used in determining the factors associated with avian species richness

Data analysis
There are two most widely used analytical approaches in ecological studies dealing with the biological responses of certain factors along the environmental gradient. One is collecting field data through replicate sampling at a few predefined predictors’ levels along the environmental gradient and analysing it using ANOVA. Another is continuous sampling along the environmental gradient without replicates and analysing data through regression. Aside from the aforementioned approaches, we employed a recently transformed replicate regression-based experimental design that requires reduced replicates, but higher numbers of predictor levels as Cottingham et al. (Reference Cottingham, Lennon and Brown2005) recommended. Using this approach, sampling of an intermediate number of predictor levels (10–15) in combination with a low number of replicates (three or four replicates) is appropriate to achieve the highest possible prediction success for a systematic error of ≤10% of total variation (Schweiger et al. Reference Schweiger, Irl, Steinbauer, Dengler and Beierkuhnlein2016). Jenkins and Quintana-Ascencio (Reference Jenkins and Quintana-Ascencio2020) opined that accurate inference might be drawn with a minimum of 8 predictor levels with low variance and 25 predictor levels with high variance in a linear regression. Following replicate regression-based experimental design, we collected data at 30 sampling sites with three replicates.
The overall bird species richness at each sampling site was calculated by pooling all species recorded during three surveys, while the feeding guild’s richness was ascertained simply by the number of species belonging to each guild. We assessed the spatial independence of our response variables using Moran’s I index and did not find any auto-correlation (Table S1.1). Landscape compositional heterogeneity around each sampling site was determined using the value of Shannon’s diversity index. The index value “zero” indicates no heterogeneity (only a single land cover type is present), and it increases with the increasing number of land cover types (McGarigal & Marks Reference McGarigal and Marks1995). We then constructed univariate regression models at each spatial scale using Shannon’s diversity as the predictor variable to investigate the response of overall bird species and each feeding guild’s richness to landscape compositional heterogeneity. The values of response variables, the overall bird species, and each feeding guild’s richness were subjected to log transformation before analysis. Among the six models, thus constructed for each response variable, the best one; with the lowest AIC value, explaining the significant relationship between richness and landscape diversity was accepted.
We developed a series of predictive models using the MuMIn package of R statistical software (R Development Core Team, 2005) to determine the landscape variable(s) that significantly govern overall bird species and various feeding guilds’ richness. In order to do so, we constructed generalised linear models (GLM), assuming Poisson distribution (McCullagh & Nelder Reference McCullagh and Nelder1989) using bird species and feeding guild’s richness as response variables and landscape variable(s) extracted from the univariate regression (Table S2.1) as predictors. This approach helped in selecting significant landscape variable(s) at the scale of effect. To avoid multicollinearity among the extracted landscape variables, we performed Pearson’s cross-correlation (Table S3.1–3.7) and variables with a cross-correlation value < ±0.60 were included in the predictive models. Univariate GLM was performed for piscivore and frugivore guilds as there was only one landscape variable significantly associated with the species richness (Table S2.1). Models with landscape variables at multiple scales have high predictive performance than single-scale models (Boscolo & Mertzger Reference Boscolo and Metzger2009; Rostro-Garcia et al. Reference Rostro-Garcia, Tharchen, Abade, Astaras, Cushman and Macdonald2016).
Model selection was based on Akaike’s Information Criterion corrected for small sample size (AICc). Models with ΔAICc<2 were considered equally plausible (Burnham & Anderson Reference Burnham and Anderson2002). For each predictive model, we also calculated Akaike weights to provide information on the probability that a particular model was selected as the best fitting model among the set of models if the data is gathered again under identical circumstances (Whittingham et al. Reference Whittingham, Stephens, Bradbury and Freckleton2006). When none of the models was found to be a clear best model, we developed an average-weighted model using all the plausible (ΔAICc<2) models. We also calculated the importance value of each predictor in the average model by summing the Akaike weights of all models that contained a particular predictor variable (Burnham Reference Burnham2015). The landscape variable having the largest Akaike weight was considered most important (Burnham Reference Burnham2015).
Results
A total of 228 bird species were recorded at 30 sampling sites (range: 24–81 species), representing nine feeding guilds. The majority of birds belonged to the insectivore guild (138 species, 59.7%), followed by carnivore (26 species, 11.3%), omnivore (21 species, 9.1%), frugivore (16 species, 6.9%), granivore (15 species, 6.5%), frugi-insectivore and piscivore (5 species, 2.2% each), and nectarivore (4 species, 1.7%) guilds. Only one species belonging to the herbivore guild was recorded, and hence, it was excluded from the analysis (Table S4.1).
Response to landscape compositional heterogeneity
The richness of bird species and most analysed feeding guilds, viz. carnivore, frugi-insectivore, insectivore, granivore, nectarivore, and omnivore, were significantly associated with the landscape diversity (+β coefficients) while frugivore and piscivore remained unaffected (Table 2). The strength of relationships between richness and landscape diversity varied across spatial scales. The percent variance explained by R2 values at various spatial scales ranged between 19.2% and 48.9% for overall bird species richness. In case of feeding guilds, it was between 11.2% and 14.3% for carnivore, 42.0% and 55.9% for granivore, 6.9% and 26.7% for insectivore, 14.2% and 45.9% for frugi-insectivore, 13.9% and 29.0% for nectarivore, and 14.7% and 23.9% for omnivore guilds (Table 2). The relationship between overall bird species richness and landscape diversity was strongest at the 0.75-km spatial scale (β = 0.221, r2 = 0.444). At the level of feeding guild’s richness, the strongest relationship was recorded at a spatial scale of 0.5 km for frugi-insectivore (β = 0.3735, r2 = 0.459) followed by nectarivore (β= 0.1496, r2= 0.29) and omnivore (β = 0.2074, r2 = 0.239). The best fit relationship for insectivore guild (β = 0.1775, r2 = 0.267) was at a spatial scale of 0.75 km, for granivore (β = 0.4361, r2 = 0.559) at 1 km and for carnivore (β = 0.2967, r2 = 0.143) at 1.5 km (Table 2).
Table 2. Response of bird species and feeding guilds to landscape diversity at various spatial scales (0.5–1.75 km) in Ramnagar Forest Division, Uttarakhand, India.

The scale of effect (the model with lowest AICc value) is highlighted in bold. P value represents the level of significance between response and landscape variables (*P < 0.05, **P < 0.01, ***P < 0.001, ns: not significant).
Drivers of species richness
The results of GLMs indicate that both landscape composition and configuration variables govern the richness of overall bird species and feeding guilds. Out of 65 models, only one for overall bird species richness was within 2 AIC units apart (Appendix 10.27). Among the candidate models for the richness of feeding guilds, two (of 32) models for frugi-insectivore guild, four (of eight) models for carnivore, five (of 32) models for insectivore, five (of 8) models for nectarivore, four (of 32) models for omnivore, eight (of 64) models for granivore, and two (of eight) models for herbivore guilds were within 2 AICc units. Only one model was developed each for frugivore and piscivore guilds (Table S2). The Akaike weights of most parsimonious models (<2 ΔAICc) for feeding guilds were less than 0.9, suggesting that no single model can be considered as the clear best model of guild’s richness (Table S5.1).
The average-weighted model identified barren land (β coefficients =+ve; Importance = 0.63) and waterbody (+ve, 0.45) as significant drivers of carnivore guild’s richness. The predictor variables for granivore guild were human habitation/agriculture (+ve, 0.68), teak plantation (+ve, 0.68), barren land (+ve, 0.99), edge density (+ve, 0.44), and scrubland (+ve, 0.53). For insectivore guild, teak plantation (+ve, 0.75), dry-riverine forest (−ve, 0.48) and Sal-mixed forest (+ve, 0.75); for frugi-insectivore guild, dry-riverine forest (−ve, 0.51) and edge density (+ve, 0.51); for nectarivore guild, human habitation/agriculture (+ve, 0.67) and edge density (+ve, 0.81); for omnivore guild, human habitation/agriculture (+ve, 1) were the significant drivers of richness (Table 3). Univariate models for piscivore and frugivore guilds indicated an association with the area of waterbodies; however, it was positive with the former and negative with the latter (Table 4). The GLM included landscape diversity, teak plantation, and Sal-mixed forest (β coefficients =+ve) as significant variables governing bird species richness (Table 4).
Table 3. Parameter estimates resulting from model averaging for various response groups. Significant variables are highlighted in bold
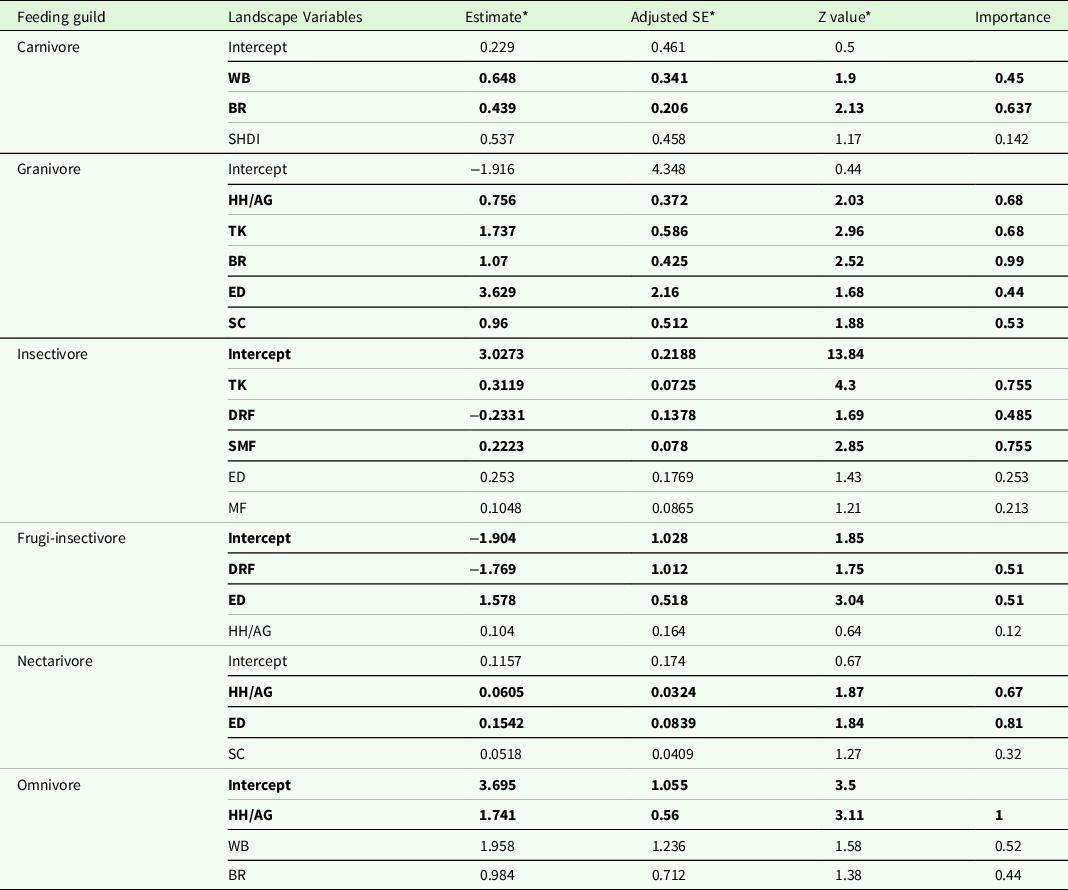
ED = edge density, SHDI = Shannon diversity, HH/AG = Human habitation with agriculture, BR = Barren land, DRF = Dry Riverine forest, MF = mixed forest, PL = plantations, MRF = moist riverine forest, SF = Sal forest, SMF = Sal-mixed forest, SC = Scrubland, TP = teak plantation, WB = water body.
* Unconditional average values of the models.
Table 4. Factors governing richness of overall birds, piscivore and frugivore in Uttarakhand, India

SHDI = Shannon diversity, WB = Waterbody, TP = Teak plantation, SMF = Sal-mixed forest. P value represents the significance level (*P<0.05, **P<0.01, ***P<0.001).
Discussion
We assessed the influence of landscape compositional heterogeneity on the richness of overall bird species and feeding guilds during this study. Our results suggest that landscape heterogeneity influences overall bird species richness, as has been demonstrated in several previous studies (Berg 1997; Bonilla et al. Reference Bonilla, León-Cortés and Rangel-Salazar2012; Fahrig et al. Reference Fahrig, Baudry, Brotons, Burel, Crist, Fuller, Sirami, Siriwardena and Martin2011; Haslem and Benette 2008; Hovick et al. Reference Hovick, Elmore, Fuhlendorf, Engle and Hamilton2015; Katayama et al. Reference Katayama, Amano, Naoe, Yamakita, Komatsu, Takagawa, Sato, Ueta and Miyashita2014; Ke et al. Reference Ke, Sibiya, Reynolds, McCleery, Monadjem and Fletcher2018; Lee and Martin Reference Lee and Martin2017; Thiollay Reference Thiollay1990). However, the structure and dynamics of bird communities are influenced not only by the landscape heterogeneity but like other biological communities, which are usually influenced by the combined effect of several ecological factors, each operating at different spatial and temporal scales (Bohning-Gaese Reference Bohning-Gaese1997). Some previous studies have emphasised that ecological parameters are scale-dependent (Graf et al. Reference Graf, Bollmann, Suter and Bugmann2005; Boscolo & Metzger Reference Boscolo and Metzger2009; Valerio et al. Reference Valerio, Basile, Balestrieri, Posillicoc, Di Donatoc, Altea and Matteuccif2016, Gestich et al. Reference Gestich, Arroyo-Rodríguez, Ribeiro, da Cunha and Setz2018), and therefore, it is important to identify the correct scale of effect to draw reliable inferences. Most feeding guilds, nectarivore, omnivore, frugi-insectivore, insectivore, granivore, and carnivore, responded positively to landscape compositional heterogeneity but at varied scales (Table 2) and with different sets of ecological variables (Table 3). The scale of effect may vary among species and taxa (Price et al. Reference Price, Marks, Howe, Hanowski and Niemi2004; Herrmann et al. Reference Herrmann, Babbitt, Baber and Congalton2005; Boscolo & Metzger Reference Boscolo and Metzger2009; Cunningham and Johnson Reference Cunningham and Johnson2006; Steckel et al. Reference Steckel, Westphal, Peters, Bellach, Rothenwoehrer, Erasmi, Scherber, Tscharntke and Steffan-Dewenter2014; Lindemann et al. Reference Lindemann, Harris and Keller2015), and there are several hypotheses explaining this variation (Miguet et al. Reference Miguet, Jackson, Jackson, Martin and Fahrig2016). Some suggested body size as a determinant of scale (Hostetler & Holling Reference Hostetler and Holling2000; Holland et al. Reference Holland, Fahrig, Cappuccino and Lindström2005; Thornton & Fletcher Reference Thornton and Fletcher2014), while others argue in favour of mobility (Carr & Fahrig Reference Carr and Fahrig2001; Horner-Devine et al. Reference Horner-Devine, Daily, Ehrlich and Boggs2003). The carnivore guild’s positive response to landscape compositional heterogeneity is consistent with Anderson (Reference Anderson2001) at the largest scale (1.5km). Both body size and mobility seem to be the determinant of scale as most carnivore species are large in size, feed on mobile species, and therefore are compelled to search for their food over a larger area, hence responding at a bigger scale. However, this explanation remains to be ascertained by further investigation of the relationship between body size, mobility, and scale of effect. Barren land and waterbodies have been found influencing carnivore guild’s richness. Species of this guild usually prey upon lizards, orthopterans, lepidopteran larvae, frogs, and snakes (Robinson Reference Robinson1994). Waterbodies (perennial rivers and streams) and their adjacent barren land (dry river beds) provide ample food resources and better prey detection in an open environment.
The scale of effect for the granivore guild was larger than the rest of the feeding guilds, except for the carnivore. Bonilla et al. (Reference Bonilla, León-Cortés and Rangel-Salazar2012) found granivore guild responding positively to landscape heterogeneity, while Ding et al. (Reference Ding, Liang, Hu, Zhou, Sun, Liu, Liu, Hu and Si2019) showed a negative relationship. However, the latter concluded that granivores are more abundant in open habitats, confirming results of an earlier study (Diaz & Telleria Reference Diaz and Telleria1996), showing strong associations with open and unpredictable habitats, where plant reproduction rate is high, and seed crops are significant. In our study, edge density, human habitation/agriculture, barren land, teak plantation, and scrubland significantly explain the richness of granivores. Since granivores have to exploit seed resources in varied environments, a large scale of effect is expected.
A positive response of insectivores to landscape compositional heterogeneity at a larger scale of effect than the frugi-insectivore, nectarivore, and omnivore guilds seems to be related to their degree of specialisation in exploiting food resources. The richness of the insectivore guild was positively associated with teak plantation and Sal-mixed forest, while the rest three guilds were positively associated with the disturbed environment, frugi-insectivores with edge density, nectarivores with human habitation and edge density, and omnivores only with human habitation. The influence of teak plantations on insectivores’ richness is in line with the results of Barve (Reference Barve2009), who has also recorded a higher richness of insectivore birds in teak plantations. Insectivores prefer a close canopy with high tree density and large basal area (Chettri et al. Reference Chettri, Deb, Sharma and Jackson2005). Sal-mixed forests in the study area comprise tall and large girth trees of Shorea robusta and its associates, like Lagerstroemia parviflora, Terminalia alata, Anogeissus latifolia, and understory species; Mallotus philippensis, providing optimal conditions for insect populations to grow due to dense foliage and high moisture. A negative association of insectivores with the dry riverine forest is likely due to the absence of understory vegetation and the dry environment resulting in low insect abundance (Sekercioglu et al. Reference Sekercioglu, Ehrlich, Daily, Aygen, Goehring and Sandı´2002; Moller 2019). Further, in the tropics, the availability of insects may vary considerably in time and space, reducing the feeding resources available to strictly insectivorous birds depending on the season and landscape structure (Davis Reference Davis1945; Roberts et al. Reference Roberts, Cooper and Petit2000; Develey & Peres Reference Develey and Peres2000). This would force them to periodically increase their range of activity in search of available food.
The frugi-insectivore guild is represented by six species of bulbuls: the understory edge specialists and have been found responding positively to light intensity, ground cover, temperature, and percentage of shrub cover (Arriaga-Weiss et al. Reference Arriaga-Weiss, Calme and Kampichler2008; Moradi et al. Reference Moradi, Zakaria and Robinson2013). The edges in our study area support secondary vegetation such as Glycosmis pentaphylla, Clerodendrum viscosum, Murraya koenigii, Lantana camara, and Pogostemon benghalensis with variable intensity of human disturbances and confirming to other environmental conditions as reported by Moradi et al. (Reference Moradi, Zakaria and Robinson2013). Therefore, frugi-insectivores have a positive relationship with edge density and a negative association with dry riverine forests due to the absence of secondary vegetation, as reported in earlier studies (Moradi et al. Reference Moradi, Zakari and Rosli2009; Ries & Sisk Reference Ries and Sisk2010). A positive association of nectarivore with human habitation and edge density is similar to the findings of Bideberi (Reference Bideberi2013), who has reported to have observed nectarivores only in human habitation and Chettri et al. (Reference Chettri, Deb, Sharma and Jackson2005) in disturbed habitats. Similarly, omnivores were also associated with the disturbed environment having a positive association with human habitation and agriculture. Omnivores can switch between abundant and scarce food resources, thus reducing the need to wander far in search of food in times of scarcity of a few or a particular resource, resulting in smaller home ranges. Species of three guilds: frugi-insectivore, nectarivore, and omnivore are associated with disturbed environments, and therefore expected to be more tolerant to a wide range of microclimatic conditions and hence respond to landscape heterogeneity at a smaller scale. We did not find an influence of landscape heterogeneity on the richness of frugivore and piscivore guilds. Terborgh (Reference Terborgh1977) commented that frugivores were influenced by complex and unresolved factors, such as the availability of fruit crops and plant productivity instead of elevation diversity. Both frugivores and piscivores are specialised in their feeding, and therefore, harvest resources in a particular environment, independent of habitat heterogeneity. This has support from the observed positive association of piscivores with waterbodies in our study area where many small fish such as Garra gotyla, Chagunius chagunio, Barilius barila, Barilius bandalisis, Barilius vagra, and Pethia conchonius comprise piscivores’ food.
The overall bird species richness seems to be responding at a mean scale of effect (0.75 km), which is represented by different guilds, ranging between 0.5 and 1.5 km. Our GLMs indicate that overall bird species richness is influenced by landscape composition and configuration, confirming findings of previous studies (McGarigal and McComb Reference McGarigal and McComb1995; Mazerolle and Villiard Reference Mazerolle and Villiard1999; Villard et al. Reference Villard, Trzcinski and Merriam1999; Westphal et al. Reference Westphal, Field, Tyre, Paton and Possingham2003; Xie et al. Reference Xie, Lu, Cao, Zhou and Ouyang2016). A positive association of overall bird species richness with teak plantation and Sal-mixed forest seems to be due to a large percentage of insectivores and granivores (67%) in the study area, where their guild richness positively responds to teak plantations and Sal-mixed forests, respectively. Daniels et al. (Reference Daniels, Hegde and Gadgil1990) have also reported higher bird species diversity in teak plantations as compared to the secondary moist deciduous vegetation and evergreen/semi-evergreen tracts.
Conclusion and Implication
Our study provides evidence that the landscape compositional heterogeneity influences the richness of most feeding guilds except frugivore and nectarivore. We have further shown that the scale of effect varies among feeding guilds. Therefore, we suggest that studies predicting the biological response of landscape variables may be carried out at multiple scales to identify an appropriate scale of effect. Since the landscape relationship to the avifaunal community is an emerging field of study in the Indian sub-continent, therefore, the results of the present study can serve as a reference for further research in this direction. Our results on species richness factors do not allow us to suggest specific management recommendations as the drivers of species richness differ amongst various feeding guilds. However, most feeding guilds responded to landscape heterogeneity, and therefore, maintenance of landscape diversity is essential for the sustenance of rich avifaunal communities in the study region. Any fragmentation or loss of natural vegetation and existing teak plantation may negatively affect the richness of insectivores and granivores, representing about 67% of all species recorded in the study area. Maintenance of existing vegetation parcels is not only important from the point of view of avian richness but also significant for the management of other species of conservation importance as Sal-mixed, and mixed forests are suitable habitats for Himalayan goral (Kushwaha et al. Reference Kushwaha, Munkhtuya and Roy2001; Kushwaha & Roy Reference Kushwaha and Roy2002), sambar (Prajapati et al. Reference Prajapati, Triptathi and Mishra2014), tiger (Prajapati et al. Reference Prajapati, Triptathi and Mishra2014), and leopard (Mondal et al. Reference Mondal, Sankar and Qureshi2012). An understory Sal associate, Mallotus philippensis is also a preferred food of elephants (Khan Reference Khan2004).
Supplementary material
To view supplementary material for this article, please visit https://doi.org/10.1017/S0266467422000049
Acknowledgments
The Corbett Foundation supported the current study. The authors are indebted to Dr Harendra Singh Bargali for facilitating the field works during the study period. We also thank Neha Verma, the then Divisional Forest Officer, Ramnagar Forest Division, to support us during the study. Special thanks to Mohd. Yaseen, Kubair Mehra, and Manoj Sati for their valuable help during field surveys and Himanshu Sati for his help in data entry and formatting. The authors declare no conflict of interest. We especially thank the anonymous reviewers for their valuable suggestions in improving this manuscript.


