INTRODUCTION
The White Sea is a mostly enclosed subarctic sea connected to the Barents Sea and surrounded by Kola Peninsula in the north, Karelia in the west, and the Kanin Peninsula to the north-east. Most of the White Sea is situated to the south from the Arctic Circle with the only exception in the north-western corner, the apex of the Kandalaksha Bay. In summer the sea surface warms up to 20°C in small bays (Babkov & Golikov, Reference Babkov and Golikov1984), but during the winter temperature of the upper water layer falls below zero causing the permanent ice cover from November to mid April (Kuznetsov, Reference Kuznetsov1960).
Kola Peninsula has warmed quickly over recent decades, with a surface area temperature rise of 2.3°C over the past 50 years. While there was no significant change in the annual mean precipitation, spring has become more wet and autumn more dry since the 1960s (Marshall et al., Reference Marshall, Vignols and Rees2016). This change caused the reduced duration of the winter sea ice cover in the White Sea (Parkinson, Reference Parkinson2014). Similar temperature rise is typical for the whole Arctic, where the temperature is increasing at a rate of two to three times that of the global trend. Globally, both positive and negative responses of the marine species to the climate change in the Arctic have been found so far, such as increased annual primary production, changes in zooplankton abundance and species composition, decline in population size of marine mammals and northward range shifts in some fish species (Wassmann et al., Reference Wassmann, Duarte, Agusti and Sejr2011). Range shifts and changes in abundance of one species, especially predators, often causes the rearrangement of the whole ecosystem structure. Recent northward expansions of Northern shrimp, Bluefin tuna and Atlantic mackerel took place on the background of both climate change and overfishing of cod near West Greenland (Hamilton et al., Reference Hamilton, Brown and Rasmussen2003; Mackenzie et al., Reference MacKenzie, Payne, Boje, Høyer and Siegstad2014).
Intertidal species respond to climate change in terms of distribution range shifts, variation in abundance and growth of individuals. Along the North-east Atlantic, typical boreal intertidal communities are currently limited at north by 10°C summer isotherm, geographically equal to the White and Barents Seas. Direct observations and statistical modelling show that distribution ranges of common species of the typical Atlantic intertidal communities are shifting northwards (Berge et al., Reference Berge, Johnsen, Nilsen, Gulliksen and Slagstad2005; Helmuth et al., Reference Helmuth, Mieszkowska, Moore and Hawkins2006; Jueterbock et al., Reference Jueterbock, Tyberghein, Verbruggen, Coyer, Olsen and Hoarau2013). Population dynamics of boreal intertidal invertebrates are strongly related to seawater temperatures (Strasser et al., Reference Strasser, Dekker, Essink, Günther, Jaklin, Kröncke, Madsen, Michaelis and Vedel2003; Wethey et al., Reference Wethey, Woodin, Hilbish, Jones, Lima and Brannock2011). Among the abundant species on the intertidal of European seas, Macoma balthica (Linnaeus, 1758) is often regarded as the most sensitive to elevated ambient temperatures (Beukema et al., Reference Beukema, Dekker and Jansen2009). Elevated winter temperatures have been shown to have both direct and indirect impacts on recruitment in intertidal bivalves. Beukema & Dekker (Reference Beukema and Dekker2014) found high recruitment in shrimps Crangon crangon and shore crabs Carcinus maenas after mild winters and concluded that top-down predation is the main regulatory factor for the survival of bivalve juveniles in the Wadden Sea.
In the White Sea M. balthica is a common food source for many birds (Pertsov, Reference Pertsov1963) and fishes (Azarov, Reference Azarov1963). The role of M. balthica in the diet of invertebrate predators is less studied in the region. Since 2001 we have been recording the population densities of the Iceland moonsnail Amauropsis islandica and M. balthica at sites where these species occur simultaneously. Density of A. islandica in the White Sea intertidal communities can be high, reaching 50 ind m−2, but moonsnails are distributed across the tidal flats unevenly, forming relatively permanent summer aggregations with rather distinct upward borders (Aristov, Reference Aristov, Nemova, Murzina and Mescheryakova2013). At the studied locations A. islandica feeds on several species of intertidal molluscs, but mainly on Macoma (Aristov et al., Reference Aristov, Varfolomeeva and Puzachenko2015). It is easy to spot the effects of predation by naticid snails, because they leave boreholes on the victim's shell (see Kabat, Reference Kabat1990 for review). During our survey we found that in 2014 the dominant part of registered mortality in Macoma population was due to predation by Amauropsis (Aristov et al., Reference Aristov, Varfolomeeva and Puzachenko2015). Along with the well-known high consumption rate in other naticid species (Clements & Rawlings, Reference Clements and Rawlings2014) we can expect that abundance of A. islandica snails has an impact on long-term Macoma population dynamics.
The dynamics of the White Sea intertidal communities have been studied for almost 30 years (Sergievsky et al., Reference Sergievsky, Granovitch and Sokolova1997; Sukhotin & Berger, Reference Sukhotin and Berger2013). These studies proposed several causes to describe the changes in species abundances: species interactions (Khalaman, Reference Khalaman2013; Naumov et al., Reference Naumov, Savchenko, Aristov, Biyagov and Naumov2014), rare weather events (Naumov, Reference Naumov2013) and cyclic character in population recruitment (Khaitov, Reference Khaitov2013), although the relationship between abundance and climate oscillations were not discussed.
Another approach to study the impact of climate change on species performance is based on the research of temporal variation in growth rates of individuals. For example, growth rates in Arctic subtidal bivalves Clinocardium ciliatum and Serripes groenlandicus near Greenland and Svalbard significantly increase during warm years and in sites affected by warm Atlantic currents (Ambrose et al., Reference Ambrose, Carroll, Greenacre, Thorrold and McMahon2006; Sejr et al., Reference Sejr, Blicher and Rysgaard2009; Carroll et al., Reference Carroll, Ambrose, Levin, Henkes, Hop and Renaud2011). Geographic variation in growth rates of M. balthica is well studied (Beukema & Meehan, Reference Beukema and Meehan1985) which makes it an ideal subject to study how long-term variation in growth rates is related to climate oscillations.
Macoma balthica is a widely distributed bivalve in Europe. This species however is now regarded as a complex of two (sub) species with overlapping distribution, different origin and probably, different tolerance range (Nikula et al., Reference Nikula, Strelkov and Väinölä2007; Strelkov et al., Reference Strelkov, Nikula and Väinölä2007; Luttikhuizen et al., Reference Luttikhuizen, Drent, Peijnenburg, Van Der Veer and Johannesson2012; Becquet et al., Reference Becquet, Lasota, Pante, Sokolowski, Wolowicz and Garcia2013). While the dynamics of Macoma is very well studied in the central part of the distribution range, it is necessary to carry out comparative studies from other regions.
In the present paper we explore whether the population dynamics of Macoma balthica in the apex of Kandalaksha Bay during the last 20 years were affected by climate oscillations, and examine the contribution of predator–prey interactions between M. balthica and the moonsnails Amauropsis islandica to the Macoma abundance variation. Finally, we compare the growth rates of M. balthica during different periods of the study to explore the footprint of climate change on individual performance of this species in the Subarctic.
MATERIALS AND METHODS
Study area
Kandalaksha Bay forms the north-west portion of the White Sea. It is the warmest part of the sea with the annual mean surface water temperature of 4°C at the apex, seasonal mean amplitude of about 20°C (Filatov et al., Reference Filatov, Tolstikov, Zdorovennov, Filatov and Terzhevik2007) and average tidal amplitude of about 2 m. The most typical species of intertidal fauna at the White Sea sandflats are baltic clams Macoma balthica [recently Limecola balthica has become accepted as the valid scientific name (Sartori, Reference Sartori2016), but here we use Macoma balthica as the commonly used synonym], lugworms Arenicola marina, sludge-worms Tubificoides benedii and mudsnails Peringia ulvae (Naumov, Reference Naumov2013).
Samples
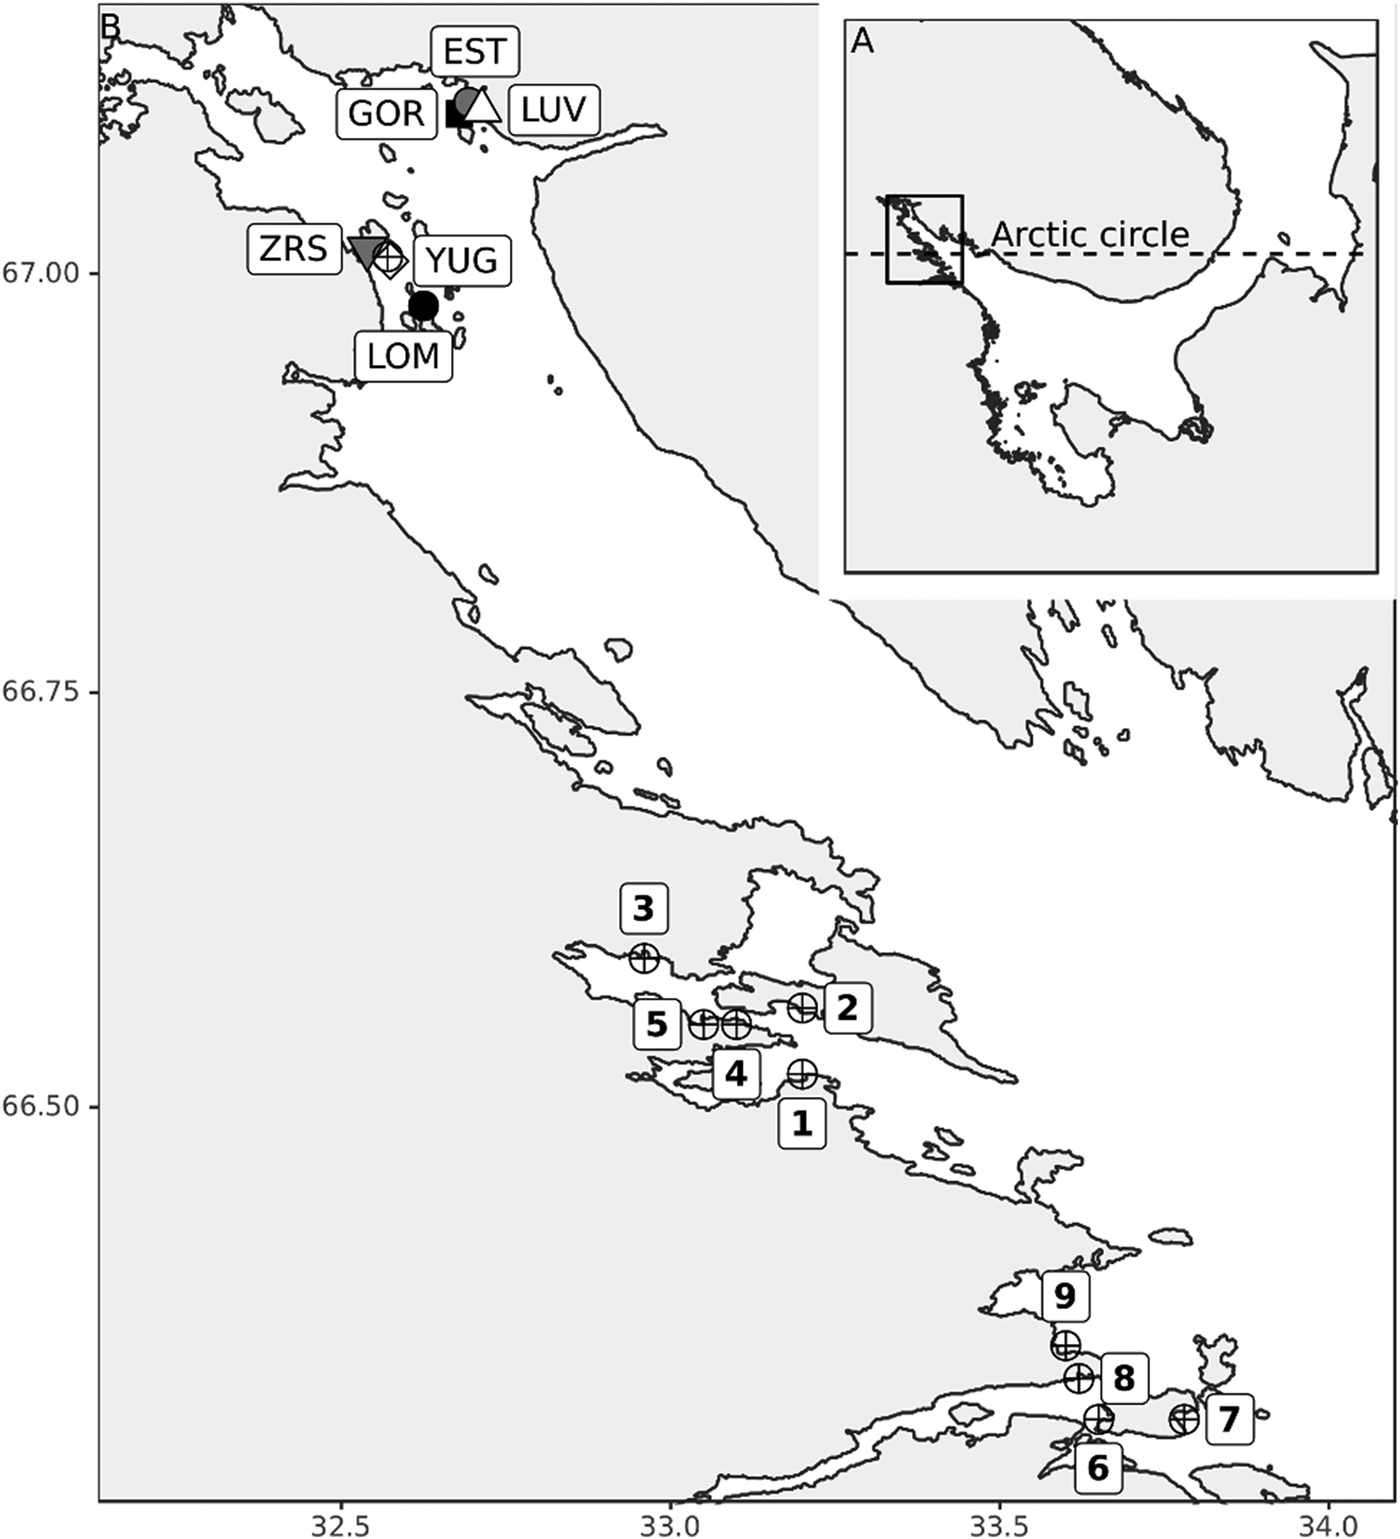
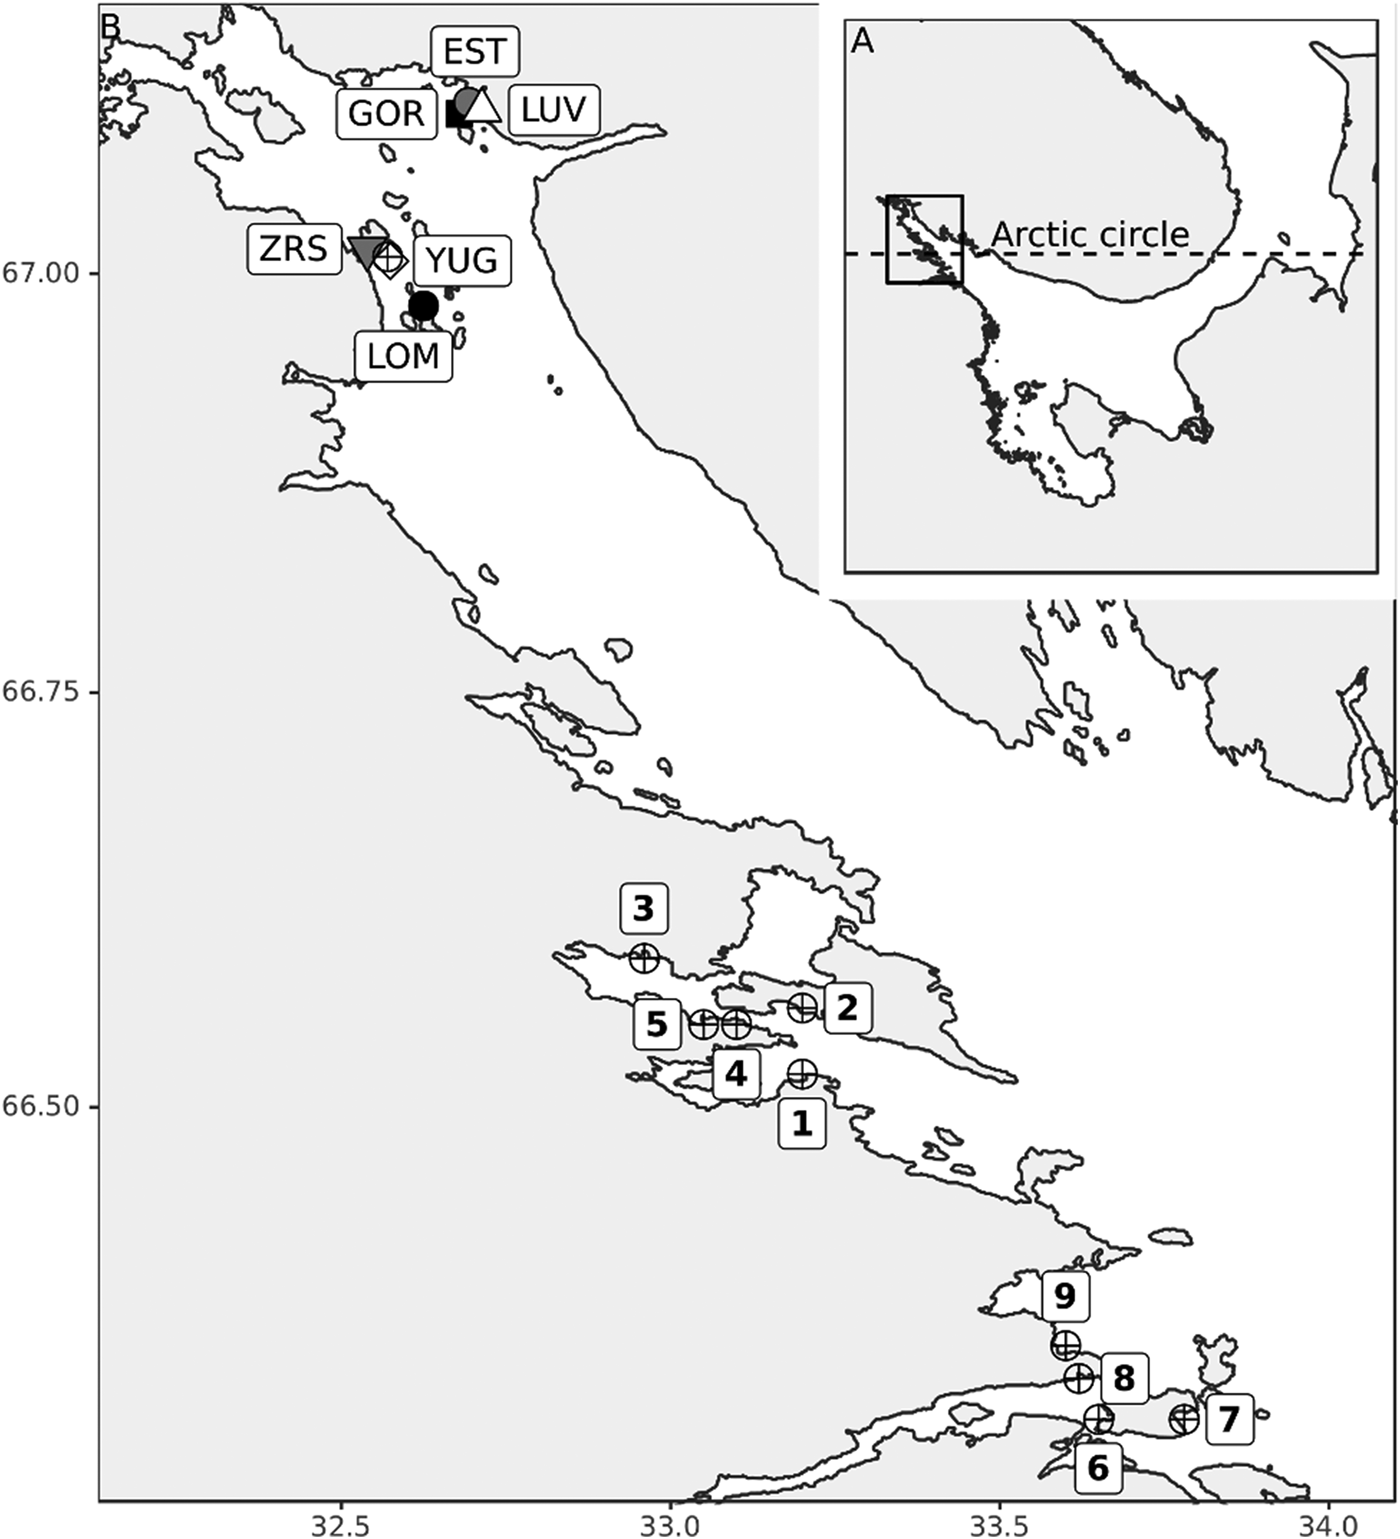
The length of the time series varied from 6 to 21 years for different sites. The samples of M. balthica were collected from six tidal flats in the apex of Kandalaksha Bay between 1992 and 2012 (Figure 1). At each site 5–20 core samples with an area of 0.03 m−2 were collected annually in late July (see Table 1 for details). To address the effect of the predator on M. balthica at two sites (YUG, LOM) we counted the number of Iceland moonsnail Amauropsis islandica from the 0.25 m2 around each of the Macoma core samples.
Table 1. Sampling details.

Samples were sieved through a 0.5 or 1 mm mesh and sorted alive in the laboratory. All M. balthica individuals were taken from samples, counted and their greatest shell length was measured with a stereomicroscope to the nearest 0.1 mm. To ensure comparability between cores which were sieved through different mesh, we only used molluscs larger than 1 mm. Thus, we also cut off the spat and analysed the abundance of individuals older than 1 year (Zubakha et al., Reference Zubakha, Poloskin and Goltsev2000; Nazarova, unpublished data).
To study the shell shape and growth-related variation, two samples of Macoma, collected at Luvenga estuary, were used: (1) a sample from 1997 represented the cool period (N = 55 ind.), and (2) a 2015 sample represented the warm period (N = 57 ind.). Standard measurements of each clam from these samples were done using a stereomicroscope and Vernier callipers (small and large specimens correspondingly) to the nearest 0.1 mm, particularly length L (the greatest distance between the posterior and anterior ends), height H (the greatest distance perpendicular to the anterior-posterior axis passing through the umbo), width W (the greatest distance perpendicular L and H passing across two valves) of the shells and the width of the external growth rings. Age of clams was determined as number of the growth rings (Maximovich et al., Reference Maximovich, Gerasimova and Kunina1992).
Statistical analysis
All calculations were done using the R statistical software (R Core Team, 2016). We used non-parametric Mann–Whitney test for paired and Kruskal–Wallis test for multiple comparisons. To compare similarity of population dynamics trends for each site initial data were transformed into matrices of Euclidean distances between pairs of time points (years) (see Khaitov & Lentsman, Reference Khaitov and Lentsman2015 for details). These matrices were compared by Mantel test from the vegan package (Legendre & Legendre, Reference Legendre and Legendre2012; Oksanen et al., Reference Oksanen, Blanchet, Friendly, Kindt, Legendre, McGlinn, Minchin, O'Hara, Simpson, Solymos, Stevens, Szoecs and Wagner2016). Spearman's rank correlation coefficient was used as a statistic in the procedure with the permutation test for significance assessment (999 permutations were run).
To test whether the temperature oscillations have an effect on population dynamics of Macoma balthica, the three longest time-series, namely data from LUV, GOR and ZRS were used. Natural logarithm of M. balthica density was used as the modelling value. Records of monthly averaged surface air temperature for the period before 2000 were extracted from the annual reports of the Kandalaksha State Nature Reserve (‘The Chronicle of Nature of the Kandalaksha Reserve’, 1992–2000). Monthly temperatures for the period between 2001 and 2012 were taken from web-based archives of Raspisaniye Pogodi Ltd (http://www.rp5.ru) for Kandalaksha weather station (WMO station index 22217). These data were commonly applied for all sites, therefore year cannot be isolated as predictor in modelling.
Population dynamics of M. balthica are mainly regulated by recruitment success in each year, which is a result of three processes: (1) gonad development, (2) spawning and settlement success and (3) spat survival in the first winter (Maximovich, Reference Maximovich, Khlebovich and Skarlato1985; Honkoop et al., Reference Honkoop, Van der Meer, Beukema and Kwast1998; Philippart et al., Reference Philippart, van Aken, Beukema, Bos, Cadée and Dekker2003; Beukema et al., Reference Beukema, Dekker and Jansen2009). Critical periods for processes are previous winter for the gonads forming, previous summer for spawning and recruitment and current winter for spat survival (Maximovich, Reference Maximovich, Khlebovich and Skarlato1985). We used temperatures in February and July as a proxy of winter and summer conditions. Since samples were collected in late July, three predictors were used in the model: February temperature of the sampling (FEB t ) and of the previous (FEB t−1) year, and July temperature (JUL t−1) of the previous year. No correlation was revealed between these three predictors.
Autocorrelation function showed significant values at lag 1 for M. balthica abundance at all sites. No autocorrelation was found in temperature time-series (Supplementary Table S1). Therefore temperature effeсts (through thin-spline interpolation) on M. balthica abundance was estimated using generalized additive mixed models (GAMM) as implemented in the mgcv package for R (Wood, Reference Wood2006). These GAMM use the data to determine the underlying linear or non-linear trend and covariate functional form without having to assume any specific functional form (Wood, Reference Wood2006).
We fitted the following GAMM model:
with ε ~ AR1(ρ), where log (N t ) is the natural logarithm of M. balthica density in year t; β 0 is the intercept; β 1 is the slope coefficient for Site; FEB t−1, JUL t−1 and FEB t are mean monthly air temperatures in year t − 1 and t correspondingly; f 1, f 2, f 3 are the smoothers for each monthly temperature, ε is the residuals. Autoregressive model of residuals (order 1) was included (AR1(ρ)), where residual at time t + 1 is the function of residual at time t (see Pinheiro & Bates, Reference Pinheiro and Bates2006 for details). All model predictors seemed to have significant influence on the dependent variable, so the selection of model was not needed. To check the importance of autoregressive structure we fitted the GAM model with the same predictors and smoothers. Final models were checked with Akaike information criteria (AIC).
To test the predator effect of Amauropsis islandica we used data from YUG and LOM sites. We fitted the linear model with similar predictors as in GAMM (see above) and added season mean abundance of Amauropsis (N a). The following full model was fitted:
Backward selection was then carried out to fit the optimal model. Akaike information criteria (AIC) was used for better model choice. Both final models were checked for patterns in the residuals and QQ-plots visually (Zuur et al., Reference Zuur, Ieno, Walker, Saveliev and Smith2009). ANOVA was used to estimate the effects of predictors and smoothers. Null hypotheses were rejected at 5% confidence level.
The used shell shape measure can be described as globosity (W/L). The evidence of positive allometry of shell shape was tested by Spearman correlation test and corrected by taking the natural logarithm of both shell measures and performing a principal component analysis (PCA) on the two measures (Luttikhuizen et al., Reference Luttikhuizen, Drent, Van Delden and Piersma2003). The first principal component was interpreted as size, and the second as size-corrected shape (high value corresponds to flattened shell).
Growth differences between generations in each period were estimated by mean annual shell increments. Shell increments were calculated as the difference between neighbour growth rings. Growth curves were approximated by the von Bertalanffy equation (von Bertalanffy, Reference von Bertalanffy1938). The values obtained for K and L max were multiplied to obtain the parameter ω (ω = K × L max), which is more suitable than either K or L max to investigate growth rate variations (Appeldoorn, Reference Appeldoorn1983).
RESULTS
Macoma balthica population dynamics
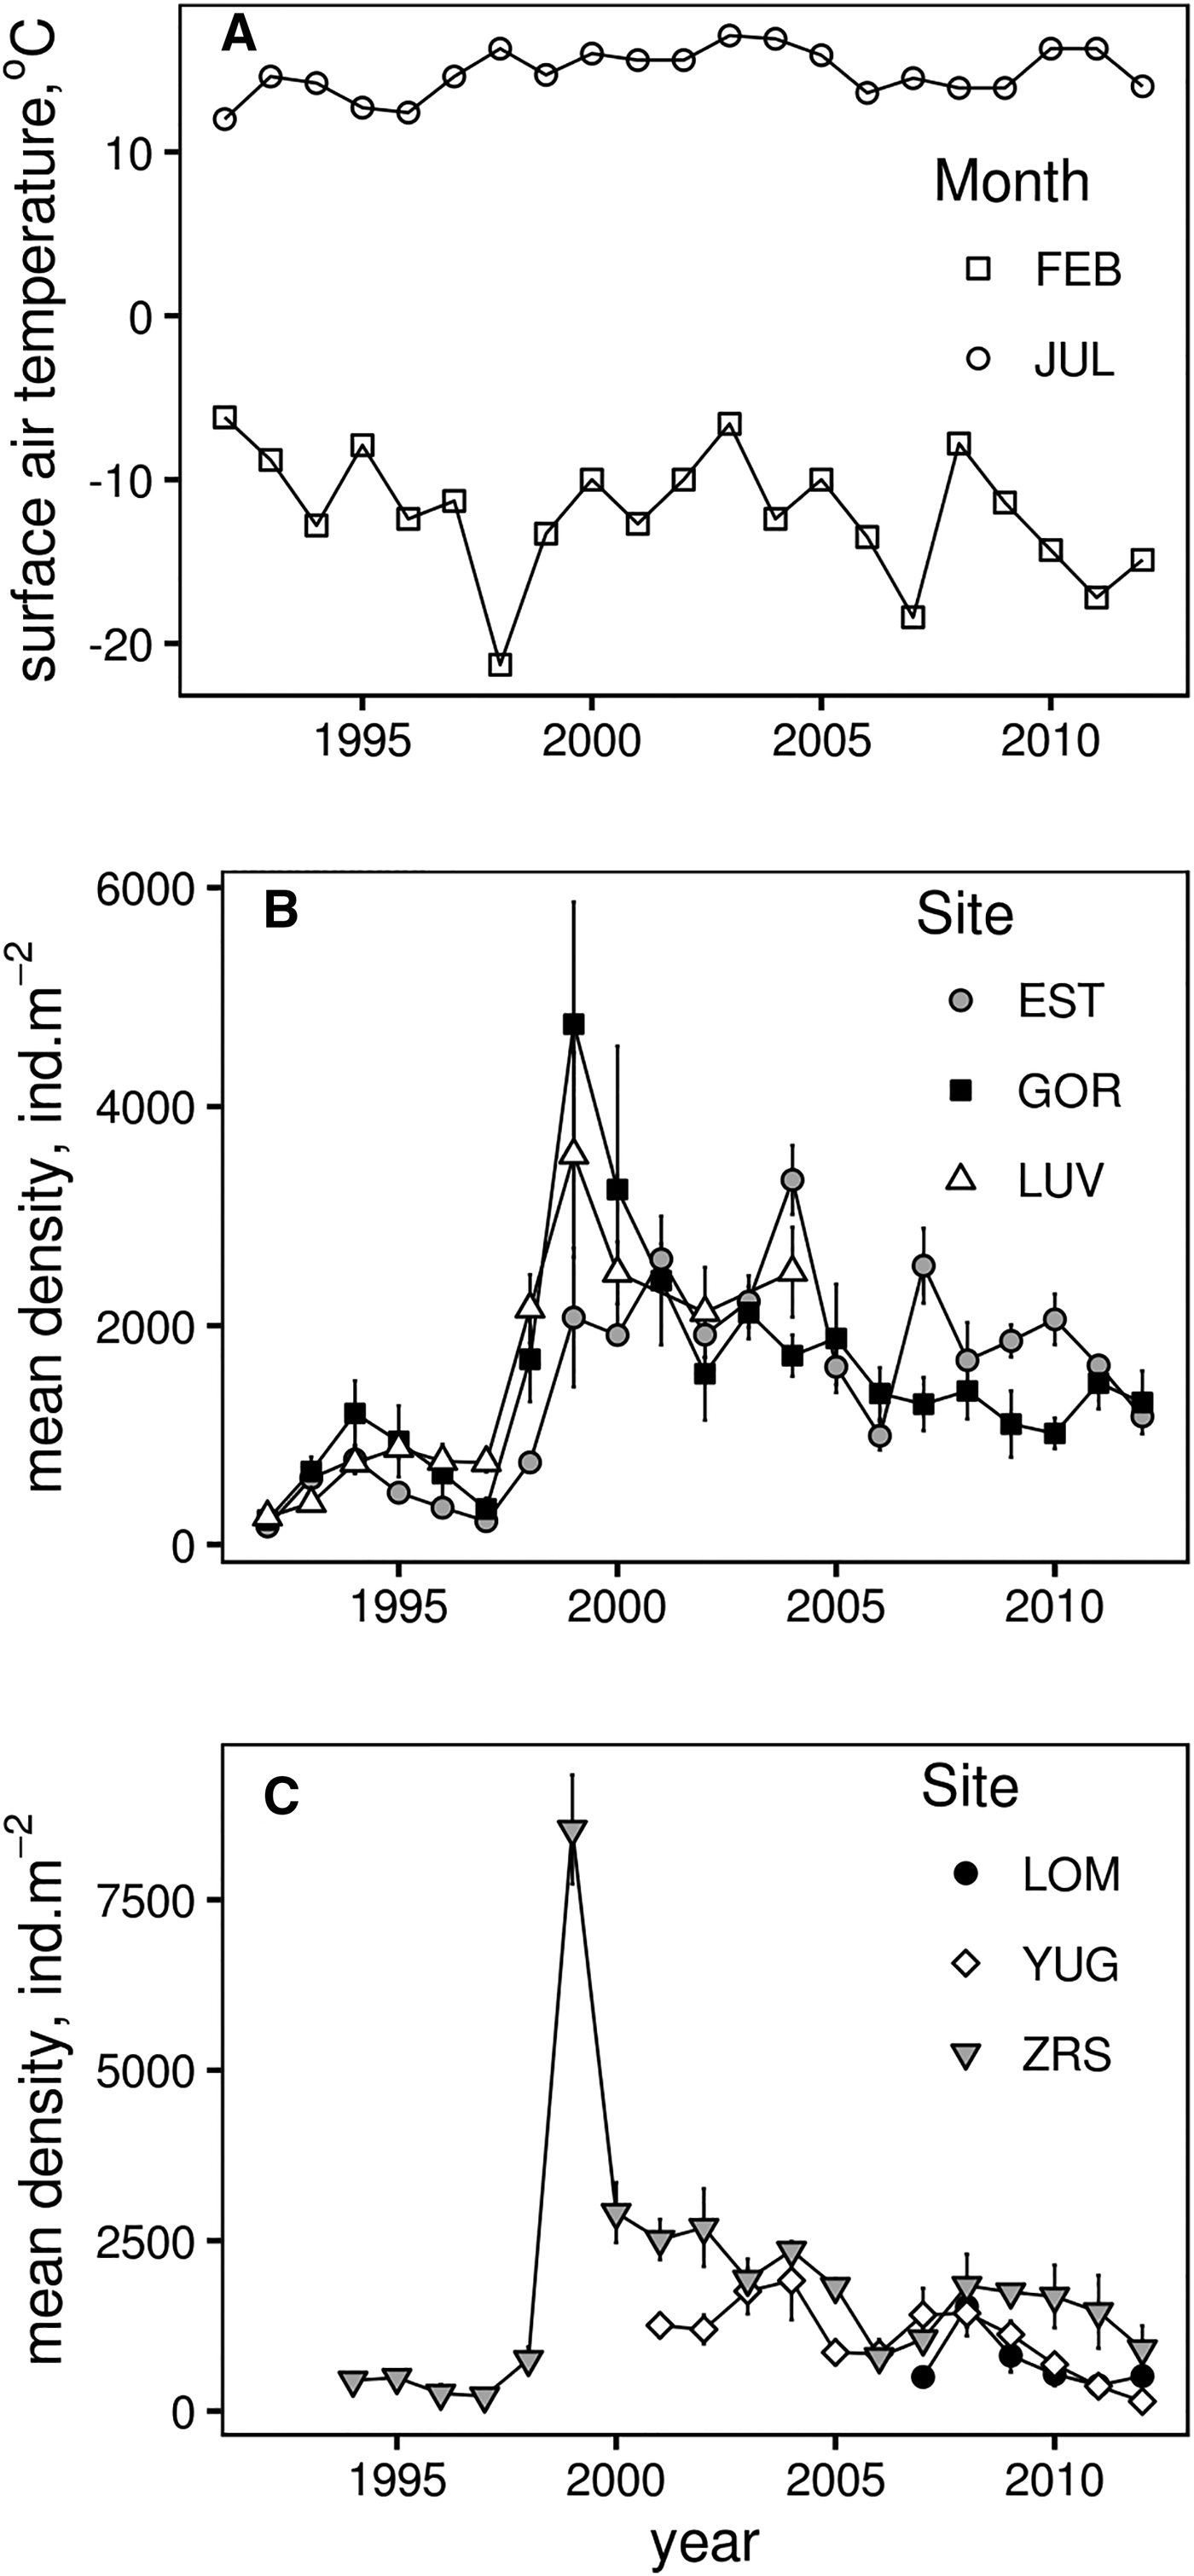
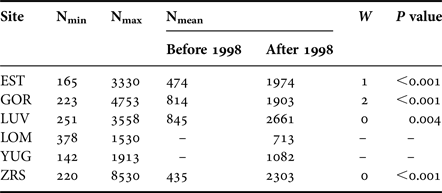
During the 21-year period of regular observations, densities of M. balthica varied by 4–40-fold at different sites (Figure 2). Minimum abundance was observed at YUG in 2012 (142 ind. m−2), and maximum was at ZRS in 1999 (8530 ind. m−2) (Table 2). Maximum variation was observed at ZRS. At LOM (the shortest time-series) abundance did not significantly fluctuate (Kruskal–Wallis test: χ2 = 9.9, P = 0.077) and long-term mean density was 713 ind. m−2. At other sites mean density before 1998 was lower than after 1998 (Figure 2).
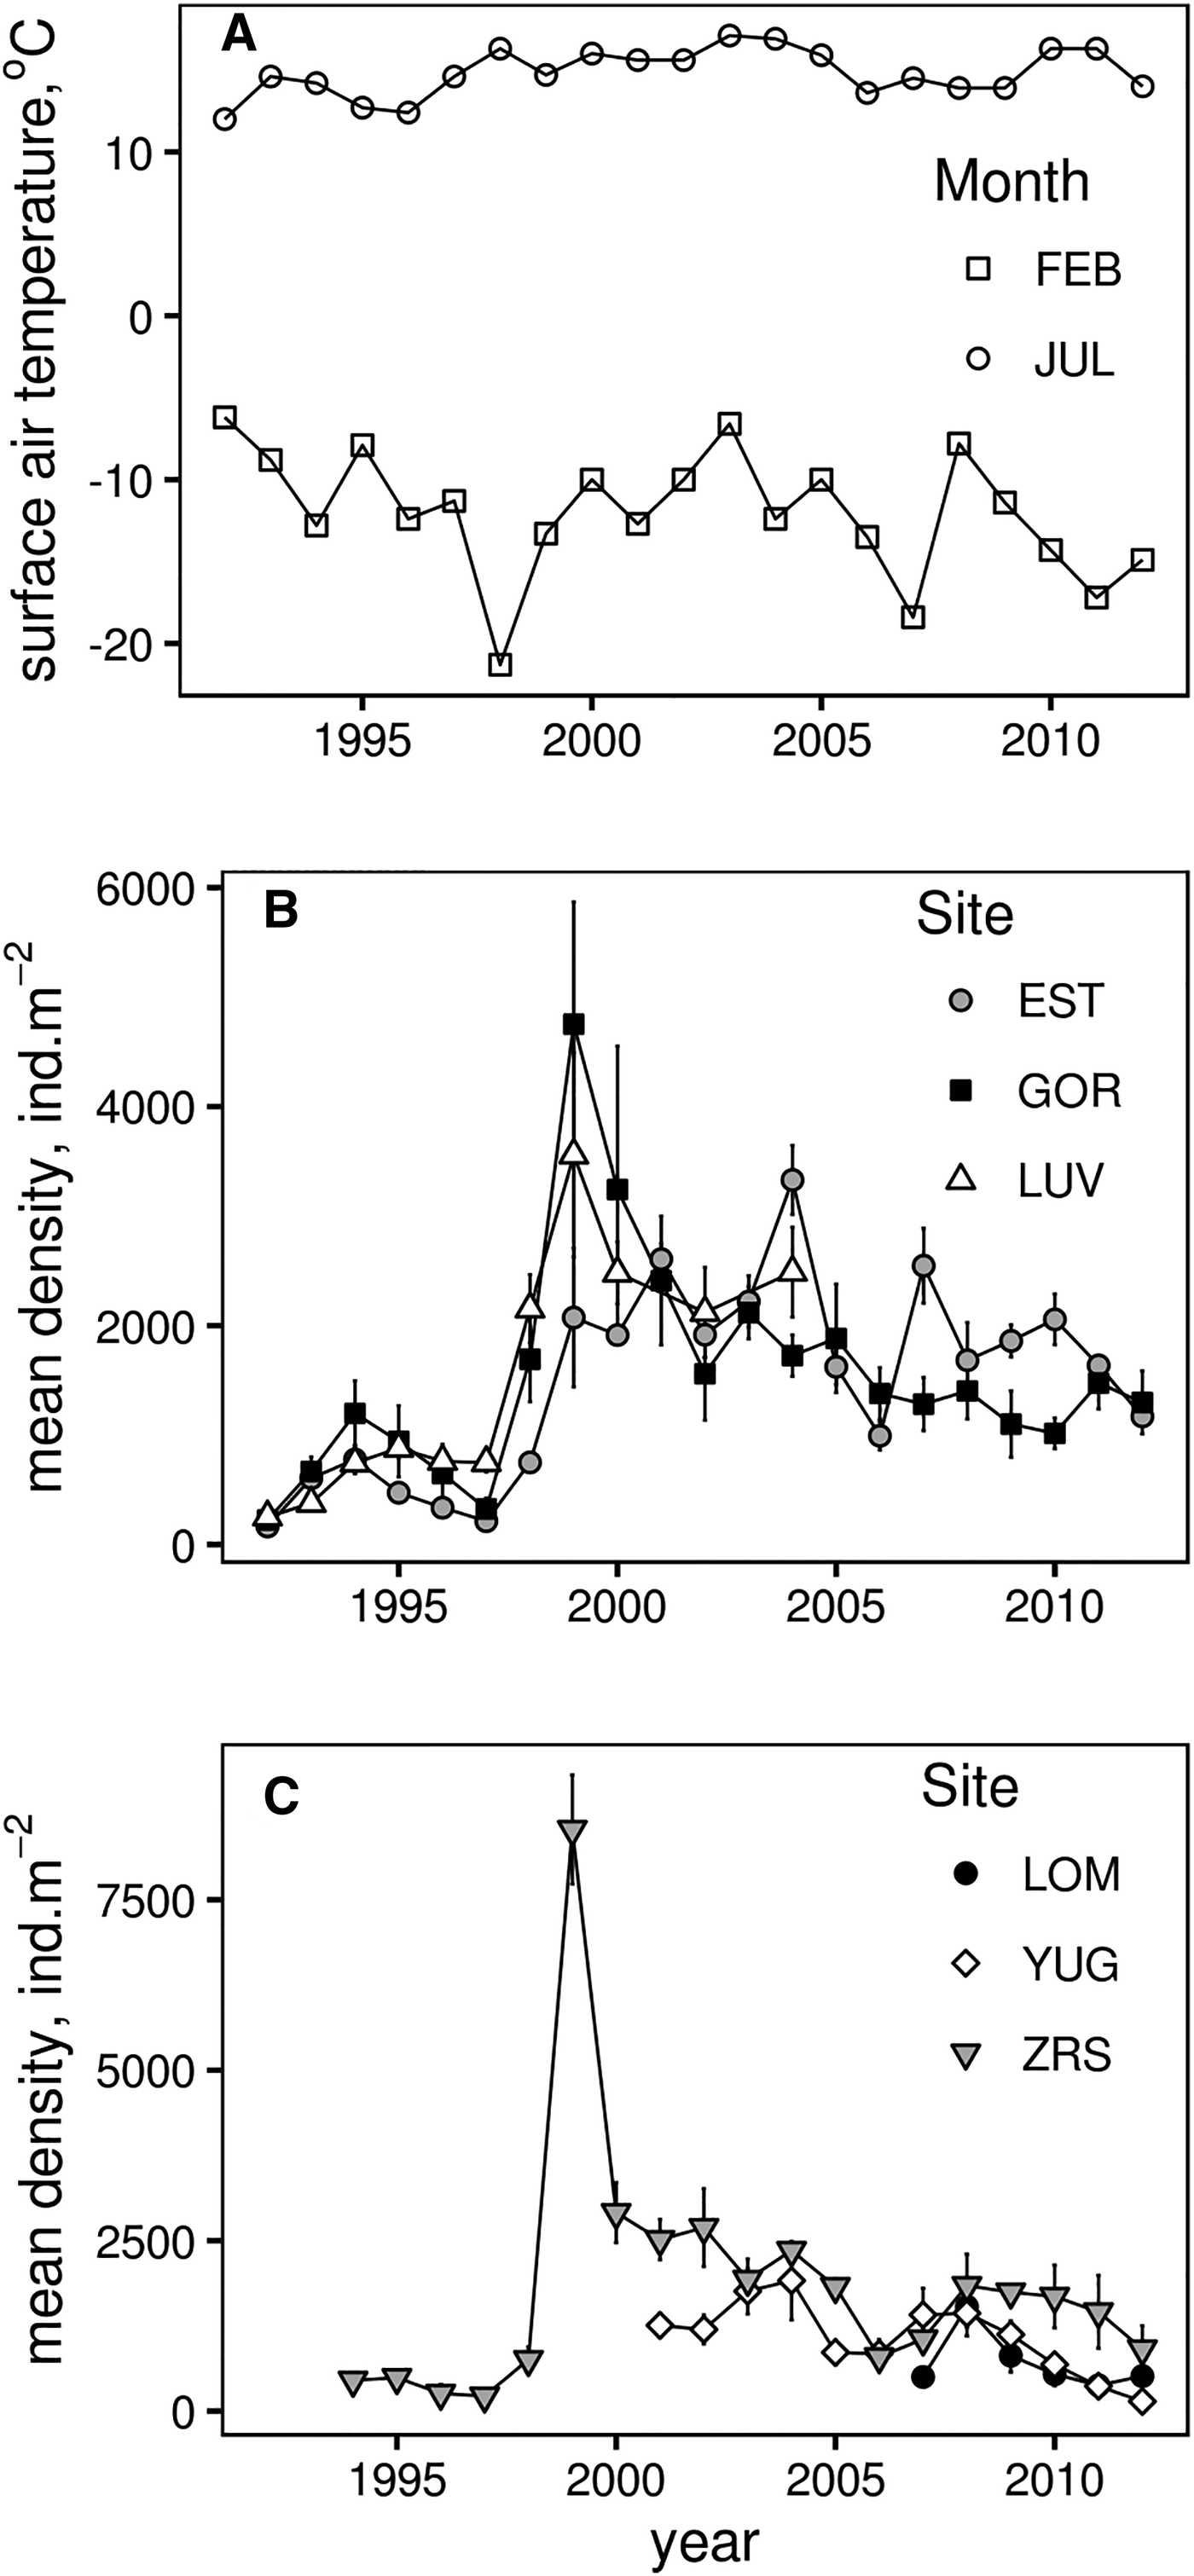
Fig. 2. Dynamics of monthly average air temperatures in Kandalaksha (A), Macoma balthica mean density (±SEM) at Luvenga skerries (B) and North archipelago (C).
Table 2. Macoma balthica abundance variation.
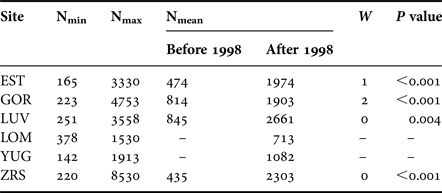
N, density, ind. m−2; W, Wilcoxon test between two periods.
There was an obvious synchrony between sites, that already can be traced from the common peaks of clam density in 1994, 1999, 2004–2005 and 2007–2008 (Figure 2). Mantel test showed that population dynamics at six of 15 pairs of locations demonstrated similar patterns (Supplementary Table S2). Only the recruitment of 1998 (common peak in 1999) caused the shift in the abundance for a long period. The effect from other large recruitment events lasted for only 1 or 2 years (Figure 2). Wilcoxon test supported the significant difference between mean clam abundance before and after the year of 1998 at all sites (Table 2). Therefore the long-term population dynamics of M. balthica in the apex of Kandalaksha Bay during our study can be divided into two periods: (1) low-density period, which lasted between 1992 and 1998, and (2) high-density period from 1999 to 2012.
Temperature and predator effects
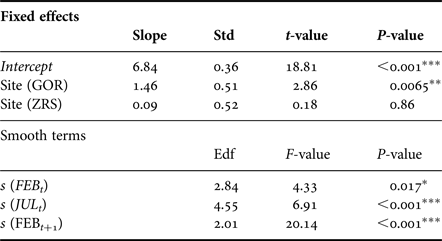
The general additive mixed model (GAMM) that accounted for non-linear effects of temperature and site, fitted abundance dynamics well with 65% deviance explained. The distribution of GAMM residuals showed no obvious patterns. Akaike information criteria (AIC) of GAMM was less than that for GAM (128 vs 139), meaning that GAMM is a better regression model. All fitted predictors have a significant effect on the log abundance of Macoma larger than 1 mm in length (Table 3).
Table 3. Summary of GAMM results.
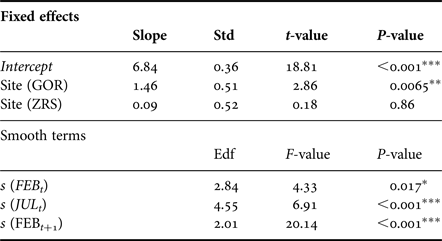
The approximate proportion of explained variance (Adj. R 2) is 0.65. Edf is estimated degrees of freedom and describes the curves of smoothers. Std is the standard error. *P < 0.05, **P < 0.01, ***P < 0.001.
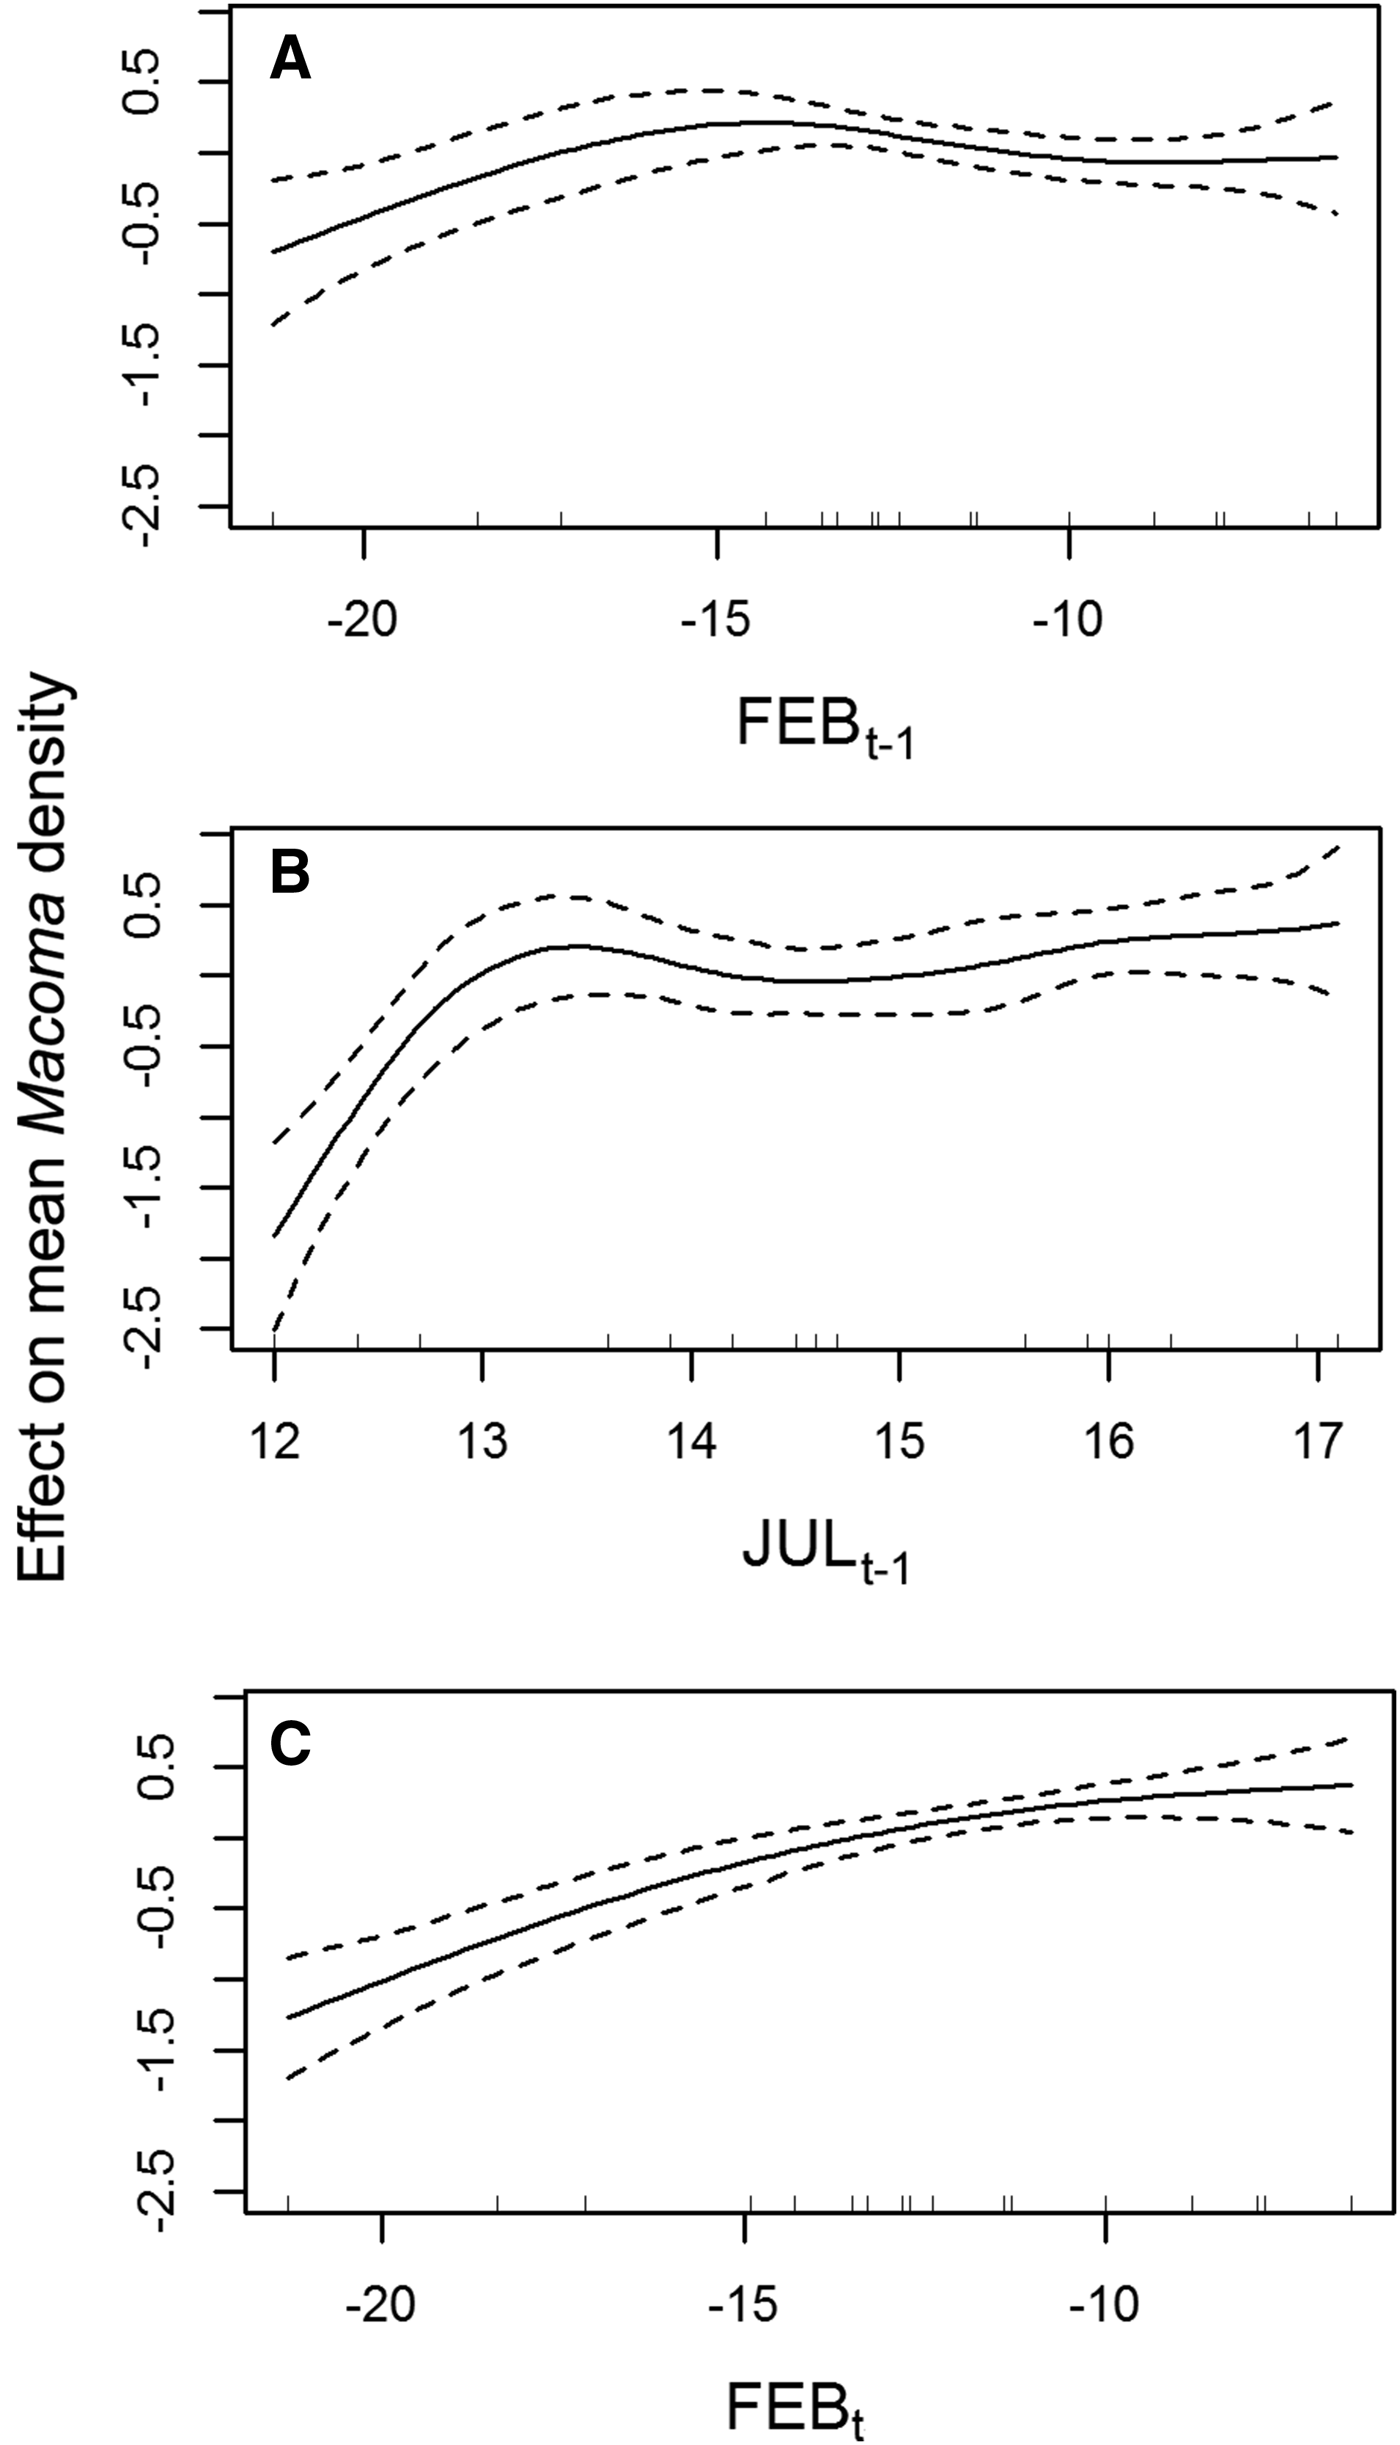
The cross-validation of spline-smoothers in GAMM showed a non-linear pattern for all smoothers (Figure 3). Density seems to increase monotonically with increasing FEB t+1 temperature, meanwhile the maximum modelled abundance of M. balthica corresponds to mean values of FEB t temperature (Figure 3A, B). Predicted M. balthica abundance decreased rapidly with decreasing JUL t temperature below +13°C (Figure 3C).

Fig. 3. The effects of average monthly temperature of (A) previous year February, (B) previous year July and (C) this year February on the mean Macoma balthica abundance. Solid curves are smoothing terms in final GAMM model (given that all other smoothers and parametric part of the model are constant), dashed lines denote 95% confidence bands.
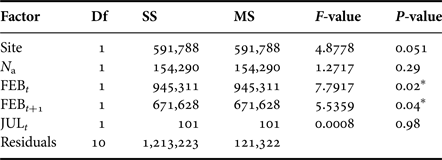
We analysed dynamics of M. balthica populations under predator pressure of A. islandica at YUG and LOM sites. Fitted linear model explained 54% of variance. Modelling shows that A. islandica had no effect on investigated M. balthica populations, and population dynamics of this species depends only on winter temperatures (Table 4) just as populations at LUV, GOR and ZRS. The reverse analysis shows that changes in density of M. balthica do not alter the dynamics of A. islandica either (ANOVA, F = 0.72, P = 0.42).
Table 4. ANOVA results for Macoma balthica dynamics at the sites with predators.
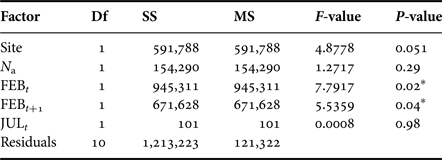
Df, degrees of freedom; SS, sum of squares; MS, mean squares.
Significance level: *P < 0.05.
Shell shape and growth rates
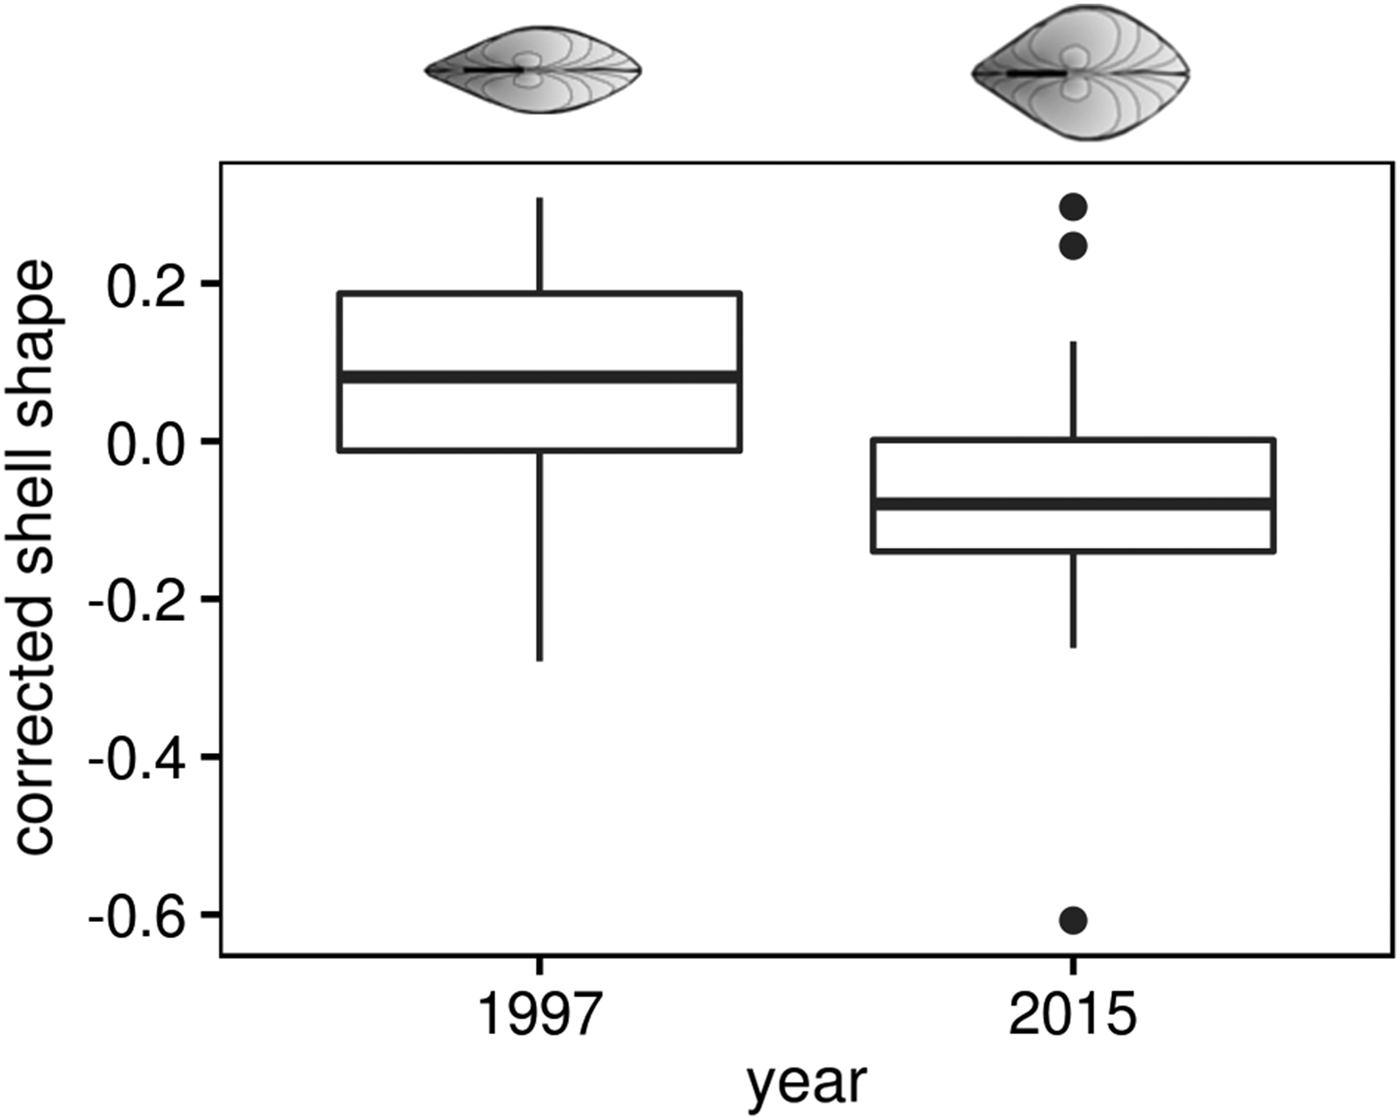
To characterize M. balthica individuals from cold and warm periods we use shell shape and linear growth as a complex response to different factors. The length of clams, randomly included in the analysis, varied from 5.6 to 15.5 mm in the 1997 sample, and from 3.4 to 14.6 mm in the 2015 sample. Shell shape displayed positive allometry (larger shells are more globose) only in the 1997 sample (Spearman rank test: r = 0.62, P < 0.0001 in 1997 and r = −0.13, P = 0.31 in 2015). Therefore we used shell shape data corrected for length as described in Materials and methods. Mann–Whitney test showed that M. balthica shells, collected in 2015, were more globose compared with those sampled 18 years earlier, in 1997 (U = 2384, P < 0.0001, Figure 4).
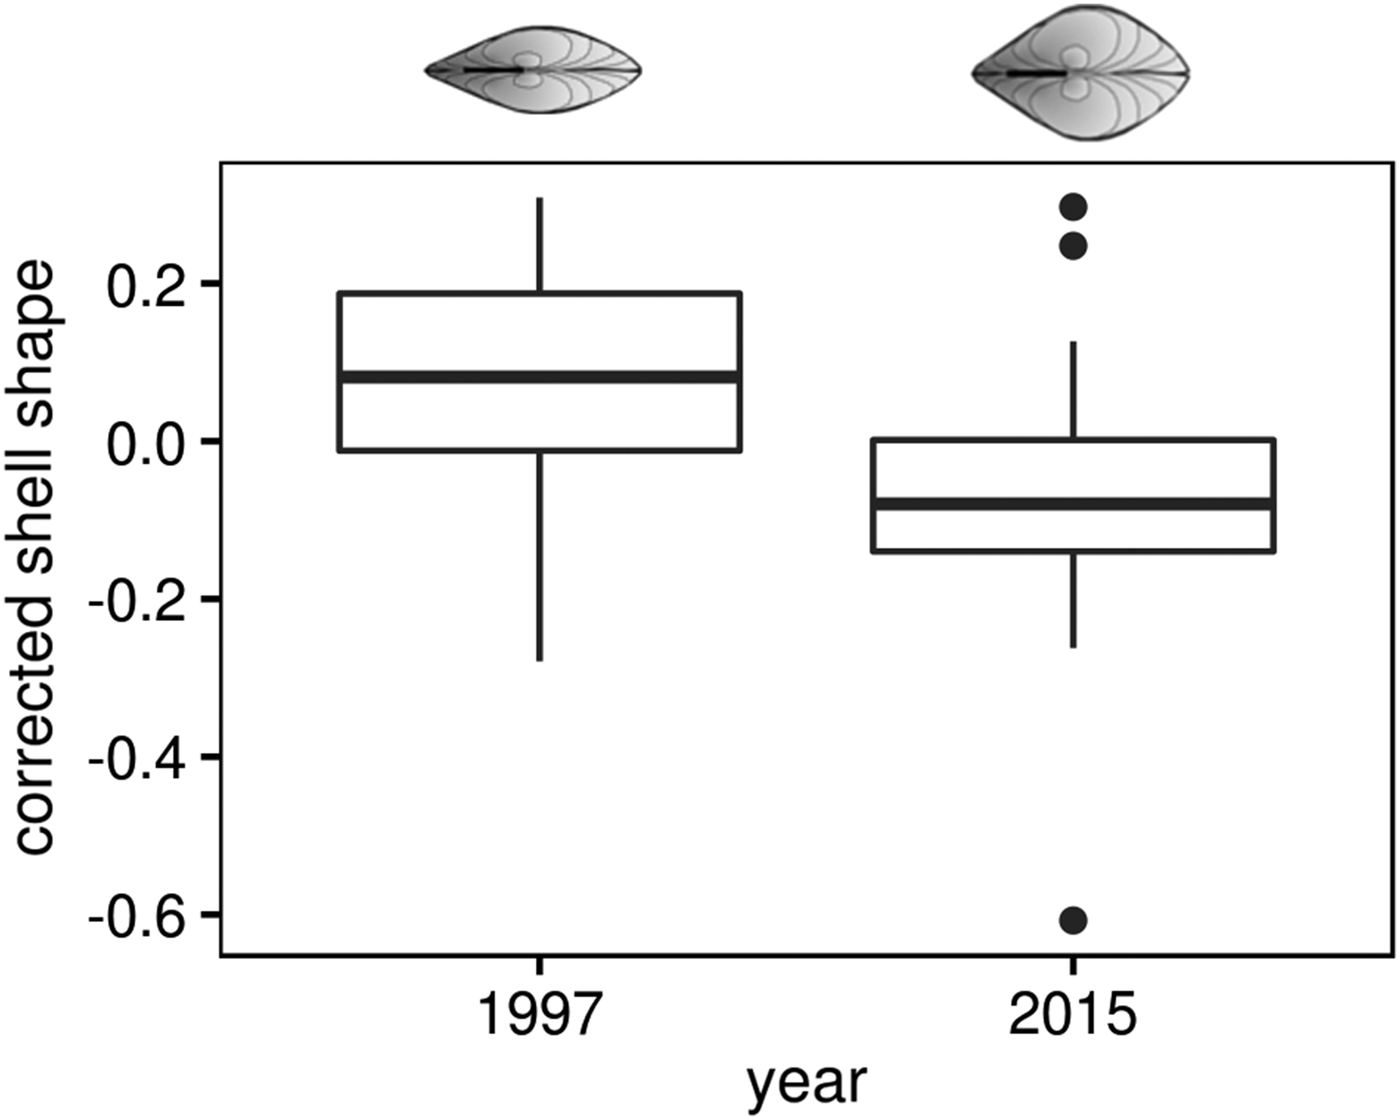
Fig. 4. Change of Macoma balthica shell shape at Luvenga Estuary (EST) from the 1990s to 2010s. Corrected shell shape means the factor loading of the second principal component of the PCA on log (shell length) and log (shell width).
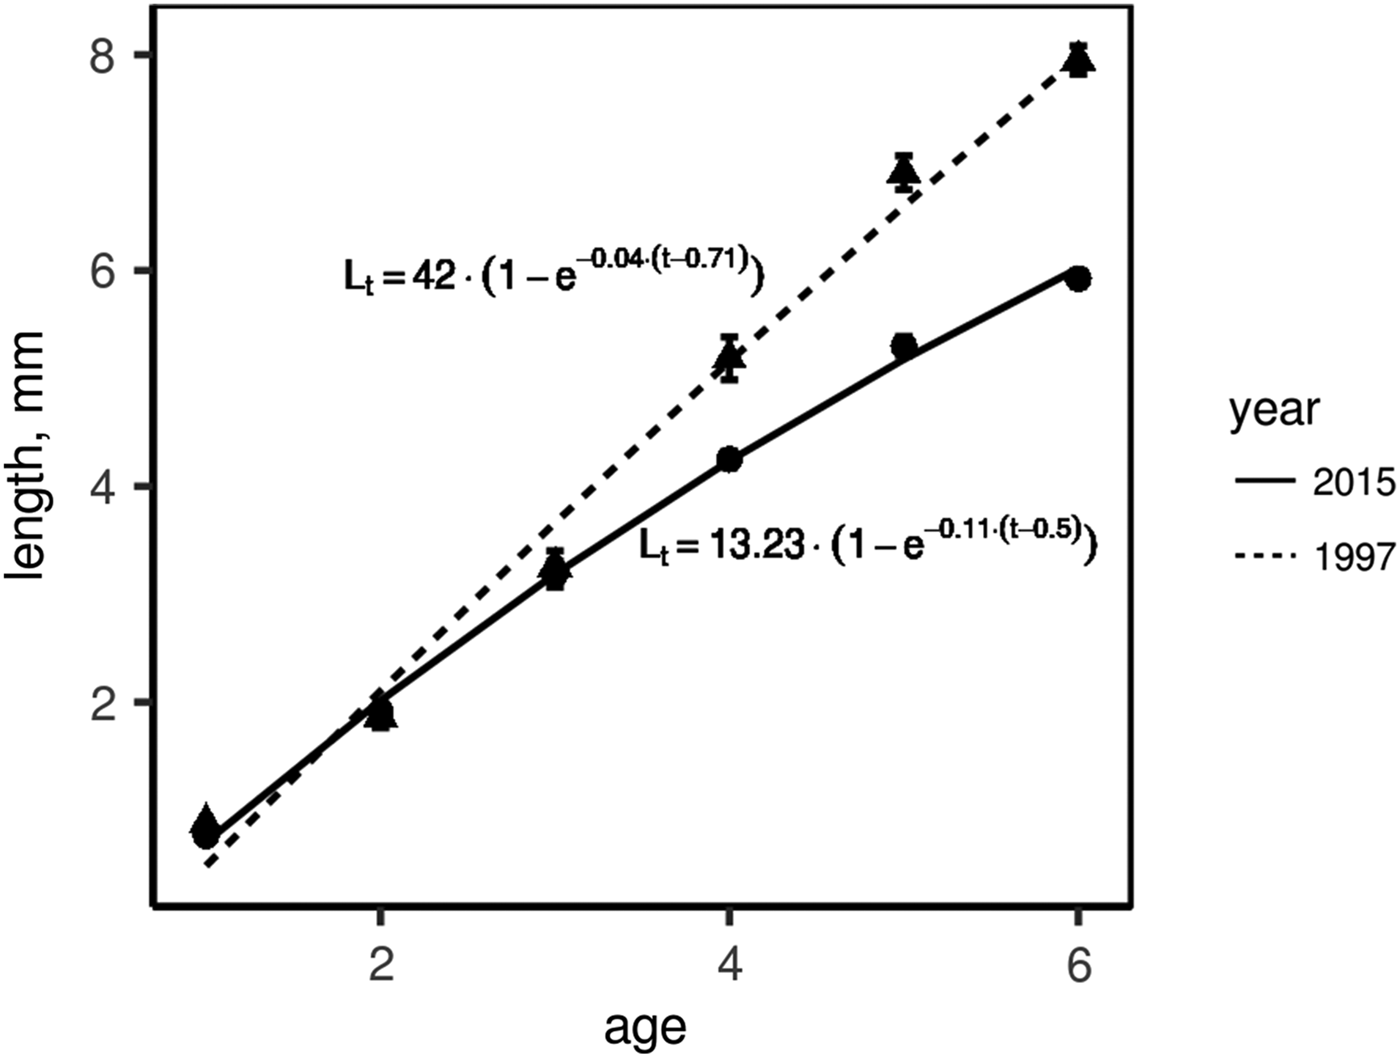
To compare growth rates, we used molluscs of ages 3+ to 6+ as most abundant generations in both 1997 and 2015. In both sampling years (i.e. 1997 and 2015), we calculated mean annual shell increment for each growth year in each mollusc generation (e.g. the first, the second and the third growth years for 3+, etc.). In molluscs of one sampling year, this increment appeared to be the same in the same growth year regardless of the generation of molluscs (Supplementary Table S3). Therefore we could combine molluscs of all generations of one sampling year to infer one growth curve. To plot these growth curves, we used a growth year instead of age and length of the corresponding growth ring instead of shell length. Figure 5 shows the comparison of growth curves of M. balthica collected in 1997 and 2015. The growth rate was similar in young clams (of no more than the third year of growth), but molluscs of the fourth and greater years of growth grew faster during the 1990s (ω is 1.67 in 1997 and 1.46 in 2015).
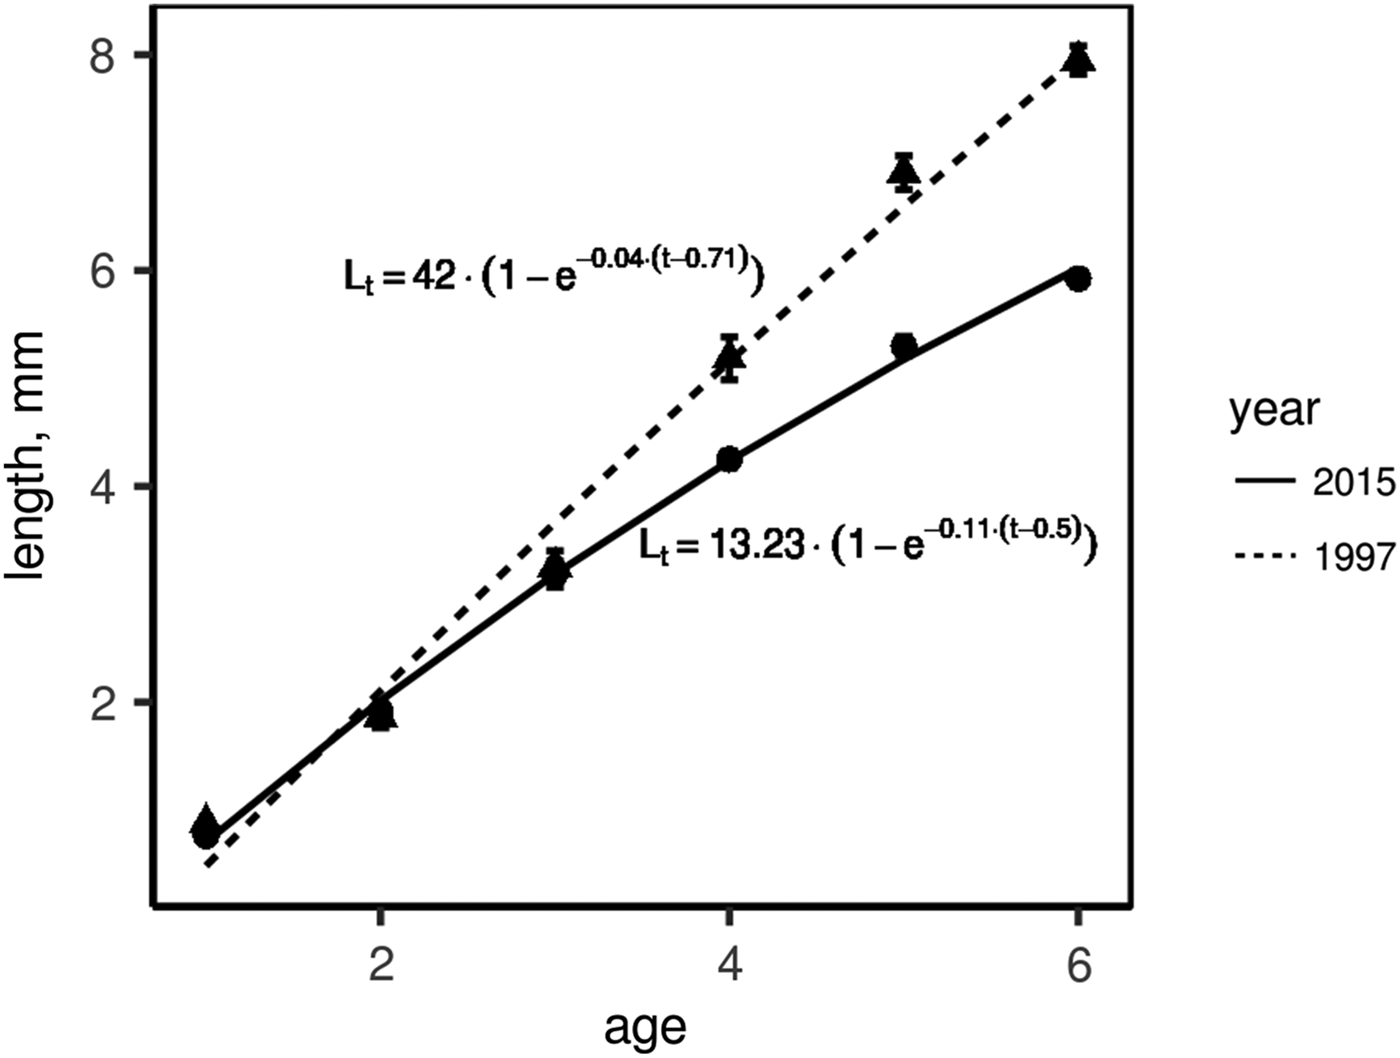
Fig. 5. Linear growth of Macoma balthica at Luvenga Estuary (EST) in the 1990s and 2010s. Dots indicate mean length ±SEM, lines are von Bertalanffy approximation of growth.
DISCUSSION
Macoma balthica population dynamics in the context of climate oscillations
Macoma balthica from the northernmost part of Kandalaksha Bay showed strong inter-annual variation in abundance between the years 1992 and 2012. The alternation between the periods of high and low abundance is typical for many White Sea invertebrates, sticklebacks and seagrasses (Khalaman & Naumov, Reference Khalaman and Naumov2009; Gerasimova & Maximovich, Reference Gerasimova and Maximovich2013; Khalaman, Reference Khalaman2013; Varfolomeeva & Naumov, Reference Varfolomeeva and Naumov2013; Ivanova et al., Reference Ivanova, Ivanov, Golovin, Polyakova and Lajus2016; Khaitov & Lentsman, Reference Khaitov and Lentsman2016). This alternation was found to be regular in mussel beds (Khaitov, Reference Khaitov2013) and fouling subtidal communities (Khalaman, Reference Khalaman2013), but irregular in soft-shell clams Mya arenaria (Gerasimova & Maximovich, Reference Gerasimova and Maximovich2013). Similar densities of M. balthica from the same part of the White Sea were observed in late 1940s (Sveshnikov, Reference Sveshnikov1963, Table 5). Unfortunately data on clams density for the period between the 1940s and 1979 are lacking, but in the 1980s M. balthica abundance was the lowest among all periods of monitoring studies of this species. After 1979 the density of M. balthica has been increasing gradually (Table 5).
Table 5. Macoma balthica abundance in Kandalaksha Bay in different periods.

Mean density and its range are shown. NA, no data.
Sources: (1) Sveshnikov (Reference Sveshnikov1963); (2) Semenova (Reference Semenova1974); (3) Maximovich et al. (Reference Maximovich, Gerasimova and Kunina1991); (4) Gerasimova & Maximovich (Reference Gerasimova and Maximovich2013); (5) Varfolomeeva & Naumov (Reference Varfolomeeva and Naumov2013).
The long-term maximum mean density of M. balthica (>1+ age) was observed in 1999, representing the unusually successful recruitment after the postlarvae settlement in the summer of 1998. This particular year was characterized by a relatively cool winter (but see Naumov, Reference Naumov2013 for a description of the abnormally early ice melting), warm summer and warm following winter (Figure 2). An unusual increase in density of acorn barnacles Semibalanus balanoides was observed in 1998 due to intense settlement of juveniles, but no correlation was observed between the recruit density and adult abundance during the next year (Marfenin et al., Reference Marfenin, Bolshakov and Mardashova2013). High recruitment after the settlement in 1998 was also observed in Mya arenaria, and while the authors suggested the existence of a common mechanism regulating the recruitment rate, no factors were proposed to support the successful recruitment (Gerasimova & Maximovich, Reference Gerasimova and Maximovich2013). A sudden increase in abundance of M. balthica in 1998 and 1999 was reported from the Keret Archipelago (~100 km away from our sampling sites, Varfolomeeva & Naumov, Reference Varfolomeeva and Naumov2013). The authors also mentioned that the density and biomass gradually increased after the peak in 1998 and that the changes were similar among investigated sites. According to our data, population dynamics of M. balthica in the apex of Kandalaksha Bay were also synchronized (Figure 2). These findings together suggest that M. balthica dynamics in the White Sea are synchronized over large areas as well as in other parts of Europe, particularly in the Wadden Sea (Beukema et al., Reference Beukema, Essink, Michaelis and Zwarts1993, Reference Beukema, Dekker, Essink and Michaelis2001; Honkoop et al., Reference Honkoop, Van der Meer, Beukema and Kwast1998), even though these regions are inhabited by two separate subspecies of M. balthica (see below).
Statistical modelling shows that a combination of mild winter and warm summer leads to an increase in M. balthica density in the next year, including the explosive 40-fold population growth that took place in the late 1990s. Results from the present study reveal the M. balthica population size increasing in response to milder than average winters in the north-west White Sea. Our findings seem to contradict all the current knowledge about the climate-driven population dynamics of intertidal bivalves (Macoma balthica, Cerastoderma edule, Mya arenaria and Mytilus edulis) from the NE Atlantic (Philippart et al., Reference Philippart, van Aken, Beukema, Bos, Cadée and Dekker2003; Beukema & Dekker, Reference Beukema and Dekker2005; Beukema et al., Reference Beukema, Dekker, van Stralen and de Vlas2015). While abundance of M. balthica was increasing in the late 1990s in the north-western White Sea (northern part of Baltic clam distribution range), it was seriously declining in the Wadden Sea from the mid-1980s onward (central part of range) (Beukema et al., Reference Beukema, Dekker and Jansen2009; Compton et al., Reference Compton, Bodnar, Koolhaas, Dekinga, Holthuijsen, ten Horn, McSweeney, van Gils and Piersma2016).
We propose several explanations for such opposing trends in population dynamics. To start with, Macoma balthica is no longer regarded as one single species in Europe, but a complex including M. balthica rubra inhabiting the North Sea and NE Atlantic, and M. balthica balthica found in the White, Barents and Baltic Seas (Nikula et al., Reference Nikula, Strelkov and Väinölä2007). Thus, comparing the life history traits of Macoma from the Wadden and White Seas should consider the high probability of a different tolerance range in the two subspecies in line with different phenology of these regions.
Our study shows a positive relationship between air temperature in February with the summer density of M. balthica in the same and next years. This implies an effect of winter temperature on gonadal development and reproductive output of adults as well as on survival of 0+ recruits during their first winter. Hydrological winter in the White Sea starts in December when the temperature of the upper layer of the water column falls below zero and spans until late March (Usov et al., Reference Usov, Kutcheva, Primakov and Martynova2013). Germ cells development of M. balthica in the White Sea starts in July and takes nearly 10 months up to the next June when spawning occurs at water temperatures between +10 and +15°C (Maximovich, Reference Maximovich, Khlebovich and Skarlato1985).
Winter mean water temperature in the Wadden Sea varied between 0 and +7°C during 1965–2010 (Beukema et al., Reference Beukema, Dekker and Jansen2009). Gonadal development in M. balthica from the Thames Estuary and Wadden Sea takes place between mid-summer till next February, and spawning occurs when water temperature reaches +10°C (Caddy, Reference Caddy1967, Reference Caddy2010; de Wilde, Reference de Wilde and Barnes1975). Reproductive output consists of two components: egg size, positively correlated with summer temperatures, and egg number related to food availability during prolonged period of gonadal development. Lack of food prior to spawning may be an important factor stimulating resorption (Honkoop & Van der Meer, Reference Honkoop and Van der Meer1997). Winter feeding activity in Macoma is generally much lower than in spring and summer. While clams can switch their feeding mode from deposit to suspension-feeding, it was shown that clams depend for their food intake to a great extent on algal food present in the water column (Hummel, Reference Hummel1985; Olafsson, Reference Olafsson1986). In the White Sea, the period from late February till mid-March is marked by a gradual increase in chlorophyll-a concentration following winter (Usov et al., Reference Usov, Kutcheva, Primakov and Martynova2013). Since the reproductive cycle in Macoma from the White Sea takes three more months than those from the Wadden Sea, early availability of food might prevent gonadal resorption during unfavourable seasons and, therefore, higher reproductive success after relatively warm winters.
Predator–prey interactions
The Iceland moonsnail Amauropsis islandica is a long-living circumarctic species, mainly found in the bathyal, infralittoral and circalittoral zones (Egorova, Reference Egorova2007). In Kandalaksha Bay of the White Sea moonsnails also occur in the intertidal zone (Aristov et al., Reference Aristov, Varfolomeeva and Puzachenko2015). The knowledge of distribution, abundance, life history and feeding behaviour of A. islandica from this region is still fragmentary. Amauropsis is dioecious, in May–June females lay the stiff egg-mass covered by sand and mucus and known as ‘sand collars’. This species does not have a pelagic larval stage for dispersal (Golikov, Reference Golikov, Starobogatov and Naumov1987). Two reasons were taken into account for estimating the naticid Amauropsis islandica effect on Macoma abundance. Firstly, long-term monitoring studies showed that population dynamics of M. balthica in the Wadden Sea can be significantly altered by the pressure from the intertidal invertebrate predators, e.g. brown shrimp Crangon crangon (Beukema et al., Reference Beukema, Dekker and Jansen2009 and references therein). Secondly, naticids are known to regulate the abundance of their prey (Wiltse, Reference Wiltse1980). Nevertheless, no significant effect of A. islandica on M. balthica abundance at sites where these two species simultaneously occur in the apex of Kandalaksha Bay were found. While this result is very unexpected, it is probably not a unique case of interactions between the invertebrate predators and bivalves. The purplemouth moonsnail Cryptonatica janthostoma from the Pacific does not significantly alter the density of bivalves that it feeds on, namely Anisocorbula venusta and Clinocardium californiense (Selin, Reference Selin2008). The author suggested that A. venusta is too small for the predator and C. californiense can actively escape from the attacking predator although direct long-term observations were not conducted. Similarly, the survey of interactions between the blue crab Callinectes sapidus and North American relative of the Baltic clam, Macoma petalum from Chesapeake bay, did not reveal a top-down predator effect (Seitz & Lipcius, Reference Seitz and Lipcius2001). In our case we assume that the Macoma population can easily recover from predator pressure with migrating clams from the unaffected part of the intertidal. Since Amauropsis has more restricted preferences than Macoma to the various abiotic factors at the intertidal such as low tide exposure, sediment type and salinity, there are many nearby Amauropsis-free settlements.
On the other hand, the abundance of Macoma clam seems to have no effect on the variation in density of Amauropsis at the surveyed tidal flats. Also, there is no clear evidence in the literature of such bottom-up influence of prey species on dynamics of naticids. Naticids demonstrate some species preferences (Vignali & Galleni, Reference Vignali and Galleni1986) and can shift from one prey to another (Clements & Rawlings, Reference Clements and Rawlings2014; Aristov et al., Reference Aristov, Varfolomeeva and Puzachenko2015), so the bottom-up effect can be less distinct. The lack of top-down predator control and, from the current perspective, of bottom-up regulation between M. balthica and A. islandica in Kandalaksha Bay intertidal deserves further research.
Linear growth and shell shape variation of M. balthica in the apex of Kandalaksha Bay
Morphometric and linear growth analysis of M. balthica from the White Sea revealed that clams grew faster and had flattened shells during the cool period, but were globose and slow-growing during the warm period. Our findings contradict the data of Luttikhuizen et al. (Reference Luttikhuizen, Drent, Van Delden and Piersma2003) emphasizing spatial variability in Macoma shell shape in contrast with its stability over several years. Earlier, Beukema & Meehan (Reference Beukema and Meehan1985) revealed latitudinal clines in M. balthica shell shape, particularly clams from northern populations are more globose, while being oblong in southern part of the species range in Europe. We explain such a discrepancy between the results of two studies as follows. Luttikhuizen et al. (Reference Luttikhuizen, Drent, Van Delden and Piersma2003) analysed clam shell shape during three consistent years, while our two samples are not only spaced in time by 18 years, but also represent two periods with different climate conditions.
Luttikhuizen et al. (Reference Luttikhuizen, Drent, Van Delden and Piersma2003) compared the shape of M. balthica on both sides of Frisian Islands and found clam shells to be more globose in the enclosed Wadden Sea, where chances to be washed out from the sediment are lower, and where selection pressure from a great number of wintering birds is higher – globose shells are less affected by predation risk from birds, being harder to swallow and containing more salt water, which may energetically be very costly for birds (Zwarts & Blomert, Reference Zwarts and Blomert1992; Visser et al., Reference Visser, Dekinga, Achterkamp and Piersma2000; Luttikhuizen et al., Reference Luttikhuizen, Drent, Van Delden and Piersma2003). Significant numbers of the waders wintering in the Wadden Sea migrate to the White Sea in summer, where they feed on Macoma as well (Pertsov, Reference Pertsov1963). Predation by birds is a very important factor in the dynamics of marine intertidal bivalves (e.g. Beukema et al., Reference Beukema, Essink, Michaelis and Zwarts1993; Nehls et al., Reference Nehls, Hertzler and Scheiffarth1997; Malham et al., Reference Malham, Hutchinson and Longshaw2012; and references therein), thus it could be expected that changes in bird populations, especially at wintering and nesting areas would have an impact on bivalve populations. Populations of birds feeding mainly on Macoma in the White Sea, e.g. turnstones Arenaria interpres, oystercatchers Haematopus ostralegus and dunlins Calidris alpina have been declining during recent decades (Austin & Rehfisch, Reference Austin and Rehfisch2005; Koryakin, Reference Koryakin2012). Since shell shape is considered as a trait under selection (see above, Luttikhuizen et al., Reference Luttikhuizen, Drent, Van Delden and Piersma2003), the predation pressure on flatter shells is expected to decrease and shells are predicted to become less globose on average – the opposite trend to those we observed in Kandalaksha Bay. These species however do not swallow clams whole, but dig them out and open them on the surface of the sediment (Hulscher, Reference Hulscher1982). Other species common in Kandalaksha Bay, such as eider ducks Somateria mollissima and common gulls Larus canus primarily feed on Mytilus mussels and not on Macoma (Mokievskiy et al., Reference Mokievskiy, Popovkina, Poyarkov, Tzetlin, Zhadan and Isachenko2012; Tolmacheva, Reference Tolmacheva2013; V.V. Bianki, personal communication). Thus, the observed increased globosity of Macoma shells cannot directly be related to the changes in selective pressure from birds feeding on the tidal flats.
Slow-growing bivalves are usually more globose than faster-growing members of the same species (Seed, Reference Seed1968; Gillmor, Reference Gillmor1980; Newell & Hidu, Reference Newell and Hidu1982). This trade-off between linear growth and change of mantle cavity volume matches the eco-physiological dynamic energy budget (DEB) models assuming that food digestion and assimilation of energy in ectotherms is proportional to the organism's surface area (Sarà et al., Reference Sarà, Palmeri, Montalto, Rinaldi and Widdows2013). Growth in M. balthica is restricted to water temperatures from 4 to 16°C with optimal growth conditions considered to be 10°C (Honkoop & van der Meer, Reference Honkoop and Van der Meer1997). At low tides Macoma can be stressed by high air temperatures during summer (Beukema et al., Reference Beukema, Dekker and Jansen2009). The long-term mean summer water temperatures in the White Sea during the past 50 years varied around 10–15°C (Usov et al., Reference Usov, Kutcheva, Primakov and Martynova2013). The increase in number of years with mean July surface area temperatures higher than 16°C since 1998 (Figure 2; Marshall et al., Reference Marshall, Vignols and Rees2016) offers one of the parsimonious explanations for decrease in linear growth rate in Macoma from Kandalaksha Bay.
Sediment type may be another factor responsible for shell shape in bivalves. The sand gaper Mya arenaria, often occurring in the same intertidal habitats as M. balthica, was shown to have a more globose shell in gravel than in sand or mud sediments (Newell & Hidu, Reference Newell and Hidu1982). This hypothesis needs testing since the site chosen to compare shell growth and shape is located in the estuary, where small sedimentation processes are unstable, but the sediment particle size distribution and organic content were not estimated during the M. balthica long-term monitoring programme. Hence, further study is required to make similar comparisons, but collections of clams from this part of the White Sea (either dry or preserved in alcohol/formalin) are difficult to find.
CONCLUSIONS
Densities of Macoma balthica observed at different locations across the apex of Kandalaksha Bay (the White Sea) have tended to fluctuate in parallel during recent 20 years. These long-term population dynamics are affected by climatic factors. We conclude that M. balthica in the White Sea benefit from mild winters. Year-to-year fluctuations in abundance of the moonsnail Amauropsis islandica, predating primarily on M. balthica at some sites studied, did not affect the general trend of clam dynamics. In addition, elevated seasonal temperatures in the White Sea may lead to changes in shell growth characteristics of M. balthica.
SUPPLEMENTARY MATERIAL
The supplementary material for this article can be found at https://doi.org/10.1017/S0025315417001473.
ACKNOWLEDGEMENTS
We are grateful to all participants of the White Sea expeditions of Laboratory of Marine Benthic Ecology and Hydrobiology in 1992–2012 for their help in the fieldwork and to the administration of Kandalaksha State Nature Reserve and personally to Alexander S. Koryakin for supporting our activity. We would like to thank Dr Vitaliy V. Bianki and Mikhail G. Bass for the productive discussion. We appreciate the comments which helped to enhance this paper of Dr Alexey A. Sukhotin and anonymous referees.
FINANCIAL SUPPORT
The study was partially supported by RFBR grant No 16-34-00682, and SPbSU Action 2 research project No. 1.38.253.2014.


