


INTRODUCTION
Movements in heterogeneous environments structure many ecological processes ranging from the organism to the ecosystem levels (Bowler & Benton, Reference Bowler and Benton2005; Nathan et al., Reference Nathan, Getz, Revilla, Holyoak, Kadmon, Saltz and Smouse2008). In particular, understanding the movements of organisms provides insight into the mechanistic links between behaviour and physiology (Matthews & Rodewald, Reference Matthews and Rodewald2010), environment (Barahona & Navarrette, Reference Barahona and Navarrete2010) and biological interactions between trophic levels (Rochette & Dill, Reference Rochette and Dill2000). Therefore, the comprehension of the determinism of movements across a range of spatial and temporal scales may critically advance fields such as behavioural ecology (Owen-Smith et al., Reference Owen-Smith, Fryxell and Merrill2010), population dynamics (Morales et al., Reference Morales, Moorcroft, Matthiopoulos, Frair, Kie, Powell, Merrill and Haydon2010), conservation biogeography and biodiversity (Franklin, Reference Franklin2010; Agudo et al., Reference Agudo, Rico, Hiraldo and Donázar2011), and climate change (Feder et al., Reference Feder, Garland, Marden and Zera2010; Franklin, Reference Franklin2010). However, empirical data on individual displacements are still required to reach a complete understanding of what factors and processes lead to the observed dispersion and distribution patterns (Buchanan, Reference Buchanan2008; Humphries et al., Reference Humphries, Queiroz, Dyer, Pade, Musyl, Schaefer, Fuller, Brunnschweiler, Doyle, Houghton, Hays, Jones, Noble, Wearmouth, Southall and Sims2010; Viswanathan, Reference Viswanathan2010). Ultimately, this information is fundamental to generate dynamic models of movements such as the recently developed space–state models that incorporate both the organism behaviour and environmental variables (see Patterson et al. (Reference Patterson, Thomas, Wilcox, Ovaskainene and Matthiopoulos2008) for a review).
Animals primarily move to find food and mates while avoiding predators in order to maintain individual fitness and potentially ensure the persistence of populations in changing environments (Bowler & Benton, Reference Bowler and Benton2005). Organisms thus exhibit innate and acquired motion behavioural strategies to optimize the search for resources (Owen-Smith et al., Reference Owen-Smith, Fryxell and Merrill2010; Chapperon & Seuront, Reference Chapperon and Seuront2011a), mates (Shane, Reference Shane2001) and refuges from environmental (e.g. thermal stress; Dubois et al., Reference Dubois, Blouin-Demers, Shipley and Thomas2009; Chapperon & Seuront, Reference Chapperon and Seuront2011b, Reference Chapperon and Seurontc) and biological constraints (e.g. predation: Orrock et al., Reference Orrock, Dill, Sih, Grabowski, Peaor, Peckarsky, Preisser, Vonesh and Werner2010). Specifically, the optimal foraging strategies adopted by a range of terrestrial and aquatic herbivores to maximize resource intake while minimizing energy expenditure (Pyke, Reference Pyke1984; Williams & Little, Reference Williams, Little, Denny and Gaines2007) are intrinsically defined by: (i) their ability to detect the resources and to move accordingly (Nathan et al., 2008); and (ii) the spatial distribution of primary producers as well as both their quality and quantity (Owen-Smith et al., Reference Owen-Smith, Fryxell and Merrill2010). Besides, other constraints such as the presence of predators and desiccation stress potentially generate trade-offs between the different fitness components of herbivores (Jones & Boulding, Reference Jones and Boulding1999; Schmitz et al., Reference Schmitz, Grabowski, Peckarsky, Preisser, Trussell and Vonesh2008). Behavioural changes in the displacements and distribution of individual organisms may thus be required to adapt to new environmental conditions while ensuring basic needs. Movements in spatially structured habitats, especially in the intertidal, are determined by the interaction of multiple abiotic (e.g. habitat complexity: Coffin et al., Reference Coffin, Drolet, Hamilton and Barbeau2008), biotic (e.g. food: Seuront et al., Reference Seuront, Duponchel and Chapperon2007) and intrinsic factors (e.g. reproductive status: Pardo & Johnson, Reference Pardo and Johnson2006). The displacements of intertidal organisms are therefore highly variable in space and time as they result from the behavioural responses of organisms to the space–time heterogeneity of the surrounding environment (Chapman, Reference Chapman2000a; Patterson et al., Reference Patterson, Thomas, Wilcox, Ovaskainene and Matthiopoulos2008). This specifically implies that intertidal invertebrates must have enough flexibility in their motion behaviour to adjust their movements and their distributions over different spatial (i.e. microhabitats to habitats) and temporal scales (i.e. minutes to seasons). Recent studies have focused upon the changes in the statistical properties of animal motion behaviour as a response to complex landscapes (Sims et al., Reference Sims, Southall, Humphries, Hays, Bradshaw, Pitchford, James, Ahmed, Brierley, Hindell, Morritt, Musyl, Righton, Shepard, Wearmouth, Wilson, Witt and Metcalfe2008) and food density (Humphries et al., Reference Humphries, Queiroz, Dyer, Pade, Musyl, Schaefer, Fuller, Brunnschweiler, Doyle, Houghton, Hays, Jones, Noble, Wearmouth, Southall and Sims2010) over a wide range of spatial scales. Temporal changes in the statistical properties of animal displacements are, however, still poorly investigated. In this context, this study aimed to: (i) quantify the temporal variability in the displacements and the distribution of the gastropod Nerita atramentosa on a south Australian temperate rocky shore over four distinct study periods, i.e. May (autumn), August (winter) and October (spring) 2009, and in February 2010 (summer); (ii) identify what environmental and/or biotic factors potentially drove the observed patterns; and (iii) examine the extent of snail motion behavioural flexibility. This work has been motivated by previous evidence that the motion behaviour of a range of animals is primarily constrained by the distribution and abundance of their resource (e.g. Seuront et al., Reference Seuront, Duponchel and Chapperon2007; Seuront & Vincent, Reference Seuront and Vincent2008; Sims et al., Reference Sims, Southall, Humphries, Hays, Bradshaw, Pitchford, James, Ahmed, Brierley, Hindell, Morritt, Musyl, Righton, Shepard, Wearmouth, Wilson, Witt and Metcalfe2008; Humphries et al., Reference Humphries, Queiroz, Dyer, Pade, Musyl, Schaefer, Fuller, Brunnschweiler, Doyle, Houghton, Hays, Jones, Noble, Wearmouth, Southall and Sims2010), and the assumption that microalgae in south Australian rocky shores distribute and abound similarly to other studied temperate rocky shores, where resources are more abundant at low shore levels than at high shore levels and during winter months than during summer months (Underwood, Reference Underwood1984; Thompson et al., Reference Thompson, Norton and Hawkins2004; Jackson et al., Reference Jackson, Underwood, Murphy and Skilleter2010). We consequently expected to observe: (i) Brownian movements when the food is likely to be the most abundant (i.e. August); (ii) ballistic movements when the food is depleted (i.e. summer); (iii) Lévy-like movements when the food is anticipated to be scarce but non-depleted (i.e. May and October); and (iv) seaward movements especially when the food abundance is predicted to be low (i.e. summer).
MATERIALS AND METHODS
Field site and species studied
The displacements and the distribution patterns of 240 Nerita atramentosa individuals (Reeve, 1855) were monitored on a temperate intertidal rocky shore in Marino Rocks (South Australia, Australia) during morning and midday low tides (i.e. 9 am to 2 pm) at four different periods of the year in May (autumn), August (winter) and October (spring) 2009, and in February 2010 (summer). Seawater and air temperature data during the monitored periods are summarized in Table 1. The study site was located at the upper bound of the intertidal zone of a moderately exposed boulder field (35°2′38.04″S–138°30′30.13″E) characterized by a variety of microhabitats such as pools and crevices. The rocks of the study site were consistently nearly bare all over the year although macroalgae such as Ulva sp. were occasionally observed. This site was chosen due to the presence of herbivorous gastropods such as Bembicium sp., Nodilittorina sp. and the predominance of the Neritidae N. atramentosa. The studied species is a superior competitor for microalgae on intertidal rocky shores (Underwood, Reference Underwood1984), active when immerged and show aggregative tendencies at low tide throughout the year (Underwood, Reference Underwood1976).
Table 1. Snail body size, meteorological data and metrics used to quantify the motion behaviour of Nerita atramentosa in four different periods in 2009–2010. Values are means. Circular statistics run in ORIANA version 3 (RockWare Inc., 2010, CO USA) were used to calculate mean angles and standard deviation of the mean (Zar, Reference Zar2010). Minimum and maximum values are also provided for meteorological data (AT, air temperature; WT, sea water temperature). d i and θ i are the daily distances displaced and the orientation angles taken between successive daytime low tides. The skewness (g 1) and the kurtosis (g 2) of the distributions of daily distances displaced d i are also indicated. All d i and θl values were pooled at each study period. Meteorological data source: Bureau of Meteorology of Australia (Port Stanvac).

Snail collection, tagging and release
For each study period, 60 adult individuals were randomly collected during the low tide using a random number table. The size (i.e. shell length and height) of each individual was measured using a calliper and the mean individual size was calculated for each study period (Table 1). Individuals were tagged with glue-on shellfish tags (8 × 4 mm, Hallprint, Hallprint Pty Ltd, Hindmarsh, South Australia). Tagging has previously been shown not to affect the motion behaviour of gastropods (e.g. Chapman, Reference Chapman2000b; Henry & Jarne Reference Henry and Jarne2007; Seuront et al., Reference Seuront, Duponchel and Chapperon2007). Each individual was subsequently randomly placed within a 25 × 25 cm area surrounding a release point situated on the top of the centre of a flat boulder (90 × 40 × 40 cm). Note that all the individuals used in the present work were collected from flat rocks on the studied boulder field to minimize the behavioural impact of the dislodgement and relocation on the release site. Marked snails were left undisturbed from the release day. The distribution and the displacements of each individual were recorded during the 8 subsequent daytime low tides. Whilst many littoral herbivorous molluscs can remain active during emersion when the rocks are damp (e.g. Little, Reference Little1989), all N. atramentosa individuals were immobile during the monitored low tides. Note that the relative uniformity of boulder size on the release site ensures that snail displacements were not constrained by topographic complexity.
Distribution of N. atramentosa: microhabitat occupation and status
Microhabitat distribution and individual status (i.e. aggregated versus solitary) of N. atramentosa was assessed at each low tide. Microhabitats were classified into 4 categories: flat rock, crevice, rock bottom and pool (Table 2). An individual was considered aggregated when there was a direct shell contact with the shell of at least another conspecific (Chapperon & Seuront, Reference Chapperon and Seuront2011b).
Table 2. Definitions and roles of the four microhabitats considered in this study.

Activity, dispersion and motion behaviour of N. atramentosa
ACTIVITY INDEX
An individual was defined as active when a change in position between two successive daytime low tides was detected. An activity index was calculated as:
 $$N_i/N\times 100\eqno\lpar 1\rpar$$
where N i is the total number of mobile individuals between two successive daytime low tides and N is the total number of recorded individuals. Some individuals were, however, found at the exact same location between successive daytime low tides. Since individuals were monitored at daytime low tide, it was impossible to determine whether the lack of movement corresponded to a lack of activity during the high tide or an indication of homing behaviour. However, we never observed any sign of homing behaviour in N. atramentosa during our field observations, which to our knowledge has also not been reported in the literature. As a consequence, an individual located at the exact same location over consecutive daytime low tides was considered as a lack of activity throughout this work.
FORAGING BEHAVIOUR
Nerita atramentosa individual displacements were monitored by measuring the orientation angle θ and the distance displaced d, i.e. the angle and distance displaced by each individual from the release point to the monitored snail position at each daytime low tide. The orientation angle θ was estimated from the release point using the magnetic North as a reference. The distance displaced d was measured by a plastic tape measure laid down the substratum topography from the release point to the snail's position. The x and y coordinates were estimated from the distance displaced d and orientation angle θ as:
 $$\left\{\matrix{x=d\times \cos \theta\cr y= d\times\sin\theta}\right.\eqno\lpar 2\rpar$$
The daily orientation angle θ i was defined as the angle taken by an individual between two successive daytime low tides and was calculated as:
 $$\theta_i = 180-\lsqb \lpar 180/\pi\rpar \rsqb \times \theta_e\eqno\lpar 3\rpar$$
with θ e defined as:
 $$\theta_e = arc \cos \lsqb \lpar p_1 p_2\rpar ^2 + \lpar p_2p_3\rpar ^2-\lpar p_1p_3\rpar ^2\rsqb /\lsqb 2\lpar p_1p_2\rpar \lpar p_2p_3\rpar \rsqb \eqno\lpar 4\rpar$$
where (p 1p 2), (p 1p 3) and (p 2p 3) are respectively the distances between the positions p 1 and p 2,p 1 and p 3, and p 2 and p 3 (Jerde & Visscher, Reference Jerde and Visscher2005). Likewise, the daily distance displaced d i was defined as the distance displaced by an individual between two successive daytime low tides and was calculated as:
 $$d_i=\sqrt {\left({x_{t+1} - x_t } \right)^2+\left({y_{t+1} - y_t } \right)^2 }\eqno\lpar 5\rpar$$
Finally, as intermittent motion behaviour has recently been identified in another species of intertidal snail, Littorina littorea (Seuront et al., Reference Seuront, Duponchel and Chapperon2007), the potential intermittency arising in the displacements of N. atramentosa (i.e. a few very large displacements over a wide range of small displacements) was investigated by comparing the probability density function P(d i) of the daily distance displaced d i to a power-law distribution of the form:
 $$P\lpar d_i\rpar =kd_i^{-\mu}\eqno\lpar 6\rpar$$
where μ is the slope of the log-log plot of P(d i) versus d i, and k is a constant. When 1 < μ ≤ 3, the displacements comprise many small steps connected by longer relocations that characterize Lévy processes; in the special case μ = 2, the movements correspond to a Lévy flight that has been identified in the movement behaviour of a range of organisms ranging from invertebrates to large fish, birds and mammals (e.g. Mårell et al., Reference Mårell, Ball and Hofgaard2002; Bartumeus et al., Reference Bartumeus, Peters, Pueyo, Marrasé and Catalan2003; Seuront et al., Reference Seuront, Duponchel and Chapperon2007; Sims et al., Reference Sims, Southall, Humphries, Hays, Bradshaw, Pitchford, James, Ahmed, Brierley, Hindell, Morritt, Musyl, Righton, Shepard, Wearmouth, Wilson, Witt and Metcalfe2008; Humphries et al., Reference Humphries, Queiroz, Dyer, Pade, Musyl, Schaefer, Fuller, Brunnschweiler, Doyle, Houghton, Hays, Jones, Noble, Wearmouth, Southall and Sims2010), and considered to be an optimal foraging strategy in places where preys are scarce and randomly distributed (Viswanathan et al., Reference Viswanathan, Buldyrev, Havlin, da Luz, Raposo and Stanley1999). When μ = 1, the displacements are ballistic (i.e. nearly linear displacements), and values μ ≤ 1 correspond to probability distribution that cannot be normalized. In contrast, when μ ≥ 3, the distribution of daily distance displaced is Gaussian and the movement is equivalent to a Brownian motion (i.e. normally distributed successive displacements occurring in random directions); see Seuront (Reference Seuront2010) and Viswanathan et al. (Reference Viswanathan, da Luz, Raposo and Stanley2011) for more details. More generally, the smaller the exponent μ, the more intermittent is the distribution of the distances d i. Because an objective criterion is needed to decide upon an appropriate range of values of the daily distances d i to include in the regression analysis, we used the values of d i which satisfied two statistically sound criteria. First, a regression window of a varying width that ranges from a minimum of 5 data points to the entire data set was considered. The smallest window was slid along the entire data set at the smallest available increments, with the whole procedure iterated (n–4) times, where n is the total number of available data points. Within each window and for each width, the coefficient of determination (r 2) and the sum of the squared residuals for the regression were estimated. Note that parametric regression analysis was used throughout this work instead of non-parametric regression analysis because the residuals were consistently normally distributed (Zar, Reference Zar2010). The values of d i (Equation 6), which maximized the coefficient of determination and minimized the total sum of the squared residuals, a procedure referred to as the R 2-SSR criterion (Seuront et al., Reference Seuront, Brewer, Strickler, Seuront and Strutton2004), were subsequently used to define the scaling range and to estimate the exponent μ.
DISPERSION
The ability of N. atramentosa individuals to disperse from a release point was investigated using the net travel angle and the net distance travelled, i.e. orientation angle and distance displaced between the release point and the last monitored low tide position for each snail.
Statistical analyses
As some individuals were not retrieved between two consecutive daytime low tides, daily distances and daily orientation angles were monitored for a minimum of 3 successive days since a minimum of three coordinates are required to calculate them. Note that this has been done to avoid any bias stemming from the use of observations conducted at different scales; see e.g. Seuront (Reference Seuront2010). Since the data were not normally distributed (Kolmogorov–Smirnov test, P < 0.05), the Kruskal–Wallis test (KW test hereafter) was run to analyse the temporal variations in individual distribution (aggregation and microhabitat occupation) and displacements (net distance displaced, daily distance displaced d i). A multiple comparison procedure based on the Tukey test was subsequently used to identify distinct groups of measurements (Zar, Reference Zar2010). In addition, the non-parametric Watson's U2 test was used to test for temporal differences in the net orientation angles and the daily orientation angles θi.
While a range of goodness of fit procedures exists in the literature to evaluate which distribution best fits experimental data (e.g. Edwards et al., Reference Edwards, Phillips, Watkins, Freeman, Murphy, Afanasyev, Buldyrev, da Luz, Raposo, Stanley and Viswanathan2007; Sims et al., Reference Sims, Southall, Humphries, Hays, Bradshaw, Pitchford, James, Ahmed, Brierley, Hindell, Morritt, Musyl, Righton, Shepard, Wearmouth, Wilson, Witt and Metcalfe2008; Humphries et al., Reference Humphries, Queiroz, Dyer, Pade, Musyl, Schaefer, Fuller, Brunnschweiler, Doyle, Houghton, Hays, Jones, Noble, Wearmouth, Southall and Sims2010), we followed Turchin's procedure (Turchin, Reference Turchin1998) to assess the quantitative nature of N. atramentosa daily displacement. Specifically, the distributions of daily orientation angles θi and net orientation angles were compared to a von Mises distribution using the Watson's U2 test, to a normal distribution using the Kolmogorov–Smirnov test (Zar, Reference Zar2010) and to a uniform distribution by using both tests.
The distributions of daily distances displaced d i were tested for uniformity with the Kolmogorov–Smirnov test. The autocorrelation functions (ACF) and the Box–Ljung statistic were used to test for autocorrelation in the successive displaced distances for all lags up to 7 moves (Turchin, Reference Turchin1998). All statistical analyses were run in PASW Statistics 18 (SPSS Inc., 2009, IL USA) and ORIANA version 3 (RockWare Inc., 2010, CO USA).
RESULTS
Temporal variability in N. atramentosa distribution pattern
AGGREGATION BEHAVIOUR (TABLE 3; FIGURE 1A)
The proportions of aggregation were significantly different between the study periods. In particular, the proportions of aggregation in May and August were significantly lower than in October and February. No significant difference was found between August and May, neither between October and February. Individuals aggregated more frequently within crevices in May (69%) and August (67%) and in pools in October and February (63% of aggregates).
Table 3. Kruskal–Wallis test and subsequent multiple comparisons (post-hoc based on the Tukey test) to investigate the temporal variation (M, May 2009; A, August 2009; O, October 2009; F, February 2010) in the parameters used to quantify Nerita atramentosa distribution and movement patterns between the four microhabitats. Results of the tests are indicated in the last column (NS, non-significant).

MICROHABITAT OCCUPATION (TABLE 3; FIGURE 1B)
No significant difference in the proportions of individuals found under rocks was detectable between the four study periods. In contrast, significant temporal differences were found in the proportions of individuals occupying crevices, pools and flat rocks. More specifically, the proportions of individuals occupying crevices were significantly higher in May than in the other periods. Similarly, higher percentages of organisms were distributed in crevices in August than in October and February. In contrast, the percentages of individuals in pools were significantly greater in February and October than in the two others periods. Likewise, individuals were significantly more frequently observed in pools in August than in May. No significant difference in the percentages of occupation of crevices and pools was found between October and February. Finally, the proportions of individuals resting on flat rocks were significantly lower in February and October, than in August and May. No significant difference in the percentages of individuals on flat rocks was found between May and August and, October and February.
Temporal variability in N. atramentosa dispersion and foraging behaviour
ACTIVITY INDEX
In total, 99%, 91% and 45% of individuals were respectively active in May and August, February, and October. The proportions of missing data due to unobserved individuals were higher in the warm months (56% in February, and 41% October) than in the cooler months (32% in August, and 18% in May).
DISPERSION (FIGURE 2)
Net orientation angles θ were 267.56° ± 3.40° ( $\bar x \pm {\bf SE}$), 231.64° ± 13.44°, 216.75° ± 21.05° and 208.04° ± 16.89° in May, February, August and October, respectively. They were significantly higher in May than in the three others study periods (U2May–Feb = 0.248, P < 0.05; U2May–Aug = 0.817, P < 0.001; U2May–Oct = 0.849, P < 0.001). No significant difference was, however, obtained between February, August and October (U2Feb–Aug = 0.052, P > 0.05; U2Feb–Oct = 0.128, P > 0.1; U2Aug–Oct = 0.142, P > 0.05). Net orientation angles distributions were not significantly uniformly distributed (U2May = 2.414, P < 0.005; U2Aug = 0.271, P < 0.01; U2Oct = 0.489, P < 0.005; U2Feb = 0.396, P < 0.005).
The net distance displaced (d) by N. atramentosa individuals was greater in May (621.50 ± 45.85 cm,  $\bar x \pm {\bf SE}$), than in February (474 ± 51.37 cm), October (263.41 ± 12.74 cm) and August (201.58 ± 21.58 cm). Significant differences in the net distance displaced were found (P < 0.001: Table 3). In particular, the net distances displaced were significantly greater in February and May than in August and October (QFeb–Aug = 3.946 > Q0.05,4, Q0.05,4 = 2.639; QFeb–Oct = 3.044 > Q0.05,4; QMay–Aug = 6.446 > Q0.05,4; QMay–Oct = 5.580 > Q0.05,4). No significant difference in the net distances displaced was observed between February and May (Q = 0.628 < Q0.05,4), and August and October (Q = 1.494 < Q0.05,4).
FORAGING BEHAVIOUR
The daily orientation angles θ i (Table 1) taken by individuals between two successive daytime low tides did not significantly differ between study periods (U2May–Aug = 0.057, P > 0.5; U2May–Oct = 0.135, 0.2 > P > 0.1; U2May–Feb = 0.161, 0.1 > P > 0.05; U2Aug–Oct = 0.147, 0.2 > P > 0.1; U2Aug–Feb= 0.14, 0.2 > P > 0.1; U2Oct–Feb= 0.175, 0.1 > P > 0.05). More specifically, whatever the study period, the distributions of daily orientation angles θi did not fit a von Mises distribution (U2May = 0.619, P < 0.005; U2Aug = 0.277, P < 0.005; U2Oct = 0.095, P < 0.05; U2Feb = 0.317, P < 0.005). Distributions were best fitted by a uniform distribution in May (Z = 0.785, P = 0.569), August (Z = 0.796, P = 0.550) and October (Z = 1.006, P = 0.264) and by a Normal distribution in February (Z = 1.328, P = 0.059).
Significant differences in the daily distances displaced d i between successive daytime low tides were observed between the different study periods (Table 3). Specifically, organisms moved over greater distances in February than at the three others periods (QFeb–May = 3.422 > Q0.05,4; QFeb–Aug = 4.525 > Q0.05,4; QFeb–Oct = 3.550 > Q0.05,4). No significant differences in d i were found between the three others periods (QMay–Aug = 1.735 < Q0.05,4; QMay–Oct = 1.136 < Q0.05,4; QOct–Aug= 0.193 < Q0.05,4).
The daily distances d i were not normally distributed (ZMay = 3.435, P < 0.001; ZAug= 1.868, P = 0.002; ZOct = 1.856, P = 0.002; ZFeb = 1.599, P = 0.012) and neither uniformly distributed (ZMay = 10.421, P < 0.001; ZAug= 5.619, P < 0.001; ZOct = 2.867, P < 0.001; ZFeb = 3.680, P < 0.001). Instead, they were positively skewed for all study periods, leptokurtic in May and August and platykurtic in October and February (Table 1). The log-log linear regressions of the frequency distributions of daily distance displaced were highly significant in May (R2 = 0.858, df = 8, t = –6.964, P < 0.001), August (R2 = 0.956, df = 5, t = −10.403, P < 0.001) and February (R2 = 0.617, df = 7, t = −3.359, P = 0.012) but not in October (R2 = 0.439, df = 3, t = −1.533, P = 0.223). More specifically, the distribution of daily distances displaced was close to a Lévy distribution in May (μ = 1.90) which contrasted with the power-law behaviours observed during the others study periods, with μ = 1.35 in August and μ = 1.10 in February. The exponent μ observed in May (μ = 1.90) cannot be statistically distinguished from the theoretical exponent expected for a Lévy flight (i.e. μ = 2.00, P > 0.05; modified t-test, Zar Reference Zar2010), while they were significantly lower in August and February (P < 0.05). No autocorrelation in distances displaced between successive daytime low tides was found in all periods (P > 0.05), except in one individual in May, October and February, and two individuals in August (P < 0.05).
DISCUSSION
Nerita atramentosa distribution patterns as an adaptation to exogenous and endogenous stressors
The clear temporal shift in N. atramentosa microhabitat occupation (i.e. a gradual increase in pool occupation and decrease in both crevice and flat rock occupation from May to February; Figure 1B) likely results from the behavioural selection of a favourable microhabitat related to the three major environmental stressors found in the intertidal that are temperature, desiccation and hydrodynamism. In October and February, N. atramentosa preferentially selected and aggregated within pools (63% of total aggregation: Figure 1) that reduce both thermal and desiccation stresses (Coffin et al., Reference Coffin, Drolet, Hamilton and Barbeau2008) more than the underneath of rocks or crevices (Bates & Hicks, Reference Bates and Hicks2005). In contrast, in May and August, aggregation within crevices (and pools in August: Figure 1) likely reduced dislodgement risk caused by breaking waves (Miller et al., Reference Miller, O'Donnell and Mach2007).
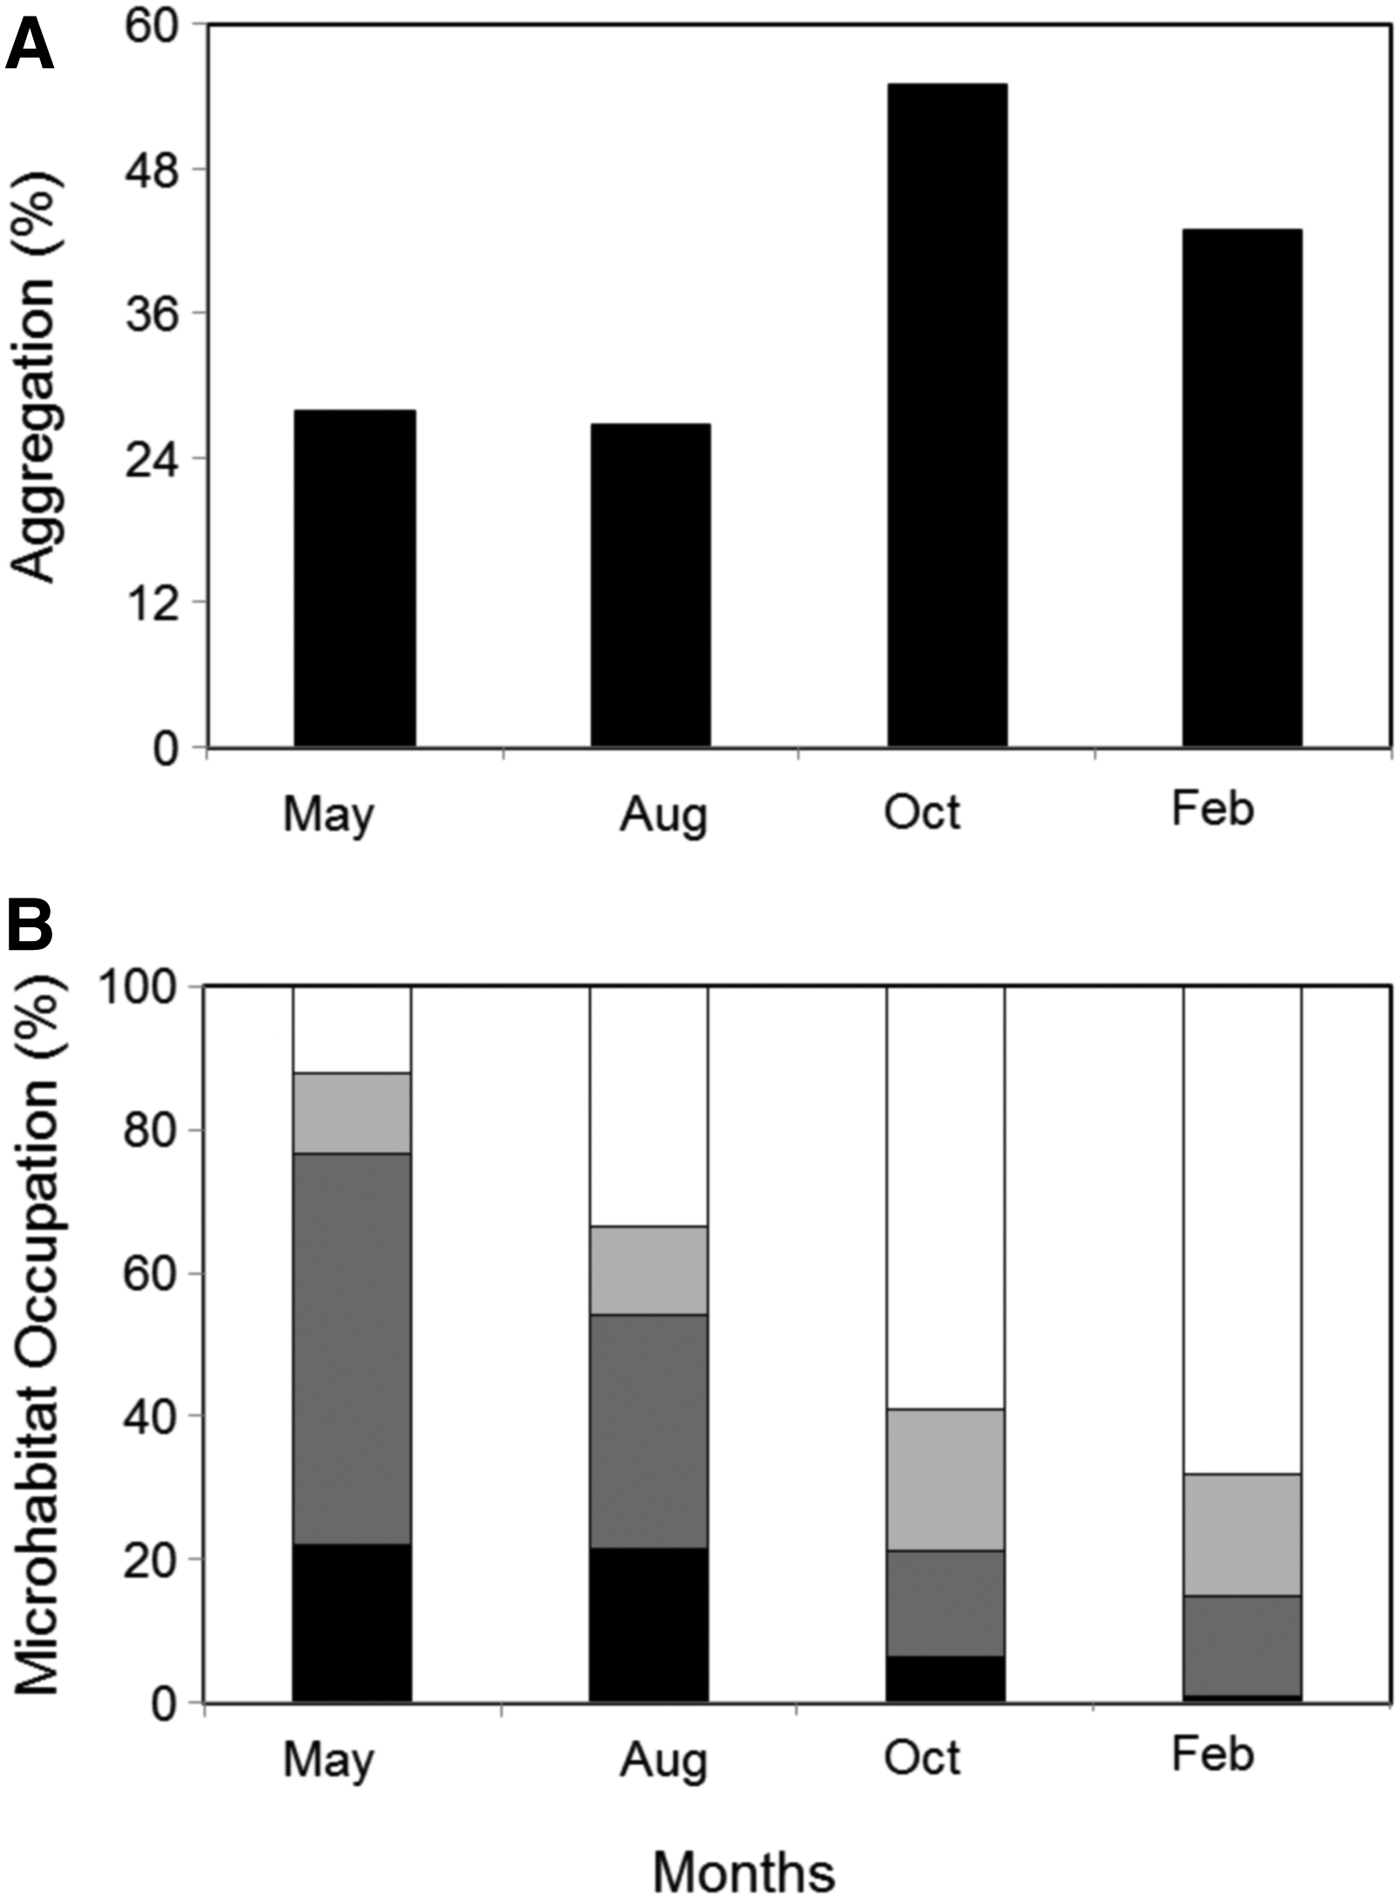
Fig. 1. Proportion of Nerita atramentosa individuals aggregated (A) and microhabitat occupation (B) at daytime low tide over 8 days in May 2009 (May), August 2009 (Aug), October 2009 (Oct) and February 2010 (Feb). The four microhabitats considered were pool (white bars), under rock (light grey bars), crevice (dark grey bars) and flat rock (black bars).
The temporal variability in microhabitat use and aggregation may also be explained by biological factors such as predation, reproduction and feeding. In particular, snails likely aggregated in February as a response to predation risk (as indicated by the consistent observations of crushed and empty shells; Chapperon & Seuront, personal observation) also observed in others invertebrates (Coleman, Reference Coleman2008). Breeding aggregation prior to N. atramentosa spawning season peak (September to April: Przeslawski, Reference Przeslawski2008) could also explain the 55% aggregation rate in October (Figure 1A).
The trail and/or odour following behaviour observed in N. atramentosa (Chapperon & Seuront, personal observation) may also contribute to the formation of aggregates (Stafford et al., Reference Stafford, Davies and Williams2007; Chapperon & Seuront, Reference Chapperon and Seuront2009, Reference Chapperon and Seuront2011b). Finally, N. atramentosa distribution could be primarily determined by the abundance and the small-scale patchiness of microphytobenthos (Seuront & Spilmont, Reference Seuront and Spilmont2002; Murphy et al., Reference Murphy, Underwood, Tolhurst and Chapman2008). More specifically, individuals may remain aggregated whilst the tide is retreating in the microhabitat that abounds the most with microalgae (i.e. crevices in August and May, and rockpools in October and February), and in which grazing activities are undertaken during immersion (Berger & Weaver, Reference Berger and Weaver2004). Although no movement was observed in N. atramentosa during the monitored day-time low tides, the observed individual distribution could also result from the potential trail following and/or grazing movements of snails on wet rocks during emersion (due to rainfall or awash conditions: Little, Reference Little1989).
Nerita atramentosa dispersion as an adaptation to environmental stress and food availability
Nerita atramentosa displacements in August and October (Figure 2C–F) suggest maintenance of individuals at their shore level (Williams, Reference Williams1995). Individuals remained in the vicinity up and mainly down the release point (Figure 2C–F). This limited dispersion indicates that snail activities were restricted to a small area, i.e. within a 3 m radius around the release point (Figure 2C–F). Snails might have intensively fed upon microalgae previously identified to be particularly abundant during this period of the year (i.e. winter) on other temperate rocky shores in New South Wales and the United Kingdom (Underwood, Reference Underwood1984; Thompson et al., Reference Thompson, Norton and Hawkins2004; Jackson et al., Reference Jackson, Underwood, Murphy and Skilleter2010). This low dispersion is also consistent with the lower seawater temperature (Table 1; Seuffert et al., Reference Seuffert, Burela and Martín2010) and the increase in wave action (Pardo & Johnson, Reference Pardo and Johnson2006) observed over the study site in August and October (Chapperon & Seuront, personal observation) that may have constrained organisms to adhere to the substratum in order to reduce dislodgement risk (Barahona & Navarrete, Reference Barahona and Navarrete2010). Further investigations are, however, required to assess the eventual relationship between wave action force (non-measured in the present study) and N. atramentosa movements.

Fig. 2. Two-dimensional positions (cm) of Nerita atramentosa individuals (white dots) from the release point (A, C, E, G, black square) recorded at 8 daytime low tides in May 2009 (A, N = 396), August 2009 (C, N = 285), October 2009 (E, N = 285) and February 2010 (G, N = 212). Net directions and distances displaced from the release point (B, D, F, H, centre of circle) in May 2009 (B, N = 42), August 2009 (D, N = 24), October 2009 (F, N = 37) and February 2009 (H, N = 11). Each vector indicates the net direction taken by each individual. The concentric circles represent the distance displaced (increments of 312.5 cm from 0 to 1250 cm). The length of a vector is indicative of the individual distance travelled from the release point. The solid lines and the arcs are representative of the mean direction and its 95% confidence interval. The bottom of the graphs is oriented seaward.
In February and May, N. atramentosa moved farther seaward (i.e. within a 6 to 9 m radius from the release point: Figure 2A, B, G, H), as observed in others neritids (Garrity & Levings, Reference Garrity and Levings1981). Seaward displacements (Figure 2A, B, G, H) were possibly driven by more suitable feeding and/or environmental conditions prevailing at lower shore levels (Williams, Reference Williams1994; Gibson, Reference Gibson2003). Particularly, N. atramentosa likely foraged extensively to increase the likelihood of encountering microphytobenthos resources that have been demonstrated to be scarce during this period of the year especially at the high shore level on other temperate rocky shores in New South Wales and the United Kingdom (Underwood, Reference Underwood1984; Thompson et al., Reference Thompson, Norton and Hawkins2004; Jackson et al., Reference Jackson, Underwood, Murphy and Skilleter2010). Finally, the increase in seawater temperature (Table 1) may have increased N. atramentosa locomotor performance (e.g. Barahona & Navarrete, Reference Barahona and Navarrete2010), hence increased their dispersion abilities. In order to validate the hypothesis that snail movements are directed by the space–time variability in microalgal resources, further experiments are however required to investigate the abundance, distribution and availability of microphytobenthos on south Australian rocky shores, that were not measured in the present study. Interpretations of the present results were solely based on the assumption that the space–time variability in the abundance, distribution and availability of south Australian microalgal resources is comparable to that observed on other temperate rocky shores (i.e. New South Wales and the United Kingdom: Underwood, Reference Underwood1984; Thompson et al., Reference Thompson, Norton and Hawkins2004; Jackson et al., Reference Jackson, Underwood, Murphy and Skilleter2010).
Intermittency in foraging behaviour: an adaptive response to resource distribution
The foraging behaviour of N. atramentosa, further assessed through the probability density function of their successive daily displacements d i, was found to exhibit intermittent properties, i.e. their probability density functions P(d i) follow a power-law behaviour P(d i) = kd i−μ (see Equation (6)) in May, August and February. This indicates that the successive displacements of N. atramentosa belong to a family of distributions defined according to the value of the exponent μ. This is consistent with an adaptive response of N. atramentosa to the Lévy-like patterns previously identified in the spatial distribution of microphytobentos biomass over a range of intertidal environments (Seuront & Spilmont, Reference Seuront and Spilmont2002; Seuront, Reference Seuront2010). A similar response to resource distribution has also been identified in the foraging behaviour of top predators (Sims et al., Reference Sims, Southall, Humphries, Hays, Bradshaw, Pitchford, James, Ahmed, Brierley, Hindell, Morritt, Musyl, Righton, Shepard, Wearmouth, Wilson, Witt and Metcalfe2008). In addition, the increase in the exponent μ observed from μ = 1.10 in February, μ = 1.35 in August, and μ = 1.90 in May, may be indicative of a concomitant increase in foraging activity as seen from the foraging behaviour of Littorina littorea (Seuront et al., Reference Seuront, Duponchel and Chapperon2007).
More specifically, the exponent μ was not significantly distinguished (modified t-test, P > 0.05: Zar, Reference Zar2010) from the value μ = 2 in May, as expected for a Lévy flight. Under the Lévy flights foraging hypothesis, Lévy flights are considered as an optimal foraging strategy where prey is scarce and randomly distributed, while Brownian motion (μ = 3) is expected in environments where prey is abundant (Viswanathan et al., Reference Viswanathan, Buldyrev, Havlin, da Luz, Raposo and Stanley1999). This is consistent with the low density but non-depleted resource expected in our sampling site in May if microalgal resource abundance follows that observed in others temperate rocky shores of New South Wales and the United Kingdom (Underwood, Reference Underwood1984; Thompson et al., Reference Thompson, Norton and Hawkins2004; Jackson et al., Reference Jackson, Underwood, Murphy and Skilleter2010), and with the Lévy flights identified in the foraging behaviour of Littorina littorea on a low food density rocky shore during European winter (Seuront et al., Reference Seuront, Duponchel and Chapperon2007). This contrasts, however, with the nearly ballistic movements (i.e. exponent μ close to unity) observed in February and previously found in N. atramentosa in the absence of food, i.e. depleted resource (Chapperon & Seuront, Reference Chapperon and Seuront2011a). This suggests that under similar conditions of low food density, N. atramentosa may behaviourally optimize its foraging behaviour depending on both the spatial patterns and the level of food depletion, i.e. depleted versus non-depleted. The optimal Brownian foraging strategy (μ = 3) anticipated under conditions of abundant resources (Humphries et al., Reference Humphries, Queiroz, Dyer, Pade, Musyl, Schaefer, Fuller, Brunnschweiler, Doyle, Houghton, Hays, Jones, Noble, Wearmouth, Southall and Sims2010), as expected in winter and spring months (Underwood, Reference Underwood1984; Thompson et al., Reference Thompson, Norton and Hawkins2004; Jackson et al., Reference Jackson, Underwood, Murphy and Skilleter2010), was not observed. Instead, organisms were confined to the surroundings of the release point, and exhibited Lévy-like properties in August but not in October. This suggests that the intermittent properties observed in August and October may not be solely related to food foraging, but also impacted by other environmental processes such as hydrodynamism or predation (Bartumeus, Reference Bartumeus2009).
Technical limitations in movement studies: a challenge for intertidal ecologists
These results were obtained from a mark–release–capture method that provides discontinuous spatial observations of individuals, i.e. a ‘capture history’ (Patterson et al., Reference Patterson, Thomas, Wilcox, Ovaskainene and Matthiopoulos2008). Snails were thus implicitly, and over-simplistically, assumed to displace linearly during immersion between two successive day-time low tides. Nerita atramentosa individuals, however, have previously exhibited convoluted trajectories and elevated individual speed up to 10.7 cm min−1 when observed at high temporal resolution (i.e. 15 seconds: Chapperon & Seuront, Reference Chapperon and Seuront2011a). Mean N. atramentosa distance travelled during each study period was therefore likely underestimated. In addition, some individuals were not observed over either short periods (e.g. one day) or until the end of the monitoring. This absence of information also constitutes a potential bias in the data set since it is not clear whether those individuals were: (i) alive but out of sight hidden in deep depressions; (ii) far beyond the prospection area; (iii) dead due to predation, thermal or desiccation stresses; or (iv) dislodged and exported from the studied area by breaking waves. This highlights the difficulties faced by intertidal ecologists in studying movement and distribution patterns in the intertidal that are most often based solely on the interpretations of indirect observations. An increase in the awareness of intertidal ecologists for new technologies, multi-expertise and the development of new biotelemetric devices adapted to small size organisms (Cooke et al., Reference Cooke, Hinch, Wikelski, Andrews, Kuchel, Wolcott and Butler2004) is hence essential to achieve a more thorough understanding of the patterns of distribution, dispersion and movement in order to implement species conservation and management plans in the changing world.
Conclusion
This study highlights that N. atramentosa individuals have enough motion behavioural flexibility to adapt: (i) their microhabitat occupation and aggregation patterns to the various environmental and biological conditions encountered in different periods of the year; and (ii) their foraging strategy to the predicted stochastic patterns of their landscape (e.g. Lévy-like food distribution) based on the hypothesis that south Australian microalgal resources have similar space–time variability in their distribution, abundance and availability than other temperate rocky shores (New South Wales and the United Kingdom: Underwood, Reference Underwood1984; Thompson et al., Reference Thompson, Norton and Hawkins2004; Jackson et al., Reference Jackson, Underwood, Murphy and Skilleter2010). Under this hypothesis, our results also support the fact that the Lévy flights previously observed in Littorina littorea (Seuront et al., Reference Seuront, Duponchel and Chapperon2007) might occur among a range of intertidal grazers, but also suggests that Lévy behaviour may not be the universal rule in heterogeneous and fluctuating environments (Humphries et al., Reference Humphries, Queiroz, Dyer, Pade, Musyl, Schaefer, Fuller, Brunnschweiler, Doyle, Houghton, Hays, Jones, Noble, Wearmouth, Southall and Sims2010). Further investigations are also required to identify the factors triggering the observed switch between different foraging strategies. Although snails are able to detect food sources by chemoreception and to adapt their movements accordingly (Croll, Reference Croll1983), the presumed switch observed between different searching strategies may also: (i) be reminiscent of innate properties in N. atramentosa motion behaviour (see also Chapperon & Seuront, Reference Chapperon and Seuront2011a); (ii) resume from an internal clock (e.g. endogenous rhythm: Williams & Little, Reference Williams, Little, Denny and Gaines2007; Gray & Williams, Reference Gray and Williams2010); or (iii) be activated by other environmental factors specific to each season (e.g. water temperature). Finally, the observed behavioural flexibility in N. atramentosa might constitute a strong evolutionary advantage in stressful and fluctuating environments such as the intertidal which are likely to be heavily impacted by the fast changing world climate.
ACKNOWLEDGEMENTS
We thank V. Van-Dongen-Vogels, N. Cribb, C. Le Bris, Ines Le Fur and Hannah Ling for assistance during fieldwork. We are grateful to Dr J. Seymour for his advices, suggestions and helpful discussion that facilitated this work. The comments of Professor P. Fairweather on field observations improved the discussion of this manuscript. Two anonymous referees are acknowledged for their constructive comments and criticisms on an earlier version of this work. This research was supported by the South Australian Government (through the Marine Innovation South Australia initiative) and under Australian Research Council's Discovery Projects funding scheme (project number DP0988554). Professor Seuront is the recipient of an Australian Professorial Fellowship (project number DP0988554). C. Chapperon was supported by an International Postgraduate Research Scholarship. All animals were handled in accordance with university and government regulations.


