


INTRODUCTION
Trophic relationships are the key to understanding deep-sea ecosystem structure and functioning (Tyler, Reference Tyler and Tyler2003). They influence the depth distributions of species and diversity patterns with depth, as well as the pelagos with the benthos (Cartes & Carrassón, Reference Cartes and Carrassón2004). Trophic relationships and their temporal dynamics are very poorly known in ocean margin ecosystems, especially in the case of the small zooplankton and micronekton and their role as vectors of energy transfer in the benthic boundary layer (BBL). The deep-sea BBL biota (suprabenthos/hyperbenthos; Mees & Jones, Reference Mees and Jones1997), and bathypelagic meso-zooplankton are complex groups with permanent and temporary faunal groups. The permanent suprabenthos are dominated by peracarid crustaceans (e.g. mysids and amphipods). The temporary suprabenthos (e.g. euphausiids and natant decapod crustaceans), spend only an element of their time in their BBL owing to diurnal vertical, seasonal and/or ontogenetic migrations. These groups are key links between primary producers and higher trophic levels because they are prey for top predators such as fish and large decapod crustaceans (Mauchline, Reference Mauchline1980; Sainte-Marie & Brunel, Reference Sainte-Marie and Brunel1985, Cartes et al., Reference Cartes, Maynou, Moranta, Massutí, Lloris and Morales-Nin2004).
The main food source for suprabenthic fauna at bathyal depths is detritus derived from primary production in surface waters (Polunin et al., Reference Polunin, Morales-Nin, Pawsey, Cartes, Pinnegar and Moranta2001; Madurell et al., Reference Madurell, Fanelli and Cartes2008). Using stable isotopes at least two different trophic levels were identified among suprabenthic crustaceans in the western Mediterranean, including detritus feeders and carnivores (Fanelli et al., Reference Fanelli, Cartes, Rumolo and Sprovieri2009). Results on the dynamics of the abundance and biomass of suprabenthos in the western Mediterranean suggest that primary productivity at the sea surface is linked to the bathyal BBL by two different pathways. First, zooplankton (including the temporary suprabenthos) feed directly on phytoplankton in surface waters by daily (nightly) migrations to the photic zone. The permanent suprabenthos, however, is dependent on detritus deposited on the seafloor and/or resuspended in the BBL (Cartes et al., Reference Cartes, Madurell, Fanelli and López-Jurado2008). Both compartments are linked to the primary production cycle, and are therefore influenced by seasonal shifts in food availability and quality.
Fatty acid biomarkers have been extensively used as a useful method for determining food web relationships and dietary habits of marine species over an integrated time (Graeve et al., Reference Graeve, Kattner and Hagen1994a, Reference Graeve, Hagen and Kattnerb). As in the case of stable isotopy we estimate the assimilated food, in contrast to stomach content analysis that gave information at a shorter time scale of the ingested food (Sano et al., Reference Sano, Omori and Taniguchi2003). Hence, certain fatty acids or ratios between ‘marker lipids’ can provide precise indication of the diet of marine animals and of their trophic position. Valuable information on diet composition and food sources can be derived from seasonal dynamics in the fatty acid composition of marine organisms. These methods are particularly useful for small species, when gut content analyses are difficult to perform. Marker fatty acids are specific to a particular individual organism or groups of organisms because they are incorporated into consumers in a conservative manner (Cook et al., Reference Cook, Shucksmith, Orr, Ashton and Berge2010), and therefore retain a signature of the diet sources (Sargent et al., Reference Sargent, Parkes, Mueller-Harvey, Henderson and Sleigh1987; Dalsgaard et al., Reference Dalsgaard, St John, Kattner, Muller-Navarra and Hagen2003). Therefore 16:1(n-7), 18:4(n-3) and 18:1(n-7) are typical phytoplankton markers (Falk-Petersen et al., Reference Falk-Petersen, Hagen, Kattner, Clarke and Sargent2000), 16:1(n-7), C16 PUFA and 20:5(n-3) and a 16:0/16:1(n-7) > 1 indicates high consumption of diatoms (Kharlamenko et al., Reference Kharlamenko, Zhukova, Khotimchenko, Svetashev and Kamenev1995; Falk-Petersen et al., Reference Falk-Petersen, Hagen, Kattner, Clarke and Sargent2000), while high proportions of 18:4(n-3), 18:5(n-3), and 22:6(n-3) tend to indicate consumption of dinoflagellates (Falk-Petersen et al., Reference Falk-Petersen, Hagen, Kattner, Clarke and Sargent2000) as also is indicated by a low proportion in 16:1(n-7). 22:6(n-3), 18:1(n-9) and a low ratio 18:1(n-9)/18:1(n-7) has also been associated with carnivorous habits in marine invertebrates (Kharlamenko et al., Reference Kharlamenko, Zhukova, Khotimchenko, Svetashev and Kamenev1995; Cook et al., Reference Cook, Bell, Black and Kelly2000). Finally, occurrence of bacteria in the diet is linked to the proportion of odd-chained and branched fatty acids and the ratio of 18:1(n-9)/18:1(n-7) fatty acids (Sargent et al., Reference Sargent, Parkes, Mueller-Harvey, Henderson and Sleigh1987; Kharlamenko et al., Reference Kharlamenko, Zhukova, Khotimchenko, Svetashev and Kamenev1995; Cook et al., Reference Cook, Shucksmith, Orr, Ashton and Berge2010).
There is a large body of literature on the fatty acid composition of calanoid copepods (see Dalsgaard et al., Reference Dalsgaard, St John, Kattner, Muller-Navarra and Hagen2003 for a review). Lipid and fatty acid research has focused on euphausiids (Dalsgaard et al., Reference Dalsgaard, St John, Kattner, Muller-Navarra and Hagen2003; Mayzaud et al., Reference Mayzaud, Boutoute and Alonzo2003; Stübing & Hagen, Reference Stübing and Hagen2003; Ju & Harvey, Reference Ju and Harvey2004) and hyperiid amphipods (Nelson et al., Reference Nelson, Mooney, Nichols and Phleger2001; Auel et al., Reference Auel, Harjes, da Rocha, Stübing and Hagen2002; García-Guerra et al., Reference García-Guerra, Martínez-Pita and Pita2004). In contrast, very little is known about fatty acids of hyperbenthic species (Scott et al., Reference Scott, Falk-Petersen, Sargent, Hop, Lonne and Poltermann1999; Bühring & Christiansen, Reference Bühring and Christiansen2001; Nelson et al., Reference Nelson, Mooney, Nichols and Phleger2001, Nyssen et al., Reference Nyssen, Brey, Dauby and Graeve2005; Richoux et al., Reference Richoux, Deibel, Thompson and Parrish2005; Werner & Auel, Reference Werner and Auel2005). In addition studies on the seasonal dynamics of fatty acids are scarce and are restricted mainly to euphausiids from the Arctic and Antarctic (Hagen & Kattner, Reference Hagen and Kattner1998; Falk-Petersen, et al., Reference Falk-Petersen, Hagen, Kattner, Clarke and Sargent2000; Hagen et al., Reference Hagen, Kattner, Terbrüggen and Van Vleet2001; Phleger et al., Reference Phleger, Nelson, Mooney and Nichols2002). In the deep sea the lipid biomarker approach has only been applied to benthic fauna off the Pakistan Margin (Jeffreys et al., Reference Jeffreys, Wolff and Murty2009). Seasonal studies have been restricted to the response of benthos (meio and megafauna) to fluxes of labile organic matter in sediments (e.g. Suhr et al., Reference Suhr, Pond, Gooday and Smith2003; Hudson et al., Reference Hudson, Pond, Billett, Tyler, Lampitt and Wolff2004). The response of BBL zooplankton is totally unknown although this fauna often has higher P/B than the infauna (Cartes et al., Reference Cartes, Brey, Sorbe and Maynou2002). Therefore, the study of food assimilation and energy transfer among BBL zooplankton with a high metabolic capacity is of particular interest.
The mysid Boreomysis arctica (Krøyer, 1861) (permanent suprabenthos) and the euphausiid Nematoscelis megalops (G.O. Sars, 1883) (near-bottom macrozooplankton) are the two dominant components of the slope BBL in the western Mediterranean. Both species dominate the biomass collected in both suprabenthic sledges (between 0 and 2 m above bottom (mab)) and near bottom zooplankton nets at depths (~15–50 mab) (Casanova, Reference Casanova1974; Cartes et al., Reference Cartes, Jaume and Madurell2003, Reference Cartes, Fanelli, Papiol and Zucca2010). Despite the importance of these species in the energetics of bathyal ecosystems little is known about their feeding habits and trophic relationships. Boreomysis arctica is an omnivorous non-selective feeder, preying mainly on copepods. It also consumes a high variety of phytodetritus (Cartes & Sorbe, Reference Cartes and Sorbe1998). Very little is known about the diet of N. megalops in the deep Mediterranean (Casanova, Reference Casanova1974). Nematoscelis megalops has a reduced mandible palp and thoracopods lacking setae. This is characteristic of carnivorous euphausiids (Casanova, Reference Casanova1974) which feed primarily on copepods. Smaller carnivorous euphausiid individuals (carapace length (CL) 15 mm) also feed on detritus and phytoplankton (Casanova, Reference Casanova1974). Information on the diet of N. megalops is also known from Southern Ocean populations and from off the coast of Namibia (Barange et al., 1991; Gurney et al., Reference Gurney, Froneman, Pakhomov and McQuaid2001). In these upwelling/highly productive systems individuals of N. megalops are larger and are distributed at shallower depths than in the deep oligotrophic Mediterranean Sea. Both studies indicate that adults of N. megalops are carnivorous feeding mainly on copepods. Adults of N. megalops perform diel vertical migration to the thermocline layer to feed (Barangé et al., Reference Barangé, Gibbons and Carola1991; Andersen et al., Reference Andersen, Devey, Gubanovai, Picheral, Melniko, Tsarin and Prieura2004). Euphausiids are generally considered to be opportunistic omnivores and may change their feeding strategy depending on food availability (Mauchline, Reference Mauchline1980) switching to omnivorous feeding during non-bloom periods.
The objectives of this research were to characterize lipid biomarkers of B. arctica and N. megalops and to evaluate the seasonal dynamics of their fatty acid and other lipidic compounds composition. This will allow us to elucidate and compare food sources exploited by two species belonging to two different habitats and ecological compartments (hyperbenthos and zooplankton) in the water column and sediment/water interface. The results are compared with previous studies on diet derived from gut content analysis (Casanova, Reference Casanova1974; Cartes & Sorbe, Reference Cartes and Sorbe1998) bearing in mind the different life histories of the two target species.
MATERIALS AND METHODS
Sampling
Specimens of B. arctica and N. megalops were obtained during the IDEA cruises, conducted north-west of Mallorca (Balearic Islands, western Mediterranean) between 38°98–39°81′N and 2°18'–2°76′E at depths ranging between 650 and 780 m (see Cartes et al., Reference Cartes, Madurell, Fanelli and López-Jurado2008 for more details of the study area). Samples were collected seasonally, during five cruises performed in August 2003, November 2003, February 2004, April 2004 and June 2004, using a Macer-GIROQ suprabenthic sledge (0.5 mm mesh size). Between two and four individuals per cruise of both species were selected for lipid analysis (only large sizes and non-mature specimens for each species to avoid biass due to reproduction peaks). Individuals were sorted, measured, frozen at –20oC, and then stored until their preparation for analyses. Prior to lipid extraction the samples were freeze-dried. Whole animal polar lipid fatty acid profiles were determined for both species.
Lipid analyses
The methods for the determination of lipids have been described in detail by Kiriakoulakis et al. (Reference Kiriakoulakis, Stutt, Rowland, Vangriesheim, Lampitt and Wolff2001, Reference Kiriakoulakis, White, Bett and Wolff2004). Briefly, freeze-dried samples were spiked with an internal standard (cholestane), sonicated–extracted with dichloromethane:methanol; 9:1 and then methylated with methanolic acetyl chloride. GC–MS analyses were carried out on the derivatized (bis-trimethylsilyltrifluoroacetamide; BSFTA, 1% TMS; 50 µL; 40oC; 1 hour) methylated total extracts using a Trace 2000 Series gas chromatograph (on-column injector; fused high temperature silica column, 60 m × 0.25 mm i.d.; 5% phenyl/95% methyl polysiloxane equivalent phase; DB5-HT; J&W carrier gas helium at 1.6 mL min−1), coupled with a Thermoquest Finnigan TSQ7000 mass spectrometer (ionization potential 70 eV; source temperature 215oC; trap current 300 µA). Profiles were processed using Xcalibur software.
Compounds were identified by comparison of their mass spectra and relative retention indices with those available in the literature and/or by comparison with authentic standards. Quantitative data were calculated by comparison of peak areas with internal standards using the total ion current (TIC) chromatogram. The relative response factors were determined individually for 36 representative fatty acids, sterols and alkenones using authentic standards. Response factors for compounds with no standards available were assumed to be identical to those of available compounds of the same class.
Lipid biomarkers
Main fatty acids used as biomarkers (for reviews see: Dalsgaard et al., Reference Dalsgaard, St John, Kattner, Muller-Navarra and Hagen2003; Lee et al., Reference Lee, Hagen and Kattner2006) can be summarized as: (i) 20:5(n-3) and 16:1(n-7) for diatoms; (ii) 22:6(n-3) and 18:4(n-3) and 16:0 for dinoflagellates, though the 16:0 is also abundant in phytodetritus; and (iii) 18:1(n-9), 20:1(n-9) and 22:1(n-11) and their corresponding alcohols are mainly found in metazoans and are indicators for carnivorous feeding on copepods.
The most common ratios used include the ratios 16:1(n-7)/16:0 and 20:5(n-3)/22:6(n-3) to differentiate between diatom or flagellate diet, and the 18:1(n-9)/18:1(n-7) and PUFA/SFA ratio as measures of carnivorous diet (Dalsgaard et al., Reference Dalsgaard, St John, Kattner, Muller-Navarra and Hagen2003; Stübing & Hagen, Reference Stübing and Hagen2003). These are the most useful biomarkers for our approach on the trophic dynamics of deep crustacean.
Statistical analyses
Differences between seasons in lipid contents (and in the body size, CL, mm) of specimens analysed were tested with analysis of variance (ANOVA) tests with Tukey test for post-hoc paired comparisons. In order to summarize the seasonal changes in the fatty acid composition (fatty acids that account for >1% of the total fatty acid composition) of Boreomys artica and Nematoscelis megalops principal component analyses (PCAs) were performed on log transformed-normalized data using the PRIMER 6.1.6 software (Clarke & Warwick, Reference Clarke and Warwick1995).
RESULTS
Individuals of Boreomys artica and Nematoscelis megalops differed in size between some of the different periods studied, with a significant decrease in CL in autumn (November; ANOVA P = 0.02) for B. arctica and in summer (August and June; ANOVA P = 0.01) for N. megalops (Tables 1 & 2). This may be considered in interpreting results obtained in those periods.
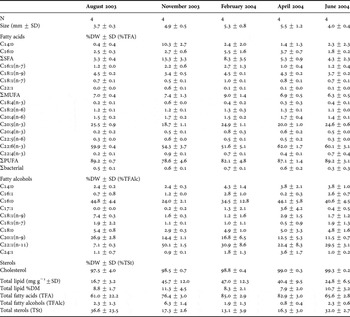
Table 1. Lipidic profile of Boreomysis arctica in the five periods analysed. N, number of specimens. Compounds found in trace amounts not included. %DW, dry weight %; ΣSFA, sum of saturated fatty acids; ΣMUFA, sum of monounsaturated fatty acids; ΣPUFA, sum of polyunsaturated fatty acids; Σbacterial, sum of odd chain fatty acids.

Table 2. Lipidic profile of Nematoscelis megalops in the five periods analysed. N, number of specimens. Other compounds found in trace amounts not included. %DW, dry weight %; ΣSFA, sum of saturated fatty acids; ΣMUFA: sum of monounsaturated fatty acids; ΣPUFA, sum of polyunsaturated fatty acids; Σbacterial, sum of odd chain fatty acids.
Total lipids
Boreomysis arctica showed higher overall lipid contents (range between 6.2 and 44.4% of dry weight (DW)) than Nematoscelis megalops (7.3–11.3% DW) (Table 1). Boreomysis arctica showed higher total lipid content in February (ANOVA, P = 0.03) and the lowest value was found in August. By contrast, non-significant differences (ANOVA) in the overall lipid content were observed for N. megalops (Table 2).
Fatty acids and sterols dominated the overall lipid composition in both species, while the concentrations of fatty alcohols were much lower (between 0.3 and 3.7% of total lipids for B. arctica and between 0.8 and 6.3% for N. megalops) (Tables 1 & 2). In B. arctica, the proportions of fatty acids (TFA) were greatest in November 2003 and lowest in June 2004. Sterol concentrations were lowest in autumn (November 2003) and greatest in June 2004 (Table 1). In N. megalops fatty acids increased from autumn (November 2003) through to spring (April). Lowest concentrations occurred in summer months (August 2003 and June 2004) (Table 2). As in the case of B. arctica sterols presented the opposite pattern with higher values in summer and lower in November and February (Table 2).
Fatty acids
Polyunsaturated fatty acids (PUFAs) contributed the greatest percentage of fatty acids in both species (between 48.2% to 72.9% for B. arctica and ~80% in N. megalops) (Tables 1 & 2)
Boreomysis arctica: forty fatty acids were identified for B. arctica (Table 1). PUFAs represented the highest percentage of fatty acids showing an increase from autumn (November 2003) to a maximum in spring (April 2004). Lowest concentrations occurred in summer months. Saturated fatty acids (SFAs) (6.5–17.5% of the total fatty acids), mono-unsaturated fatty acids (MUFAs) (16.5–33% of the total fatty acids) and bacterial fatty acids (~0.6–5.3% of total fatty acids) followed an inverse pattern to PUFAs, with higher values in summer months. Main fatty alcohols included 16:0, 18:0, 20:1(n-9) and 22:1(n-11).
The PUFAs 22:6(n-3), 20:5(n-3); the MUFAs 18:1(n-9), 16:1(n-7) and the SFA 16:0 were the major lipid components in all seasons. Their proportions varied among seasons. Thus, 22:6(n-3) and 20:5(n-3) had greater concentrations in winter through to spring (November to April, under conditions of water column homogeneity), while 18:1(n-9), 16:0 and 16:1(n-7) had greatest values in summer. Very high variability between specimens sampled in the same season was observed for all seasons and was particularly high in individuals collected in summer. These seasonal differences are evident in PCA of the fatty acid composition of B. artica (Figure 1). The first two components explain up to 65.4% of the variance. Although differentiation of seasons is somewhat blurred, a more diverse fatty acid profile distinguished samples collected in summer (June and August) in the first PCA component.

Fig. 1. Principal components analysis on the fatty acid composition of Boreomysis arctica.
The following compounds were found in trace amounts: (i) fatty acids 15:ai, 15:0, 16:i, 17:0, 17:ai, 20:0, 21:0, 22:0, 23:0, 24:0, 16:1, 17:1, 23:1, 24:1, d9-C16:1, d11-C16:1, 18:2(n-6), 20:2(n-6), 18:3(n-3), 22:3(n-3), 18:4(n-3), 20:4(n-3), 22:5(n-6) and 22:4(n-3); (ii) alcohols: 15:0, 24:0; and (iii) sterols: D5,22 C27 sterol, D5, 24 C27 sterol, D7 C27, D7 22 C29, β-sitosterol-TMS ether, and C26.
The ratios 16:1(n-7)/16:0 (range between 0.2 and 1.5) and 20:5(n-3)/ 22:6(n-3) (range between 0.2 and 0.4) were lowest in autumn (November). They were greatest in summer (in June and in the case of 20:5(n-3)/22:6(n-3) also in August), although they were always very variable (Figure 2) probably by high individual variability. Overall the ratio 18:1(n-9)/18:1(n-7) was very high (~>10) except in June 2004. Both maximum and minimum values were evident in summer months (August and June; Figure 2). The PUFA/SFA ratio (range between 1.3 and 48) was lowest in summer (August and June), increasing from August to April, reaching the higher value in spring (April 2004; Figure 2), again with a high individual variability.

Fig. 2. Boreomysis arctica: biomarker ratios as a function of season.
Nematoscelis megalops: forty fatty acids were identified for N. megalops (Table 2). PUFAs accounted for ~80% of the fatty acids in N. megalops. PUFAs decreased in autumn (November) and increased afterwards with maximum values in summer (August and June). SFAs (between 3 and 13% of total fatty acids) and MUFAs (~7% of total fatty acids) followed an inverse pattern to PUFAs, with maximum values in winter (November and February, respectively). Bacterial fatty acids were very low (<1% of total fatty acids) with lowest values in summer (August and June). Main fatty alcohols included 16:0, 18:1(n-9), 20:1(n-9) and 22:1(n-11).
The PUFAs 22:6(n-3), 20:5(n-3), the MUFA 18:1(n-9) and the SFA 16:0 and 14:0 fatty acids were the major components in all seasons. Their proportions varied among seasons. There were greater concentrations of 22:6(n-3) in spring (April) and summer (August and June), whereas t 20:5(n-3) were highest and most variable in August. The 14:0 and 16:0 fatty acids were greatest in autumn (November) and winter (February) respectively, while the 18:1(n-9) showed low concentrations in autumn (November). Results of the PCA differentiated well between seasons (the first two components explained up to 76.8% of the variance) (Figure 3). The first component differentiated individuals from summer (August and June) and autumn (November) distinguished by the contribution of C14:0; while C16:0 discriminated samples from February in the second component.

Fig. 3. Principal components analysis on the fatty acid composition of Nematoscelis megalops.
Other compounds found in trace amounts in Nematoscelis megalops were: fatty acids: 15:i, 15:0, 16:i, 17:i, 17:ai, 18:0, 20:0, 22:0, 24:0, 15:1, 16:1(n-7)i or (n-13), 16:1(n-5), 17:1, 19:1, 20:1(n-9), 20:1(n-11), 24:1, 20:2(n-6), 22:2(n-6), 18:3(n-3), 20:3(n-6), 22:3(n-3), 21:5(n-3) and C26 PUFA; and alcohols: 15:0, 17:0, 22:0, 24:0 and 26:0; sterols: D5,22 C27 sterol, D5, 24 C27 sterol and D7 C27.
The ratio 16:1(n-7)/16:0 (range between 0.15 and 1.04) was higher in autumn (November) and June (Figure 4) with minimal values in February–April. The ratio 20:5(n-3)/22:6(n-3), ranging between 0.3 and 0.6, showed no particular pattern, and higher values were observed in winter (February). The ratio 18:1(n-9)/18:1(n-7) (range between 4.1 and 7.4) was much lower than in B. arctica. Higher ratios were observed at the end of the summer and autumn (August and November; Figure 4) significantly different from values in the period February to June. The ratio PUFA/SFA (range between 4.5 and 52.5) was unusually high in summer months (August and June; Figure 4), increasing form February to June. In spite of some variability, this was on average lower than that found for B. arctica. Also N. megalops marked some temporal trends (e.g. in the ratio 18:1(n-9)/18:1(n-7) and in PCA results) less evident in B. arctica.

Fig. 4. Biomarker ratios in Nematoscelis megalops as a function of season.
DISCUSSION
This is the first study performed on the seasonal dynamics of fatty acids in deep-sea species, the first also for species dwelling in the BBL (hyperbenthic/near bottom zooplankton species). Six major fatty acids characterized the fatty acid profile of the mysid Boreomysis arctica and the euphasiid Nematoscelis megalops; namely the PUFAs 22:6(n-3), 20:5(n-3), the MUFAs 18:1(n-9), 16:1(n-7) and the SFAs 16:0 and 14:0. This combination of phytoplankton (20:5(n-3) indicates consumption of diatoms: Kharlamenko et al., Reference Kharlamenko, Zhukova, Khotimchenko, Svetashev and Kamenev1995; 22:6(n-3) indicates consumption of dinoflagellates: Falk-Petersen et al., Reference Falk-Petersen, Hagen, Kattner, Clarke and Sargent2000) and metazoan (18:1(n-9) indicates carnivorous habits: Cook et al., Reference Cook, Bell, Black and Kelly2000) markers indicates an omnivorous–carnivorous feeding for these species. Other indicators of a carnivorous diet include the 20:1(n-9) and 22:1(n-11) fatty alcohols, which were amongst the dominant alcohols present in the overall composition of B. arctica and N. megalops. Long chain alcohols are major components of wax ester from calanoid copepods, consumed by both species based on gut contents (Casanova, Reference Casanova1974; Cartes & Sorbe, 1995). The ratio PUFA/SFA and the ratio 18:1(n-9)/18:1(n-7), which mainly indicate a predatory or omnivorous feeding, also showed high values in both species, particularly the ratio 18:1(n-9)/18:1(n-7) in the case of B. arctica. Similar high values for the ratio 18:1(n-9)/18:1(n-7) (between 16 and 18) have only been reported for scavenger (carnivorous) amphipods (Bühring & Christiansen, Reference Bühring and Christiansen2001).
The results obtained from the fatty acid biomarkers are consistent with data from gut contents reported both for B. arctica and N. megalops. The gut contents of B. arctica (after analysis at light microscope: Cartes & Sorbe, Reference Cartes and Sorbe1998) consisted of crustacean remains (mainly calanoid copepods) and dinoflagellates as dominant food items. Other zooplankton items (e.g. tintinnids and cnidarians) were also found in B. arctica guts (Cartes & Sorbe, Reference Cartes and Sorbe1998). Therefore, the high levels of the PUFA/SFA and those of the ratio 18:1(n-9)/18:1(n-7) might indicate feeding on animal prey other than copepods. Overall, B. arctica showed a more varied fatty acid profile than N. megalops, which suggests that it feeds on a wider range of food sources. This species can be described as a facultative detritivore (Mauchline, Reference Mauchline1980; Cartes & Sorbe, Reference Cartes and Sorbe1998). Boreomysis arctica also showed a high variability in fatty acid ratios, pointing to differences in the diet among individuals. It was usual within a same sample to find animals with guts full of crustacean remains while others ingested phytodetritus (Cartes & Maynou, Reference Cartes and Maynou2001).
In contrast to B. arctica, the fatty acid profile of the euphasiid N. megalops was mainly dominated by the PUFAs 22:6(n-3) and 20:5(n-3). These fatty acids are important membrane components that dominate the phospholipid fraction (Sargent & Henderson, Reference Sargent, Henderson, Corner and O'Hara1986; Albers et al., Reference Albers, Kattner and Hagen1996; Lee et al., Reference Lee, Hagen and Kattner2006). Their dominance points to a low dependence on storage lipids. This is consistent with the low overall amounts of lipids reported for this species (~10%). Both PUFAs are essential nutrients for marine invertebrates and they are considered to derive only from phytoplankton (i.e. flagellates and diatoms respectively) (Sargent et al., Reference Sargent, Parkes, Mueller-Harvey, Henderson and Sleigh1987; Brett & Müller-Navarra, Reference Brett and Müller-Navarra1997; Graeve et al., Reference Graeve, Kattner and Hagen1994a). Although the high amounts found in all seasons might be an indication of feeding on phytoplankton, the high concentration of 22:6(n-3) and 20:5(n-3) is also characteristic of an omnivorous–carnivorous feeding mode as it has been found for Euphausia spp. (Saito et al., Reference Saito, Kotani, Keriko, Xue, Taki, Ishihara, Ueda and Miyata2002 and references therein). Cripps & Atkinson (Reference Cripps and Atkinson2000) provided evidence for the preferential accumulation of 20:5(n-3) and 22:6(n-3) in Euphausia superba when feeding on copepods in experimental conditions, whilst Saito et al. (Reference Saito, Kotani, Keriko, Xue, Taki, Ishihara, Ueda and Miyata2002) suggested de novo synthesis or selective accumulation of 20:6(n-3) for Euphausia spp. However, this dominance of structural fatty acids might also be a characteristic of carnivorous species in oligotrophic and temperate areas (Mayzaud et al., Reference Mayzaud, Boutoute and Alonzo2003). Similar results in the high dominance of 22:6(n-3) indicative of feeding on dinoflagellates were found for Meganyctiphanes norvegica in the Mediterranean Sea (Virtue et al., Reference Virtue, Mayzaud, Nichols and Albessard2000). The low diatom ratios (16:1(n-7)/16:0 and 20:5(n-3)/22:6(n-3)) and the relatively high 18:1(n-9)/18:1(n-7) and PUFA/SFA ratios found in N. megalops are not consistent with a diet based mainly on dinoflagellates. In effect, this species is described as a carnivorous species feeding on copepods, dinoflagellates and tintinnids (e.g. in the Mediterranean: Casanova, Reference Casanova1974; other areas: Barange et al., 1991; Gurney et al., Reference Gurney, Froneman, Pakhomov and McQuaid2001). This is consistent with high percentage of the 18:1(n-9) fatty acid and high 18:1(n-9)/18:1(n-7), with 20:1(n-9) and 22:1(n-11) fatty alcohols and PUFA/SFA ratios, indicating therefore a carnivorous feeding mode. The dominant near bottom copepod in the Balearic Basin is the filter feeder Calanus helgolandicus (authors' unpublished data). As large (adult) N. megalops do not migrate up to the water column in the western Mediterranean (Casanova, Reference Casanova1974), probably phytoplankton biomarkers are found in N. megalops by daily migration of its prey close to the sea bottom.
Seasonal variations
Seasonal changes in the major fatty acids and lipid ratios of B. arctica suggest a more diverse diet during summer. Thus, the amounts of the dominant 22:6(n-3) and 20:5(n-3) showed lower values in this season, whereas the levels of 16:1(n-7), 18:1(n-9) and 16:0 increased during this period together with higher proportions of bacterial fatty acids and alcohols (TFAlc higher August 2003 and June 2004). These data suggest more varied feeding strategies, both detritivory and carnivory, in summer. This is also in agreement with findings by Cartes & Sorbe (Reference Cartes and Sorbe1998) who reported higher phytodetritus consumption in July, and it was consistent with the dominance of dinoflagellates in phytoplankton assemblages off the Catalan coasts (in the deep chlorophyll maximum; Estrada et al., Reference Estrada, Vives, Alcaraz and Margalef1985), together with copepod consumption. The seasonal changes in the fatty acid composition also coincide with lower lipid contents of the individuals examined, while higher lipid contents and higher stomach fullness for this species were observed in spring (Cartes & Sorbe, Reference Cartes and Sorbe1998). In summer the flow of organic matter input to the western Mediterranean decreases (Miquel et al., Reference Miquel, Fowler, La Rosa and Buat-Menard1994). Therefore, lower lipid contents and higher diversity in the fatty acid composition might also be related to low food availability.
In N. megalops, despite the overall dominance of 22:6(n-3) and 20:5(n-3) in its fatty acid profile, a variety of fatty acids were observed in autumn and winter. Thus, higher percentages of short chain saturated fatty acids (14:0 and 16:0), unsaturated fatty acids 16:1(n-7) and 18:1(n-7), which are markers for diatoms, were found in those periods. In B. artica, these changes might also be related to the seasonal shift in food availability. Thus, seasonal trends in maximum primary production occur at the end of the winter and beginning of spring in the study area (Cartes et al., Reference Cartes, Madurell, Fanelli and López-Jurado2008). However, since a preferential accumulation or de novo synthesis of 20:5(n-3) and 22:6(n-3) is probable for this species, the higher percentages of these fatty acids could also be due to elongation and desaturation processes of fatty acids (Hagen & Kattner, Reference Hagen and Kattner1998; Virtue et al., Reference Virtue, Mayzaud, Nichols and Albessard2000), playing important roles in fatty acid accumulation.
Seasonal changes in biomarker ratios (18:1(n-9)/18:1(n-7) and PUFA/SFA) are consistent with changes in the fatty acid composition for both species. However, high values of both ratios are associated with poor feeding conditions and are dependent on the lipid content (e.g. Auel et al., Reference Auel, Harjes, da Rocha, Stübing and Hagen2002; Stübing & Hagen, Reference Stübing and Hagen2003; Nyssen et al., Reference Nyssen, Brey, Dauby and Graeve2005) and in turn are associated with physiological–reproductive stages. Therefore, depletion of total lipids in B. artica could vary depending on the biological condition of specimens (i.e. lower lipid content after reproduction) as observed in mature post-spawned males and females of the mysid Mysis mixta and the amphipod Acanthostepheia malmgremi (Richoux et al., Reference Richoux, Deibel, Thompson and Parrish2005). In other cases lipids may increase in pre-spawning females with full ovaries. Although mature specimens and recruits can be found all year round, B. arctica is a bivoltine species with peaks of recruits in early spring (February–March) and autumn (October–December). The highest proportion of mature, oostegal females and males occurs in summer (July; Cartes & Sorbe, Reference Cartes and Sorbe1998). Oostegal females often have embryos in oostegal bags and empty gonads, which could explain the lower lipid content found. In agreement with a sign of high feeding conditions N. megalops showed lower 18:1(n-9)/18:1(n-7) and PUFA/SFA in February, when large pre-reproductive specimens (Cl > 4 mm) were found close to the bottom (Cartes et al., unpublished) immediately after the peak of spawning specimens (Casanova, Reference Casanova1974). Nematoscelis megalops did not show differences in the total lipid contents throughout the whole period studied. However, some bias in these results might have been derived from the smaller mean size of individuals analysed in summer, when size-classes between 2.5 and 3.5 mm CL were dominant in near-bottom populations (Cartes et al., Reference Cartes, Fanelli, Papiol and Zucca2010). Also, N. megalops is a planktotrophic species and has a peak of reproduction from March to May (Casanova, Reference Casanova1974). The eggs released by females in this period may decrease the amount of body lipids in reproductive periods. Among other crustaceans (e.g. two deep-sea natantian decapods: Pontocaris sp. and Solenocera sp.; Jeffreys et al., Reference Jeffreys, Wolff and Murty2009; the caprellid amphipod Caprella mutica; Cook et al., Reference Cook, Shucksmith, Orr, Ashton and Berge2010) the most common ratios used in lipid studies (e.g. 18:1(n-9)/18:1(n-7), PUFA/SFA) were not calculated, and no temporal data were presented, so comparisons were not possible. Among other benthic taxa varying proportions of PUFAs related to the reproductive strategy of species have been reported for deep-sea holothurians (Hudson et al., Reference Hudson, Pond, Billett, Tyler, Lampitt and Wolff2004), where preferential accumulation of PUFAs was observed for species producing small eggs with a seasonal reproductive cycle, while species with direct development showed no change in their proportion of PUFAs.
ACKNOWLEDGEMENTS
Thanks to all participants in the cruises IDEA (REN2002-04535-C01-02/MAR), to the crew of the RV ‘Fco. de Paula Navarro’, and to J.L. López-Jurado and E. Massutí for on-board assistance. Thanks also to V. Papiol for her laboratory assistance. Special acknowledgements to Dr T. Madurell for her help in the research performing lipid analyses, also to the National Oceanography Centre, Southampton, NOCS/OBE, especially to Dr D. Billett, for the scientific support given to the Marie Curie Fellowship MEIF-CT-2005-010430 co-supervised by the author. Analyses were performed at the University of Liverpool; thanks are extended to the Department of Earth and Ocean Sciences, both to Dr G. Wolff and collaborators for invaluable technical support for lipid analyses. The last three coallegues above mentioned were invited to particpate in the authorship of this article.


