INTRODUCTION
As the primary producers of marine ecosystems, i.e. phytoplanktonic organisms, are sensitive to water pollution and hydrological conditions, they have been considered as an indicator of water quality. Many environmental variables influence the distribution of the phytoplankton community. The oil contamination imposes various effects on the phytoplankton (Kühnhold, Reference Kühnhold1978; Lännergren, Reference Lännergren1978; Johansson et al., Reference Johansson, Larsson and Boehm1980; Dahl et al., Reference Dahl, Laake, Tjessem, Eberlein and Boehle1983; Goutz et al., Reference Goutz, Berland, Leveau and Bertrand1984; Ostgaard et al., Reference Ostgaard, Eide and Jensen1984; Tomajka, Reference Tomajka1985; Skjoldal & Thingstad, Reference Skjoldal, Thingstad, Kuiper and van den Brink1987; Batten et al., Reference Batten, Allen and Wotton1998; Varela et al., Reference Varela, Bode, Lorenzo, Álvarez-Ossorio, Miranda, Patrocinio, Anadón, Viesca, Rodríguez, Valdés, Cabal, Urritia, García-Soto, Rodríguez, Álvarez-Salgado and Groom2006). The effect of oil spill on the marine life have been proved by tankers such as the ‘Torrey Canyon’ (Nelson-Smith, Reference Nelson-Smith, Russell and Yonge1970), the ‘Santa Barbara’ (Straughan, Reference Straughan and Ruivo1972), the ‘Argo Merchant’ (Kühnhold, Reference Kühnhold1978) the ‘Amoco Cadiz’ (Marchand, Reference Marchand1980; Dauvin, Reference Dauvin1998), the ‘Tsesis’ (Johansson et al., Reference Johansson, Larsson and Boehm1980), the ‘Sea Empress’ (Batten et al., Reference Batten, Allen and Wotton1998) and the ‘Exxon Valdez’ (Rice et al., Reference Rice, Spies, Wolfe and Wright1996; Boehm et al., Reference Boehm, Douglas, Burns, Mankiewicz, Page and Bence1997).
Some of the researchers reported an increase in phytoplankton biomass in the oil spill area (e.g. Dahl et al., Reference Dahl, Laake, Tjessem, Eberlein and Boehle1983; Goutz et al., Reference Goutz, Berland, Leveau and Bertrand1984; Gray et al., Reference Gray, Clarke, Warwick and Hobbs1990; Batten et al., Reference Batten, Allen and Wotton1998), but it was not clearly demonstrated whether this was caused by an increase in photosynthetic activity or a decrease in zooplankton grazing due to the oil (Lännergren, Reference Lännergren1978; Johansson et al., Reference Johansson, Larsson and Boehm1980). Varela et al. (Reference Varela, Bode, Lorenzo, Álvarez-Ossorio, Miranda, Patrocinio, Anadón, Viesca, Rodríguez, Valdés, Cabal, Urritia, García-Soto, Rodríguez, Álvarez-Salgado and Groom2006) emphasized the importance of the natural variability on the plankton and stated that the effect of oil decreased if the oil spill occurred in winter. Further, some authors reported that the petroleum hydrocarbons caused a decrease in photosynthesis up to 36–40% (Goutz et al., Reference Goutz, Berland, Leveau and Bertrand1984; Tomajka, Reference Tomajka1985), stress occurred an increase in biomass and some changes in species composition (Elmgren et al., Reference Elmgren, Vargo, Grassle, Grassle, Heinle, Langiois, Vargo and Giesey1980) and oil spills inhibited the growth of phytoplankton (Castro & Huber, Reference Castro and Huber2000). However, Gordon & Prouse (Reference Gordon and Prouse1973) mentioned that the degree of inhibition was related to the type and amount of oil. According to Dunstan et al. (Reference Dunstan, Atkinson and Natoli1975), the low-molecular weight aromatic hydrocarbon compounds could be the growth stimulator of particular species and a major growth inhibitor at high concentrations.
The waterway between the Mediterranean and Black Sea, including the Strait of Istanbul (Bosphorus), Sea of Marmara and the Strait of Çanakkale (Dardanelles) has an intense maritime traffic. The ship-originated pollution caused by mainly dense navigation and maritime accidents is one of the most important problems in this marine environment and the surrounding coastal areas (Doğan & Burak, Reference Doğan and Burak2007). In winter this region is affected by continuous passage of cyclonic systems with typical southerly winds posing the highest pollution risk along the northern Marmara coasts (Alpar et al., Reference Alpar, Yüce and Türker2003).
The accident of the Russian oil tanker ‘Volgoneft-248’ was caused by a strong southerly gale which broke the ship into two parts, approximately 1 km off the coasts of Florya (north-eastern Sea of Marmara) on 29 December 1999. The bow part sank at once and the aft side of the vessel drifted and grounded at shore, while the ‘Volgoneft-248’ was carrying 4365 tons of heavy fuel oil, and 1579 tons of fuel oil was spilled into the Sea of Marmara. The spilt oil was carried ashore by the strong south-westerly winds and waves within a very short time of the accident. The oil was 2–10 m wide and 5 cm thick. A great amount of fuel oil drifted on the shore covered up with sand and then spread in sheets over the sea bottom. Barriers were laid around the vessel in order to avoid leakage of the remaining fuel oil. The clean-up operations were carried out rapidly to remove environmental pollution. The oil was removed and delivered to the receivers. Most of the oil in the sunken bow tanks was recovered in February 2000 (Alpar & Ünlü, Reference Alpar and Ünlü2007). Seasonal phytoplankton distribution on the north-eastern coast of the Sea of Marmara was studied by several researchers (e.g. Uysal, Reference Uysal1996; Balkıs, Reference Balkıs2003, Reference Balkıs2004; Okuş & Taş, Reference Okuş and Taş2007; Deniz & Taş, Reference Deniz and Taş2009). This work has a significant importance because the phytoplankton community has been investigated following the oil spill.
The aim of this study is to evaluate the effect of the ‘Volgoneft-248’ oil spill on the local phytoplankton community. Firstly, we assume that the low phytoplankton abundance in the affected area by oil spill might be related to the effect of oil on phytoplankton. Also, the effect of oil on phytoplankton might be limited due to the natural hydrological conditions in winter. Secondly, the sensitivity of phytoplankton groups to the high oil concentrations may indicate some differences.
MATERIALS AND METHODS
The study area and sampling design
The study area was located at the north-east margin of the Sea of Marmara; including the entire region affected by the ‘Volgoneft-248’ oil spill offshore Florya. This region was connected to Küçükçekmece Lake with a channel. The sampling depths at Stations A5 and A5C were about 6 m and 78 m, respectively. The coasts of the accident area were composed of beaches, restaurants and recreational spots. The study area consisted of 7 sampling stations. Although the sampling regions presented some geographical differences, the nearest stations to the current study area were chosen for comparison (Figure 1).
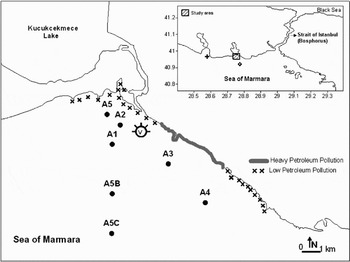
Fig. 1. The study area. Symbols used: shipwreck area (V); seawater sampling stations (A); the sampling stations from the previous studies (∀,%) (″,%).
Temperature and salinity were measured by the SBE-9 CTD system. Current speed and directions were measured with RDI broad band ADCP (150 kHz). Niskin bottles (5 l) were used for all seawater samples. Secchi depth was measured using a standard Secchi disc. The wind speed and direction data were provided from Kandilli Meteorological Station. The sampling periods were carried out depending on the stages of the clean-up operations in the first year and monitoring samples were collected in winter and summer of the second year. During the study period, 7 sampling periods were planned from January 2000 to January 2002. The first seawater samples were taken a few hours after the accident (30 December 1999). Unfortunately, these samples could not be examined for phytoplankton analysis due to very intense oil contamination. Therefore, first seawater samples for phytoplankton analysis were taken on 3 January 2000. The sampling stations were planned as the surface current system and hydrographical structure of this region. At the beginning of the current study, the chlorophyll-a and nutrient analyses could not be performed because the water column contained a very high contamination level of the oil as it was affected severely by the continuing clean-up operations.
Seawater analysis
The unfiltered seawater samples were analysed by UV-fluorescence for dissolved/dispersed hydrocarbons according to the MARPOLMON protocol (UNESCO, 1984). To determine the pollution belonging to the ‘Volgoneft-248’, approximately 2.8 l seawater was extracted 100 ml dichloromethane (DCM, Lab-Scan, and HPLC Grade) for three times to the separation funnel. Phases of separated DCM were put together and onto some waterless sodium sulphate added, filtered and distilled at 36°C, 310/360 nm (ex/em) was read in UVF and the amount of fuel oil was determined from the standard curve belonging to the fuel oil of ‘Volgoneft-248’. A standard curve drawn by the petroleum of the tanker, which had the accident, was used. Thus, standard curve was drawn according to the fuel-oil sample taken from ‘Volgoneft-248’. The sample was resolved in 0.005, 0.01, 0.02, 0.03, 0.04 and 0.05 µg/ml concentrations in hexane. The standard curve and its equation were obtained depending on the intensities obtained from the ultraviolet fluoro-spectrophotometer (UVF, Shimadzu, RF-1501) 310/360 nm (ex/em).
The phytoplankton water samples were collected from the surface and 10 m depth using Niskin bottles and transferred into 1 l PVC containers. The water samples were immediately fixed with neutralized formaldehyde in the final concentration of 0.4%. Samples were allowed to settle in the laboratory for a week. Then, the water in the upper part was removed by siphoning and concentrated to 100 ml (Sukhanova, Reference Sukhanova and Sournia1978; Throndsen, Reference Throndsen and Sournia1978) and stored in dark coloured glass bottles until microscopic examination. Phytoplankton cells were counted using a Sedgewick–Rafter counting chamber under a light microscope (Guillard, Reference Guillard and Sournia1978). For the species identification the following references were used: Cupp (Reference Cupp1943), Hendey (Reference Hendey1964), Drebes (Reference Drebes1974), Dodge (Reference Dodge1985), Delgado & Fortuna (Reference Delgado and Fortuna1991) and Hasle et al. (Reference Hasle, Syvertsen, Steidinger, Tangen, Throndsen, Heimdal and Tomas1997). In the Appendix, to show the frequency of appearance of phytoplankton species at the different sampling periods, occurrences of each species in the region were categorized using a modified Soyer's frequency index (f%) (Soyer, Reference Soyer1980). Then, the index values were categorized into the frequency groups as the following: R, rare (1–15%); C, common (16–40%); A, abundant (41–60%); and V, very abundant (61–100%).
RESULTS
Hydrological data
The Sea of Marmara which is an inland basin between the Black Sea and the Aegean Sea, has a two-layered structure separated by a strong pycnocline at a depth of about 25 m (Figure 2). The upper layer water comes from the Black Sea having salinity of 18 psu via the Strait of Istanbul (Bosphorus) and its renewal time is estimated as 4–5 months. The lower layer comes from the Aegean Sea having salinity of 38.5 psu via the Strait of Çanakkale (Dardanelles) and its renewal time is about 6–7 years (Ünlüata et al., Reference Ünlüata, Oğuz, Latif, Özsoy and Pratt1990; Beşiktepe et al., Reference Beşiktepe, Sur, Özsoy, Latif, Oğuz and Ünlüata1994). Depending on the temperature and salinity profiles for all CTD casts, there was a two-layered structure in the study region. The upper layer salinity was between 21.5 and 26 psu and its temperature was in the range of 6–26°C during the measurement periods. In general, the temperature and salinity of the lower layer below 40 m depth were 14.5°C and 38.5 psu, respectively, as shown in profiles at Station A5C. On the other hand, the interface was not well established at Station A1 (Figure 2).
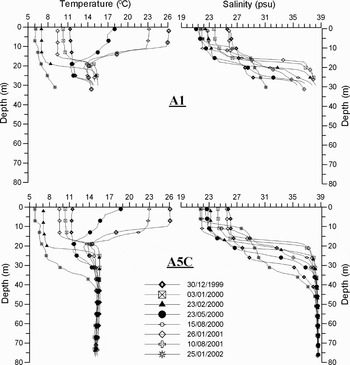
Fig. 2. Temperature and salinity profiles at the coastal (A1) and offshore (A5C) stations.
The physical parameters were related to the environmental and atmospheric conditions. The temperature and salinity values indicated the natural variability depending on the meteorological conditions (Figure 3).
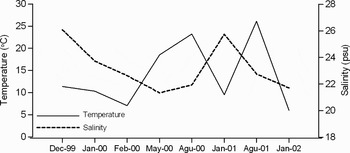
Fig. 3. Mean values of temperature and salinity from the sea surface during the study period.
The atmospheric conditions can easily affect the physical parameters of the upper layer and the depth to the interface layer. On the basis of the rapid changes of wind speed and direction, the temperature and salinity profiles on 30 December 1999 indicated the effects of the southerly winds. After five days, the surface salinity decreased and the interface layer was very thin due to the effects of northerly winds (Figure 4).
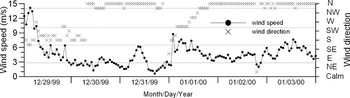
Fig. 4. Wind direction and speed throughout the 6 days following the ‘Volgoneft-248’ oil spill.
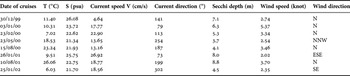
Depending on the atmospheric conditions, hydrographic structure in the Sea of Marmara can change within several days. The surface salinity is higher in winter when the southerly winds cause mixing of water layers along the northern coasts of the Sea of Marmara. In summer, surface salinity decreases due to the influx of fresh water from the Black Sea via the Strait of Istanbul. The changes in current velocity and directions also indicate the variability of the atmospheric conditions. The dynamic characteristics of the water masses in the affected area can easily change during the continuous passage of cyclonic systems in winter (Alpar et al., Reference Alpar, Yüce and Türker2003). The temporal variations of the dynamic structure at the affected area can be seen clearly in Table 1. The calculated mean values from the surface data in each station are given in Table 1. Meanwhile, the Secchi disc depth measurements showed the variation in the range of 3.7–8.8 m (Table 1).
Table 1. Mean surface values of selected physical variables during the study period.
Total petroleum hydrocarbons (TPH)
At the time of the accident the oil concentration was measured at the highest level (2.17 mg/l) at Station A5. Five days later from the accident, the oil concentration was measured as 88.5 µg l−1 at the surface offshore Florya (A1). The oil concentrations at the surface and 10 m depth were in the ranges 0.11–121.5 µg l−1 and 0.11–88.5 µg l−1, respectively during the study period. The oil concentrations gradually decreased within one year in accordance with the cleaning operation. The petroleum settled to the sea bottom was disturbed and surface water contamination increased during the cleaning operations carried out in August 2001. Thus, in this period of time, the oil concentrations at the surface reached to 121.5 µg l−1 at Station A5C. After one year, the oil levels in the seawater decreased to their normal values (0.3–1.5 µg l−1) following the clean-up operations.
Phytoplankton succession
In the phytoplankton abundance some temporal variation was observed in accordance with the regional characteristics. The abundance of phytoplankton varied from 2 × 10³ to 195 × 103 cells l−1 at the surface during the study period. The cell density was mostly as low as in the previous studies carried out in the same region except for January 2002. In January 2000, when the phytoplankton density was poor, there were not any diatoms while the dinoflagellates remained. In February 2000 an increase in diatoms was observed and their abundance reached to 38 × 103 cells l−1, and they dominated over the phytoplankton (84%). A significant increase in the dinoflagellates was detected in May 2000 caused by Prorocentrum micans and its cell density reached to 70 × 103 cells l−1. In August 2000, prokaryot cyanobacterium Anabaena sp. appeared and its density was calculated as 450 × 103 cells l−1 which formed the dominant species in the whole study area. Eukaryotic forms had a very low abundance in that month. There was low phytoplankton abundance in January 2001 that was similar to January 2000 and the maximum abundance of eukaryotic phytoplankton reached to 29.5 × 10³ cells l−1 at the surface.
During the removing of the bottom settled petroleum by divers in August 2001, the oil concentrations in the water column reached to 121.5 µg l−1 at Station A5C due to mixing of oil in the seawater. Eukaryotic phytoplankton had the lowest abundance (3 × 10³ cells l−1) at this time (Figure 5). In addition, the prokaryot cyanobacterium Anabaena sp. appeared again in August 2001. One of the most important events in this study was a diatom increase observed in January 2002. During this increase, Pseudo-nitzschia spp. reached to 186 × 103 cells l−1 at the surface of Station A5C. This was the highest abundance level detected throughout the study period. The maximum abundance of some important species are given in Table 2. The dinoflagellates were generally more abundant than the diatoms except for the cases in February 2000 and January 2002.
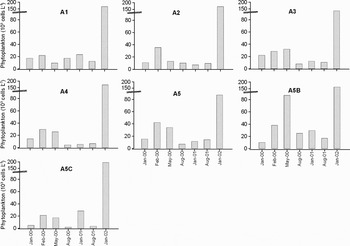
Fig. 5. Spatial and temporal variation of phytoplankton abundance in surface water.
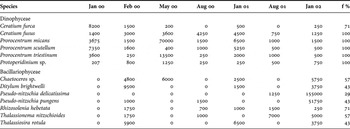
Table 2. Maximum abundances (cells l−1) of the most frequent phytoplankton species at the sea surface and frequency of occurrence (f %) during the study period.
Phytoplankton distributions in the affected area have shown little differences between the near shore and offshore stations. These differences were related to the distance of the stations to the shipwreck. For instance, in the short-distance stations (A1 and A2) the phytoplankton abundance was relatively lower than other stations although they were more near to coast (Figure 5).
The dinoflagellates formed all of the total phytoplankton in the first samples.The most abundant species were Ceratium furca, C. fusus and Prorocentrum spp. while there was no diatom species in the surface water. However, the diatom species composed of 84% of the total phytoplankton in February 2000 (Figure 6) and Ditylum brightwellii, Rhizosolenia setigera and Thalassiosira rotula were the most abundant species. The diatom abundance decreased while the dinoflagellates increased in May 2000. The diatom rate started to increase gradually since August 2000; however, a relative decrease was observed in dinoflagellates. In January 2002, the diatoms dominated in the phytoplankton community.
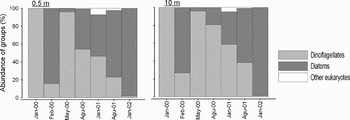
Fig. 6. Change of phytoplankton group composition in terms of abundance.
Species composition
A total of 72 species belonging to 5 taxonomic classes were identified in the seawater samples during the whole study period. Most of these species (93%) were composed of diatoms (35 species) and dinoflagellates (32 species) and the others were cyanobacteria, silicoflagellate and euglenophyte.
The checklist of species and the frequency of occurrence of phytoplankton species are given in the Appendix. The checklist of species explains the frequency of occurrence and temporal distribution of phytoplankton species at the affected area. When the oil concentration was at the highest level, almost no diatoms were detected in the first samples, except Coscinodiscus sp. and Rhizosolenia hebetata. In contrast, the dinoflagellates Ceratium furca, C. fusus, Prorocentrum micans, P. scutellum, P. triestinum and Protoperidinium spp. were frequently observed in and all the study area.
The phytoplankton species composition indicated a rapid change within two months after the oil spill and the number of species increased from 24 taxa to 38 taxa. One of the most important results was the increase in the number of diatom species (from 2 to 21), which constituted 55% of the total number of phytoplankton (Figure 7). The number of dinoflagellate species reached to 21 in May 2000, and this formed 70% of the number of total species. The number of diatom species started to increase gradually from August 2000 to the end of the study period parallel to the decreasing oil concentration. The number of diatom species reached to 24 (63% of total species) in January 2002 (Figure 7). On the contrary to the diatoms, no significant changes were detected in the number of dinoflagellates throughout the sampling periods. They were always observed during the study period, although their numbers were relatively decreased. In January 2002, when the oil concentration decreased remarkably (from 0.11 to 1.34 µg l−1) in the affected area, the number of diatoms increased to 24. As a result, most of the regional characteristic species were found again two months later following the accident. Other phytoplankton groups such as silicoflagellates and euglenophytes were also observed starting from May 2000 (Figure 7).
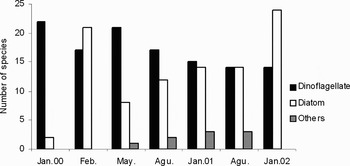
Fig. 7. Temporal variation of phytoplankton species composition.
The Shannon diversity index (H′) values were measured between 0.58 and 3.65 bits in surface and 0.49 and 3.38 bits in 10 m depth. In the first samples following the oil spill, the diversity values (H′) were very low (from 1.92 to 2.36 bits), however H′ rapidly increased and reached to 3.51 bits in February 2000.
DISCUSSION
Many studies generally report that there is no significant effect of oil on the phytoplankton; even our results present many discrepancies. The effects of oil on the marine life have been shown by the previous oil spills by tankers. The dynamic characteristics of water masses in the affected area may help both the dispersion of oil and the ultimate decrease in the effects on plankton. Although the impact of oil spill on the benthic organisms by the settled oil to the sea bottom is well known, it is not easy to explain direct effect of the oil spill on the phytoplankton due to the natural variability of the ecosystem which has a direct effect on the phytoplankton. Some authors (Brown & Searl, Reference Brown and Searl1976; Coates et al., Reference Coates, Connel and Bordero1986) report that the background levels for TPH in the sea are in the range of 0.3–1.5 µg/l. According to Tsvetnenko (Reference Tsvetnenko1998) TPH concentration must not exceed 7 µg/l as the final advisory water quality criterion.
After the ‘Volgoneft-248’ oil spill, the oil concentration in seawater was measured much higher than the accepted values for the water quality criterion and it reached to the highest level (2.17 mg/l) at Station A5. This result is the highest level contamination recorded after the ‘Gotia’ tanker accident according to the data given in the literature (Table 3). The short and medium term effects of oil pollution caused by oil spills on the marine systems have been investigated in various parts of the world and found significant in the eastern Baltic, Black Sea, Sea of Marmara, Bosphorus, English Channel and Alaska. The heavy oil pollution can effect the photosynthesis due to the blocking of sunlight by the oil covering in coastal stations. On the other hand, the oil sedimentation also adversely affected the cell abundance since the phytoplankton settled down together with the tar ball formation. Alpar & Ünlü (Reference Alpar and Ünlü2007) explained how the tar balls could have been stranded on the Florya shoreline. A considerable part of the spilled oil sank to the seafloor and mixed with sand by suspended sediment particles in the water column.
Table 3. The tanker accidents in various parts of the world.

*, mg l−1.
The hydrological conditions in mid-winter (cold water and strong water movements) after the ‘Volgoneft-248’ oil spill limited the development of phytoplankton on a large scale. In the first samples taken following the oil spill, the absence of diatom species in the surface water may indicate the negative effect of oil on diatoms. Two months later from the oil spill diatoms formed the bulk of the phytoplankton community and also the phytoplankton species composition changed rapidly in favour of diatoms. Therefore, diatoms could be more sensitive to oil pollution than the dinoflagellates. Dahl et al. (Reference Dahl, Laake, Tjessem, Eberlein and Boehle1983) verified that crude oil inhibits the growth of diatoms.
The winter diatom increase detected in January 2002 was one of the most important biological events when the oil concentration ranged between 0.19 and 0.44 µg/l. Based on the previous studies (Uysal, Reference Uysal1996; Balkıs, Reference Balkıs2003; Okuş & Taş, Reference Okuş and Taş2007; Deniz & Taş, Reference Deniz and Taş2009) which were carried out on phytoplankton in the Sea of Marmara, the abundance of diatoms was higher during late winter and autumn, and the dinoflagellates especially in late spring and summer. Balkıs (Reference Balkıs2003) and Deniz & Taş (Reference Deniz and Taş2009) reported that the dinoflagellates increased in May as stated in this work. Balkıs (Reference Balkıs2003) revealed that total phytoplankton abundance reached to its maximal level in March and diatoms dominated the phytoplankton community. The winter diatom increase was reported by Okuş & Taş (Reference Okuş and Taş2007) in February. Results obtained on phytoplankton succession were generally similar to the historical findings. The phytoplankton species identified in the current work were available in the checklist of the Sea of Marmara collated by Balkıs (Reference Balkıs2004). The dinoflagellates were observed in the whole study period in the affected area, while the diatoms were not observed in the first sampling (Appendix).
The historical data on phytoplankton composition of the north-eastern Sea of Marmara (Uysal, Reference Uysal1996; Tüfekçi, Reference Tüfekçi2000; Balkıs, Reference Balkıs2003; Deniz & Taş, Reference Deniz and Taş2009) could be useful to evaluate the effects of oil pollution and the surface values of Station A2 were used in comparisons. The low phytoplankton abundance following the oil spill should be considered as the negative effects of oil pollution on phytoplankton compared to the historical data (Figure 8), although the sampling points are not the same. The sampled area in the current study is located at a very shallow region and very close to the connection of Kucukcekmece Lake with the Sea of Marmara (Figure 1). Thus, one can expect a higher productivity in this coastal area as a consequence of freshwater input to the region. The low phytoplankton densities following the oil spill should be taken as an indicator of pollution stress on phytoplankton communities.
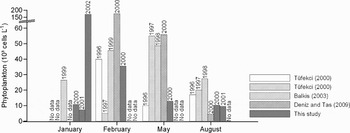
Fig. 8. Comparison of phytoplankton abundance with the historical datasets.
CONCLUSION
The effect of the ‘Volgoneft-248’ oil spill which occurred in winter on the phytoplankton was limited because of the natural meteorological conditions. The oil spill was dispersed rapidly due to the dynamic structure in the water column, consequently, the adverse effect on phytoplankton was relatively decreased. However, the phytoplankton abundance was very low compared to the historical datasets. Low phytoplankton abundance was mostly related to the high hydrocarbon concentrations. This may indicate that there is little adverse effect of oil on phytoplankton. Nevertheless, the absence of diatoms in January 2000 indicates that diatoms might be more sensitive to the oil pollution than the dinoflagellates. Thus, the effect of oil on phytoplankton varies depending on the sensitivity of species and the natural environmental conditions.
ACKNOWLEDGEMENTS
This study is dedicated to Professor Dr Erdoğan Okuş, who passed away on 9 April 2006 following a tragic accident during an oceanographic cruise in the Black Sea. We are grateful to him for his contributions to Turkish marine sciences. We thank Professor Dr Bedri Alpar and Dr Necip Ünlü for correcting the English text and the captain, scientists and technicians of RV ‘ARAR’ for their efforts in the monitoring programme.
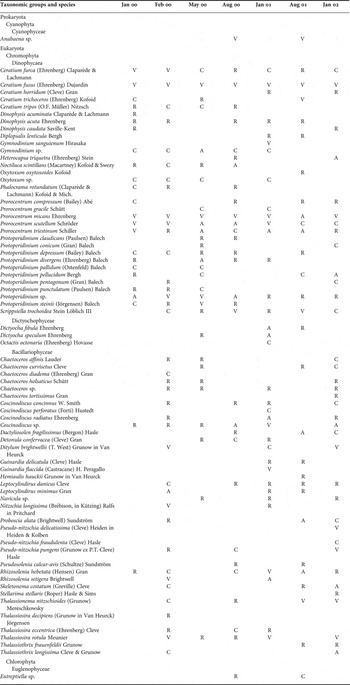
Appendix
List and frequency distribution of phytoplankton (abbreviations used: R, rare, 1–15%; C, common, 16–40%; A, abundant, 41–60%; V, very abundant, 61–100%).