INTRODUCTION
The generally small body-sized gobiid fish of the family Gobiidae constitute the most diverse group of marine teleost fish (Burgess et al., Reference Burgess, Axelrod and Hunziker1990). The gobies mainly inhabit coastal waters worldwide: south-western Australia (Neira & Potter, Reference Neira and Potter1992); south Florida (USA; Sponaugle et al., Reference Sponaugle, Fortuna, Grorud and Lee2003); south-western Europe (Moyano & Hernández-León, Reference Moyano and Hernández-León2009); Portugal (Primo et al., Reference Primo, Azeiteiro, Marques and Pardal2011); South Africa (Wasserman et al., Reference Wasserman, Strydom and Wooldridge2010); and the Persian Gulf (Koochaknejad et al., Reference Koochaknejad, Savari, Dehghan-Madiseh, Eskandari and Sakhaiee2011). Among these, few studies have focused on the larval ecology in Brazilian estuaries. There are more studies about Gobiidae larvae in north-east (e.g. Barletta-Bergan et al., Reference Barletta-Bergan, Barletta and Saint-Paul2002a, Reference Barletta-Bergan, Barletta and Saint-Paulb; Barletta et al., Reference Barletta, Barletta-Bergan, Saint-Paul and Hubold2003; Mafalda Jr et al., Reference Mafalda, Sinque, Muelbert and Souza2004, Reference Mafalda, Souza and Velame2008; Bonecker et al., Reference Bonecker, Castro, Namiki, Bonecker and Barros2007; Sarpedonti et al., Reference Sarpedonti, Anunciação and Isaac2008) than in south-east Brazil (e.g. Castro et al., Reference Castro, Bonecker and Valentin2005; Coser et al., Reference Coser, Pereira and Joyeux2007; Spach et al., Reference Spach, Silva, Merlyn and Santos2010; Bonecker et al., Reference Bonecker, Katsuragawa, Castro, Gomes, Namiki and Zani-Teixeira2012).
The composition of larval fish assemblages vary spatially and temporally because of the behaviour of larvae (Gray & Miskiewicz, Reference Gray and Miskiewicz2000), and due to transport and mixing processes (Muhling et al., Reference Muhling, Beckley, Koslow and Pearce2008). For many marine species, recruitment success requires transport from open ocean to estuarine nursery habitats during early life. Therefore, larvae must adopt strategies to ingress into estuarine nursery grounds (Islam et al., Reference Islam, Hibino and Tanaka2007). Selective tidal-stream transport is a common mechanism used by marine and estuarine organisms for horizontal movement (Forward & Tankersley, Reference Forward and Tankersley2001). The direction of transport is determined by the tidal type during which the organism migrates up into the water column.
Larvae often use active upward or downward swimming and passive sinking coupled with both circadian and tidal rhythms (Tamaki et al., Reference Tamaki, Mandal, Agata, Aoki, Suzuki, Kanehara, Aoshima, Fukuda, Tsukamoto and Yanagi2010). Many species rely on both endogenous rhythms and exogenous cues to precisely time vertical migration (Fortier & Leggett, Reference Fortier and Leggett1983; Sclafani et al., Reference Sclafani, Taggart and Thompson1993). Therefore, fish larvae can be carried upstream by the flood tide and, on the other hand, are able to remain within the estuary, avoiding the current back to the ocean on the ebb tide (Jager, Reference Jager1999). This behaviour can be critical to survival since changes in environmental conditions may affect recruitment success of both estuarine and non-estuarine-dependent species (Parrish et al., Reference Parrish, Nelson and Bakun1981).
The aim of the present study was to describe the spatial and temporal distribution patterns of Gobiidae larvae at a tropical estuarine system in south-east Brazil. The following were the main points addressed: (1) which is the abiotic factor more related to the density distribution?; (2) does larval density differ among stations?; and (3) what are the dynamics of the larval fish of the family Gobiidae in the Macaé River estuary?
MATERIALS AND METHODS
Study area
The Macaé River rises in the Serra de Macaé at Nova Friburgo city and has a drainage basin that covers approximately 1766 km2. Its estuary is classified as bar type, and the main channel is relatively narrow and shallow, approximately 3.0 m (Hora et al., Reference Hora, Massera and Porto2001). This region has semi-diurnal tides ranging around 1.0 m for spring tides and 0.5 m for neap tides. The region's climate is always humid mesothermal with 1500–2000 mm average annual rainfall. The rainy season (from November to April) is characterized by overflowing rivers and the dry season extends from May to October (Beltrão, Reference Beltrão2003).
Since the 1970s, when the exploration of oil and gas in the Campos Basin started, the Macaé population has increased 4.4-fold, from 47,220 in 1970 to 206,728 in 2010 (IBGE, 2012). This growth in a short period of time increased the outflow of nutrients and metals in the Macaé River basin. Anthropogenic sources are responsible for most emissions to the Macaé River (Molisani et al., Reference Molisani, Esteves, Lacerda and Rezende2012).
Field methodology
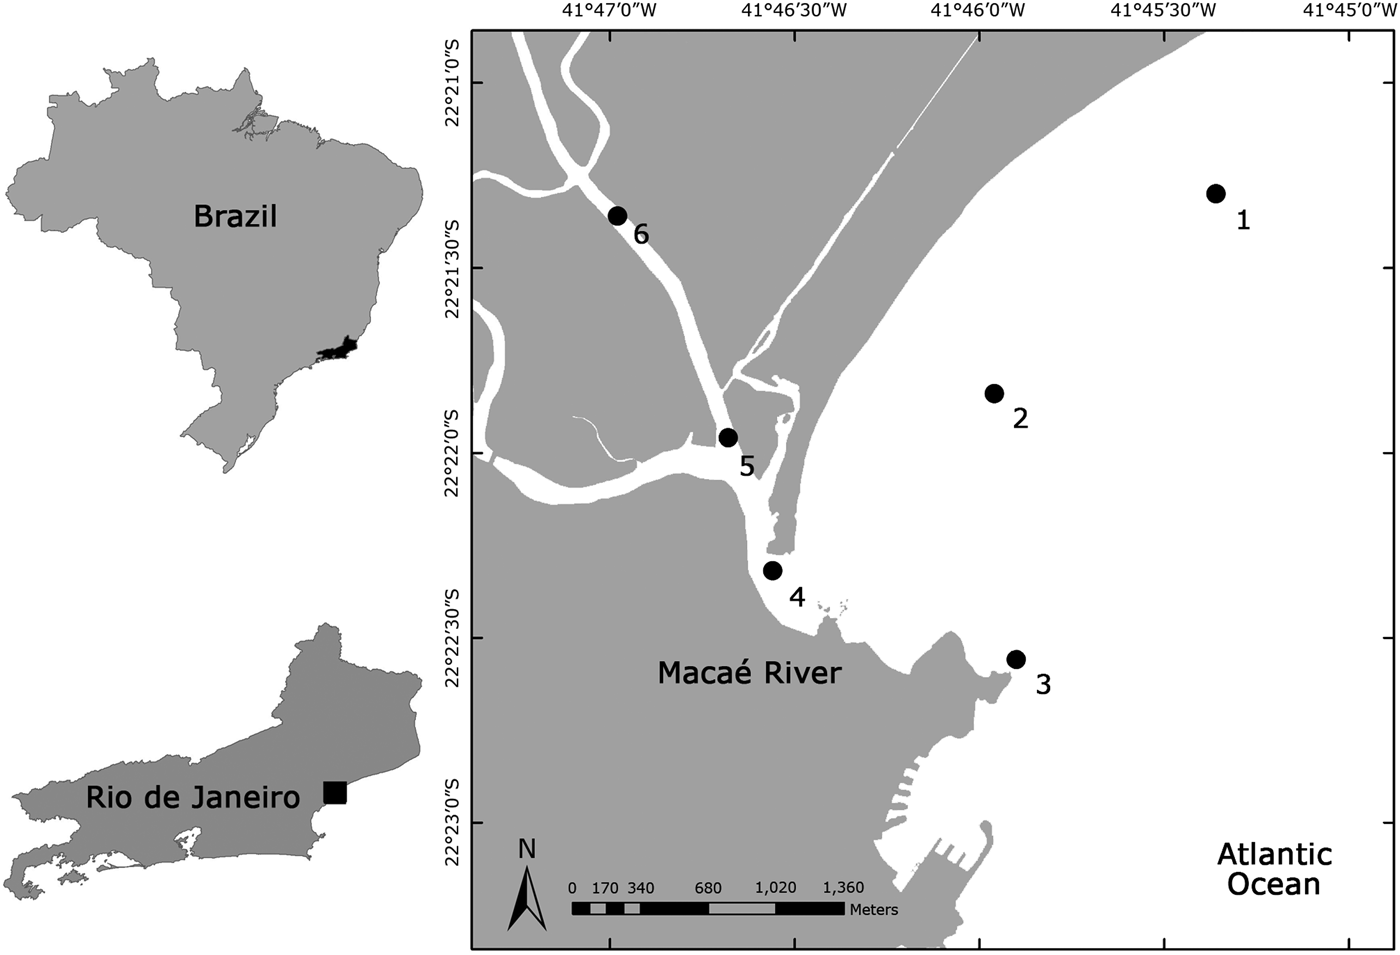
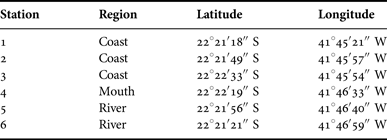
Sampling was carried out in the rainy (March 2006 and February 2007) and dry seasons (July and October 2006), over two consecutive nights, in the flood and ebb tides. Six sampling stations were positioned in the study area: three located in the adjacent coastal area, one in the estuary mouth and two inside the Macaé River (Figure 1; Table 1).

Fig. 1. Macaé River estuary and location of the six sampling stations where goby larvae were collected.
Table 1. General data and geographical coordinates of the six sampling stations located in Macaé River estuary and adjacent coastal region.

Plankton samples were obtained by oblique hauls for about five minutes using a bongo net (0.6 m diameter, 2.5 m length, 330 µm mesh-size), according to the technique described by Smith & Richardson (Reference Smith and Richardson1977). Samples from each net were called R1 and R2. Two flowmeters (General Oceanics®) were used to estimate the volume of water filtered. Geographical location of the sampling stations was provided by a GARMIN 12 XL GPS. Immediately after collection, the samples were fixed in formaldehyde solution diluted to 4% in local water. Surface and bottom temperature and salinity were obtained with a thermosalinometer (LabComp). Surface water samples were obtained for analysis of chlorophyll-a using a van Dorn bottle. The precipitation data were provided by the National Water Agency hydrologic system, Brazil and were measured at Gaudinópolis Station (22°22′09″S 42°22′46″W).
Laboratory methodology
LARVAL IDENTIFICATION
Larvae were sorted from all samples and after the identification were preserved in 70% ethanol. Initially larvae were identified to family level and subsequently to lower taxonomic levels according to the criteria of Wyanski & Targett (Reference Wyanski and Targett2000), Baldwin & Smith (Reference Baldwin and Smith2003), Yeung & Ruple (Reference Yeung, Ruple and Richards2006) and Fahay (Reference Fahay2007).
STATISTICAL ANALYSES
The two samples collected with bongo net were considered replicates and we used the mean values and the standard deviations of larval density. Densities were previously transformed to log (x + 1) to reduce the heterogeneity of the data (Peters, Reference Peters1986). Significant differences were considered when P < 0.05. The normality and homogeneity of variances were tested using the Levene and Shapiro–Wilk tests, respectively, with the statistical program STATISTICA® 6.0. As the Levene test was significant (P < 0.05), the spatial variation of larval fish density was analysed with a non-parametric test (Kruskal–Wallis) and tidal and seasonal variations were verified with the Mann–Whitney test.
To verify the similarity among taxa, we performed a cluster analysis using the program PRIMER 6. Unpaired Weight Group Average was used as the aggregation algorithm on the matrix of pairwise Euclidean distances.
To examine the relationship of taxa with abiotic factors canonical correspondence analysis (CCA) was performed with the program PC-ORD 4.0®. The data matrix was generated considering three abiotic variables (temperature, salinity and chlorophyll-a) of 68 samples. The null densities of fish larvae were disregarded in this test. The Monte Carlo test (Ter Braak & Smilaeur, Reference Ter Braak and Smilauer2002) was conducted to test the significance of the correlation between taxa and these abiotic variables. Inter-set correlation coefficients were used to assess the importance of the environmental variables, and when inter-set ≥ |0.4|, variables were considered to be biologically important (Rakocinski et al., Reference Rakocinski, Lyczkowski-Shultz and Richardson1996).
RESULTS
Abiotic factors
TEMPERATURE
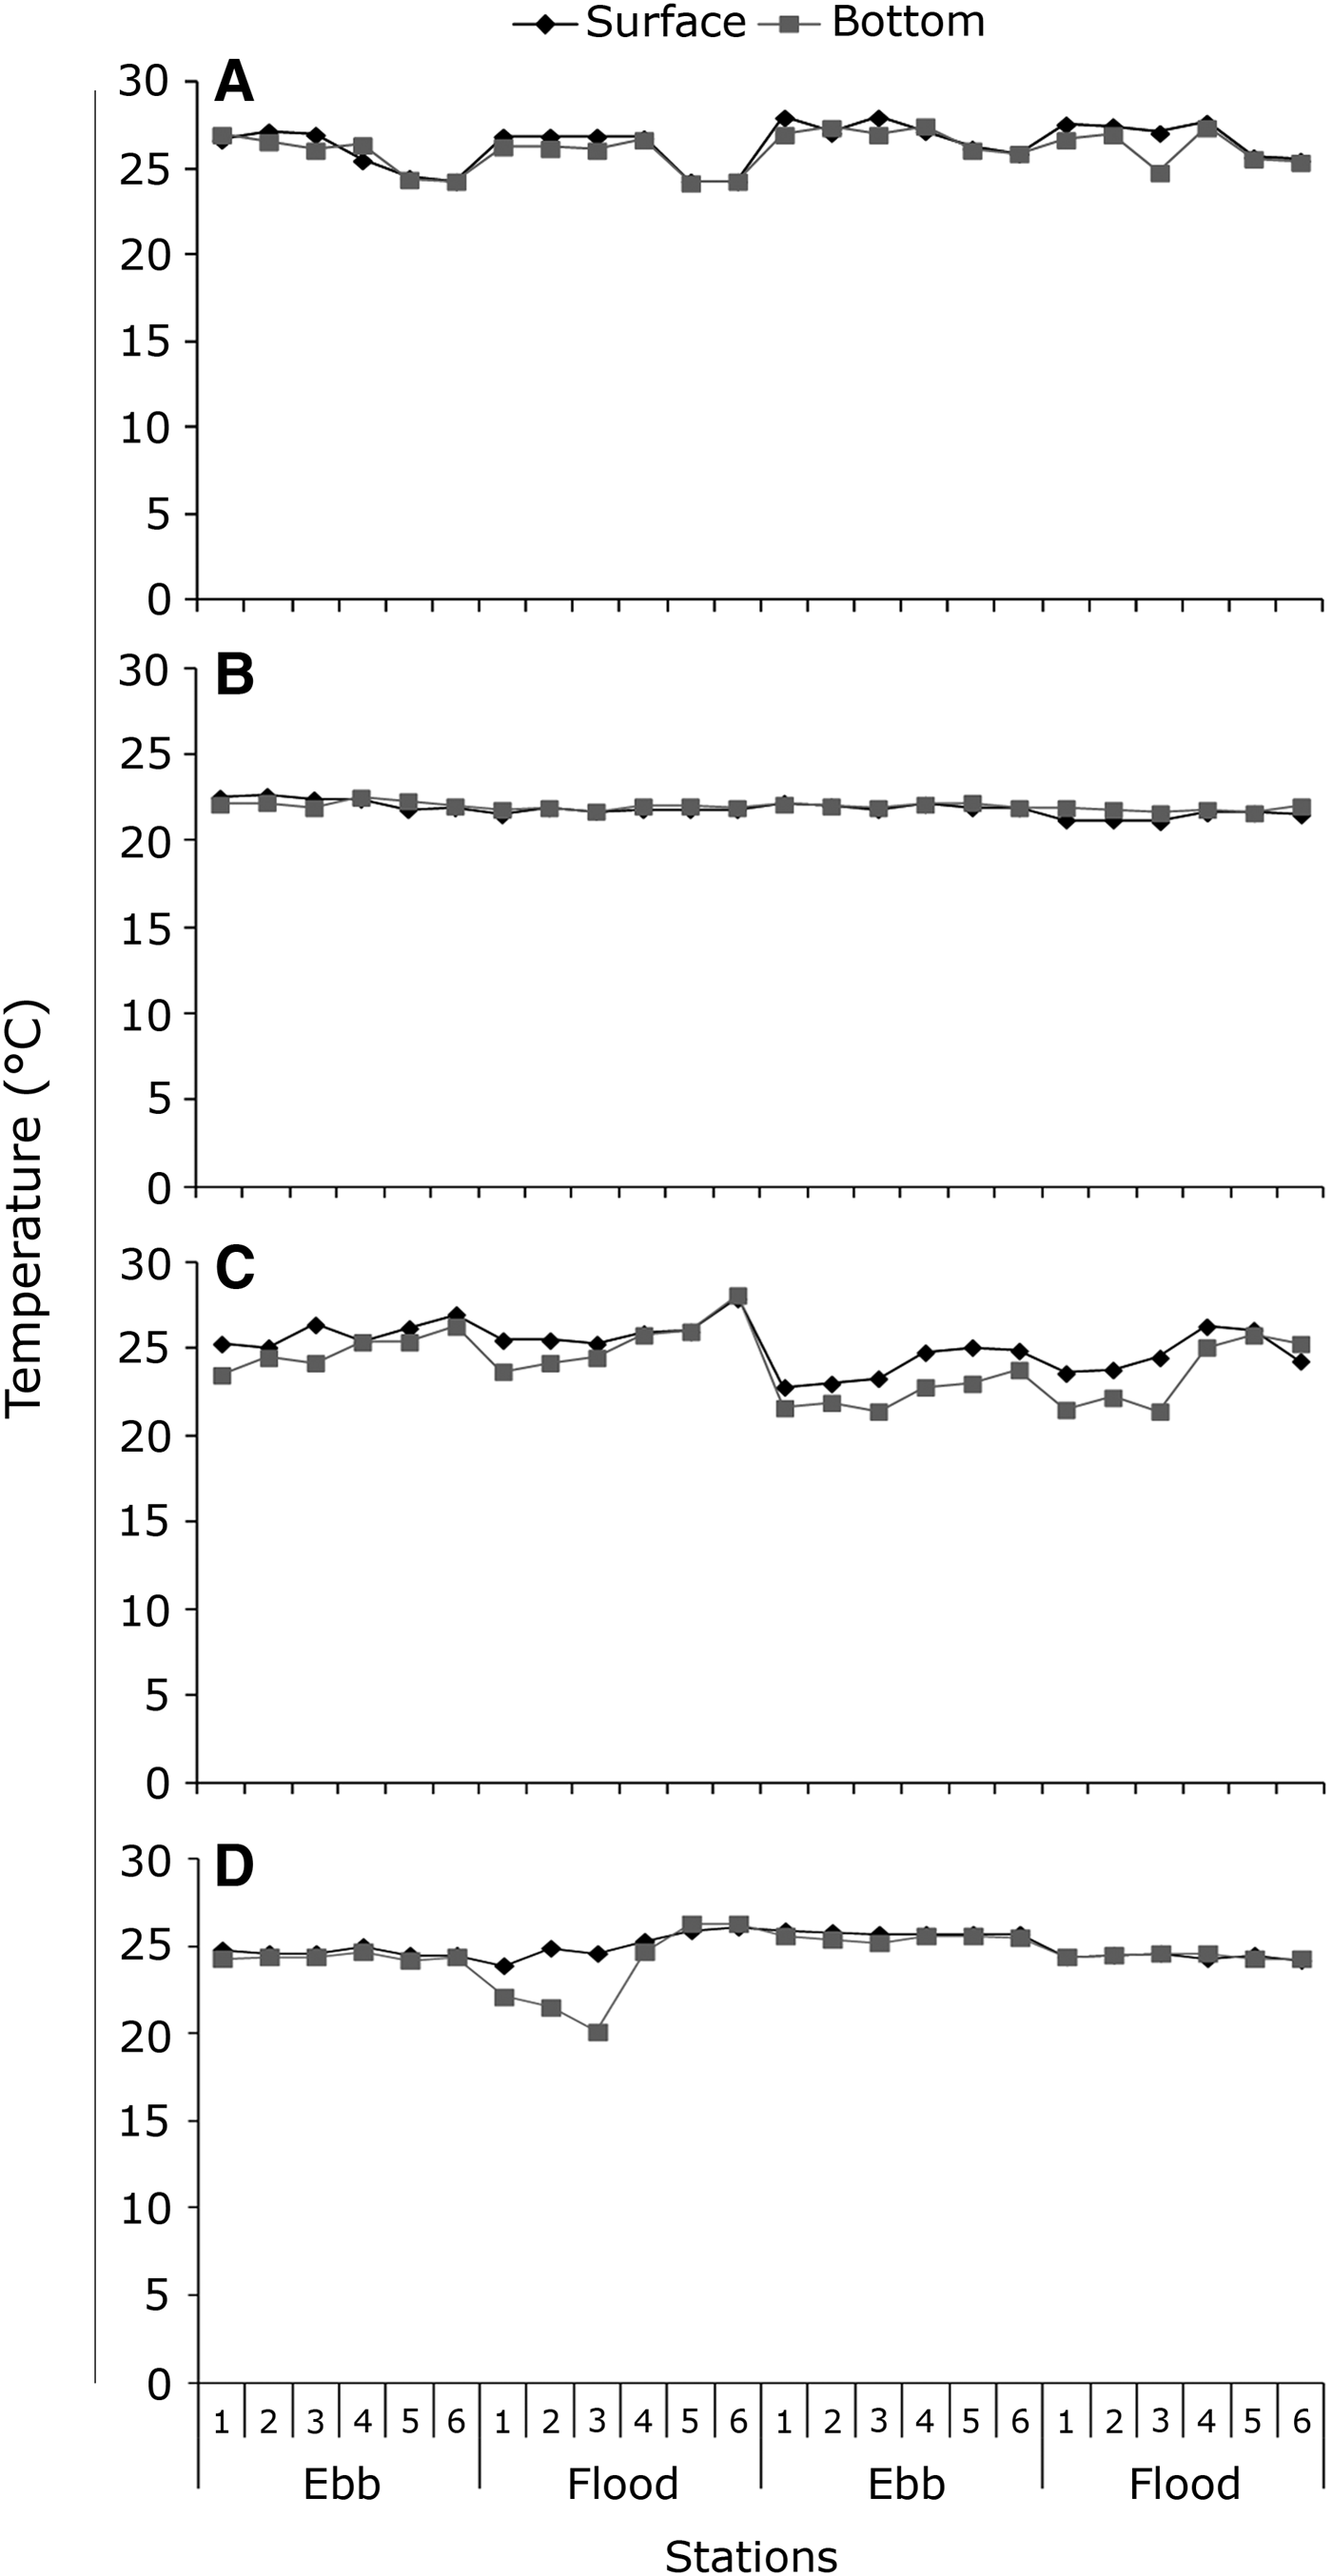
In March 2006 the water temperature varied between 24.3°C and 28.0°C at the surface and between 24.2°C and 27.5°C at the bottom (Figure 2A).

Fig. 2. Variation of water temperature on the surface and bottom at sampling stations, ebb and flood tides conducted in March 2006 (A), July 2006 (B), October 2006 (C) and February 2007 (D) in the Macaé River estuary.
During July 2006 temperature values at the surface and bottom varied from 21.1°C to 22.6°C and from 21.6°C to 22.5°C, respectively (Figure 2B).
In October 2006 the surface temperature ranged from 22.8°C to 27.9°C and from 21.4°C to 28.1°C at the bottom (Figure 2C). Vertical stratification was observed in most stations, especially on the adjacent coast, with a difference of 0.8–3.1°C between the surface and the bottom (Figure 2C).
In February 2007 water temperature ranged from 23.9°C to 26.1°C at the surface and from 20.1°C to 26.3°C at the bottom (Figure 2D). Great variations between surface and bottom were observed in coastal stations during the first flood tide (Figure 2D).
SALINITY
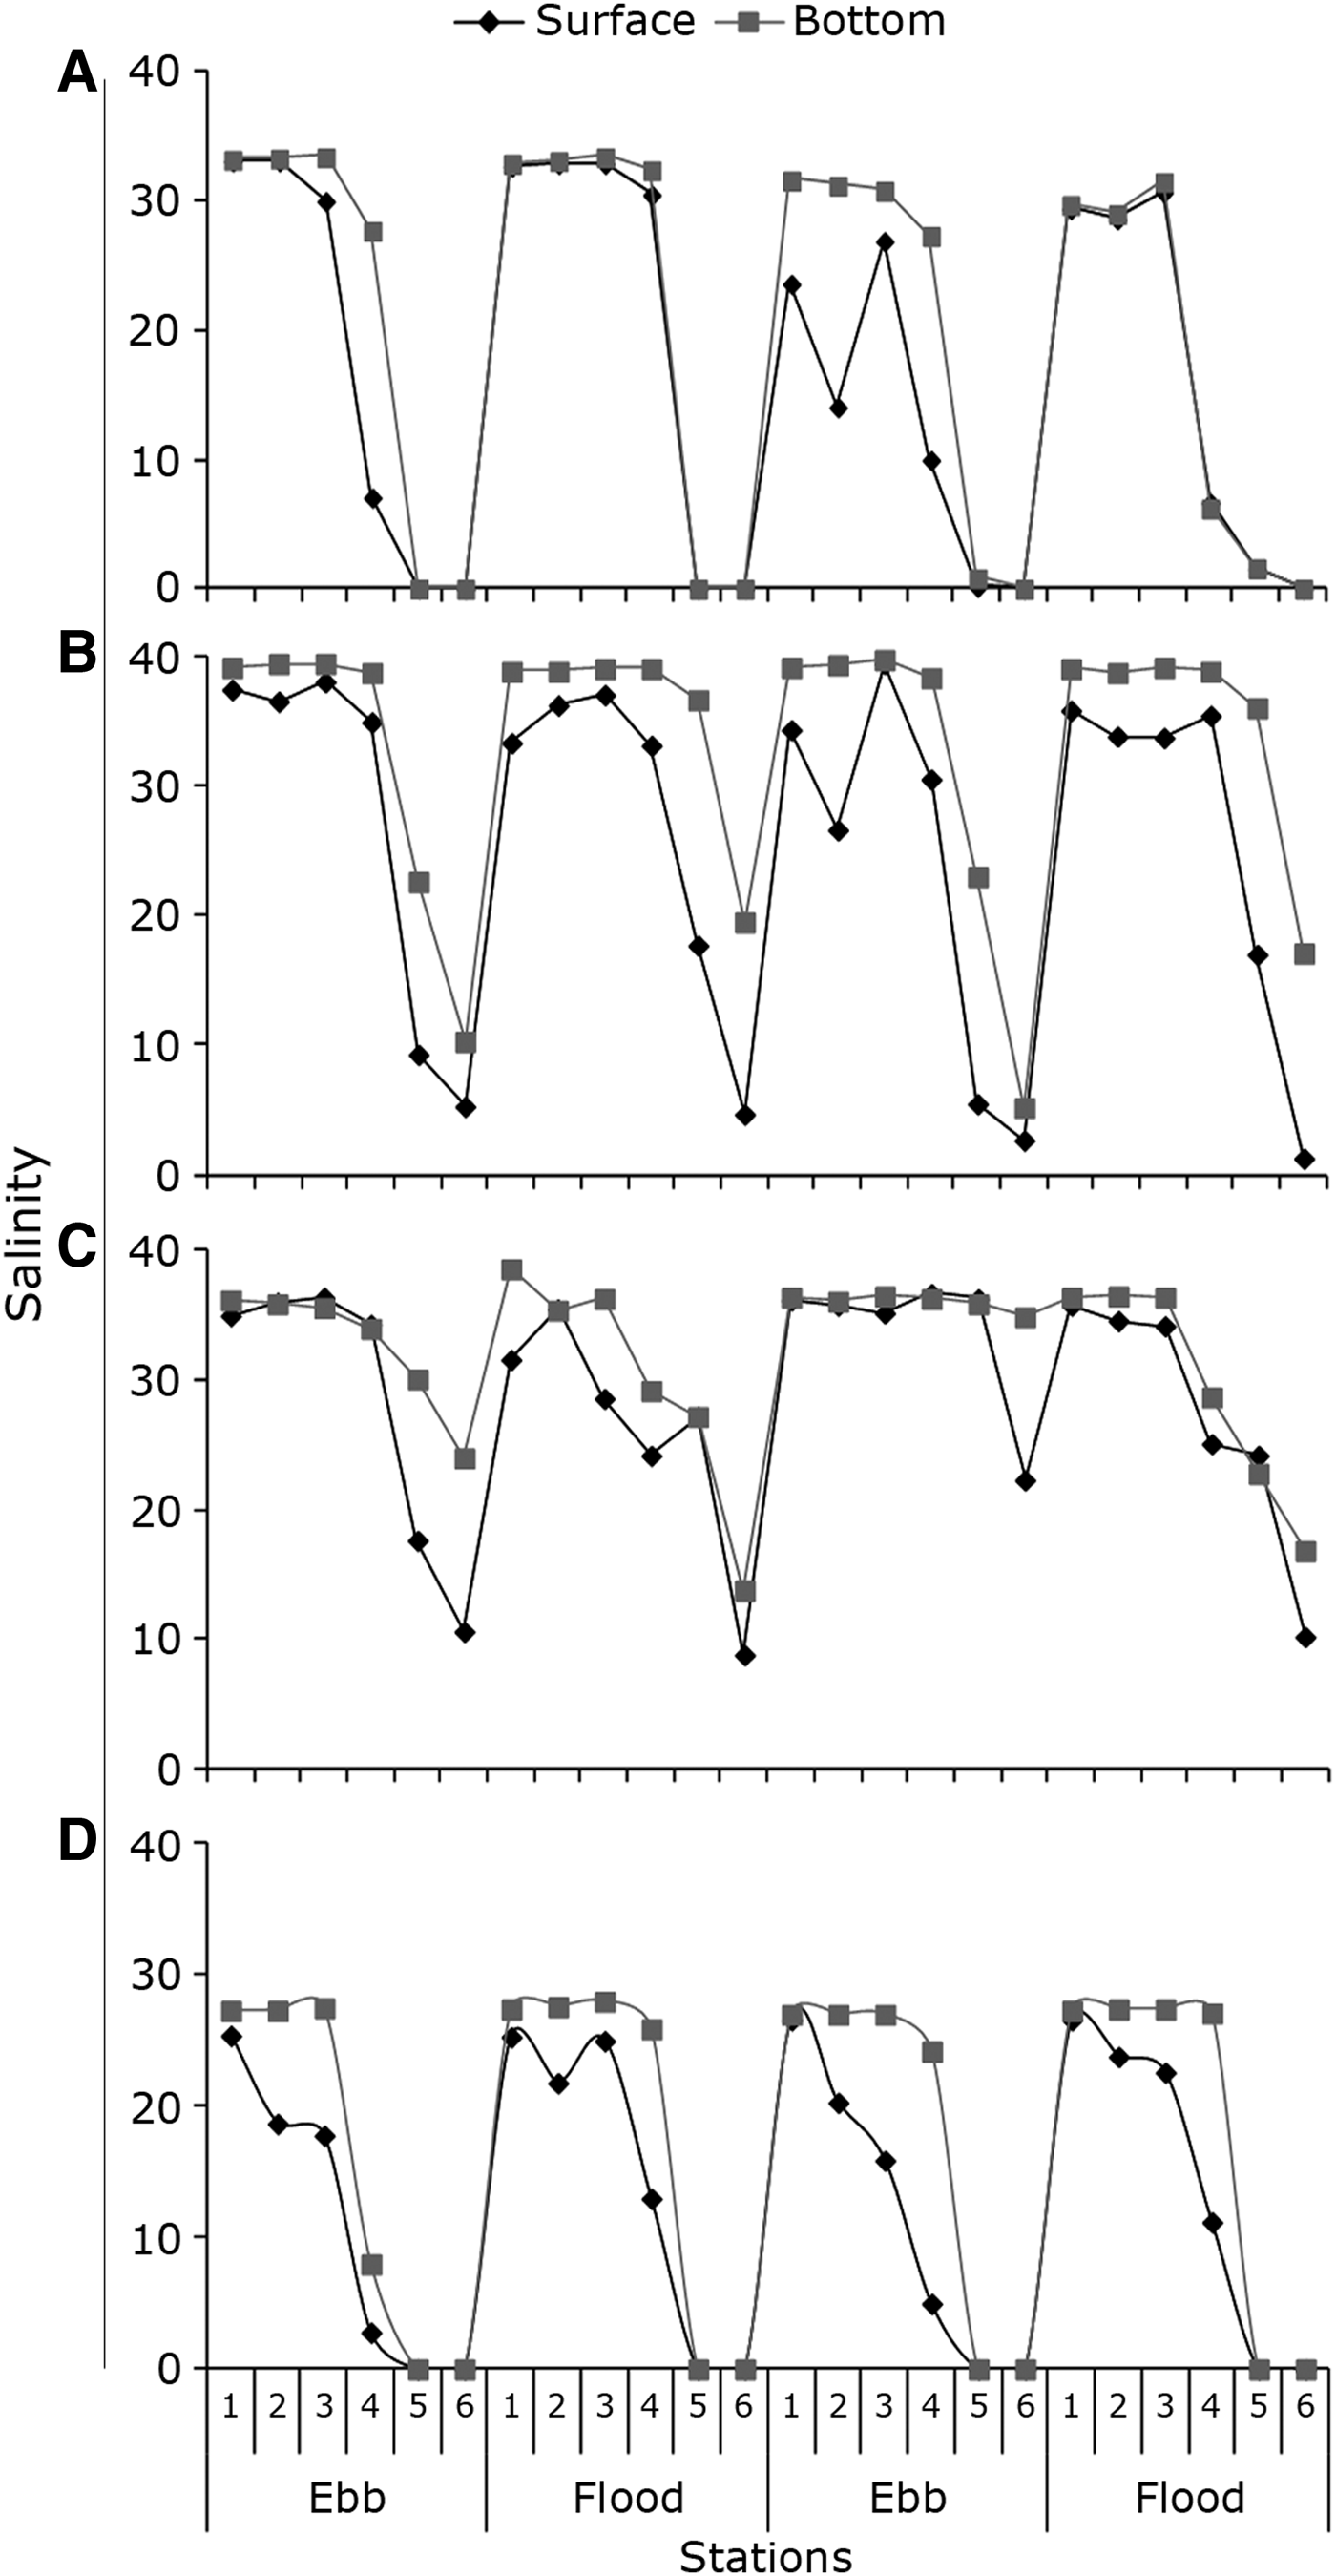
Salinity varied greatly among stations but showed a similar pattern considering all sampling periods. In March, the salinity of stations located inside the river ranged from zero to 1.6 at the surface and at the bottom. In the estuary mouth salinity varied from 6.7 to 30.6 at the surface and from 6.3 to 32.5 at the bottom. Salinity in coastal stations ranged from 14.1 to 33.2 at the surface and from 31.3 to 33.4 at the bottom. The vertical stratification was most pronounced at stations of the coast and the mouth during the ebb tide (Figure 3A).

Fig. 3. Variation of salinity at the surface and bottom at sampling stations, ebb and flood tides, conducted in March 2006 (A), July 2006 (B), October 2006 (C) and February 2007 (D) in the Macaé River estuary.
In July the salinity in the river stations ranged from 1.3 to 17.7 at the surface and from 5.2 to 36.6 at the bottom. At the estuary mouth salinity ranged from 30.5 to 35.4 at the surface and from 38.3 to 39.0 at the bottom. In coastal stations surface salinity ranged from 26.6 to 39.4 at the surface and at the bottom from 39.6 to 39.7. In this period vertical stratification occurred in all collection areas (Figure 3B).
During October 2006 the salinity in the river stations ranged from 9.0 to 36.6 at the surface and from 14.0 to 36.0 at the bottom. In the estuary mouth, the surface salinity ranged from 24.2 to 36.7 and at the bottom from 28.7 to 36.3, and salinity in coastal stations ranged from 28.6 to 36.4 at the surface and from 35.6 to 38.6 at the bottom. Vertical stratification occurred in all regions, but not in all samples (Figure 3C).
In February 2007 at the stations on the river the salinity was zero at both the surface and the bottom in all samples. In the mouth station, salinity ranged from 5.2 to 21.6 at the surface and from 8.0 to 26.0 at the bottom. In coastal stations surface salinity ranged from 16.0 to 26.6 and at the bottom from 27.0 to 28.0. There was a vertical stratification in coastal and estuary mouth stations (Figure 3D).
CHLOROPHYLL a
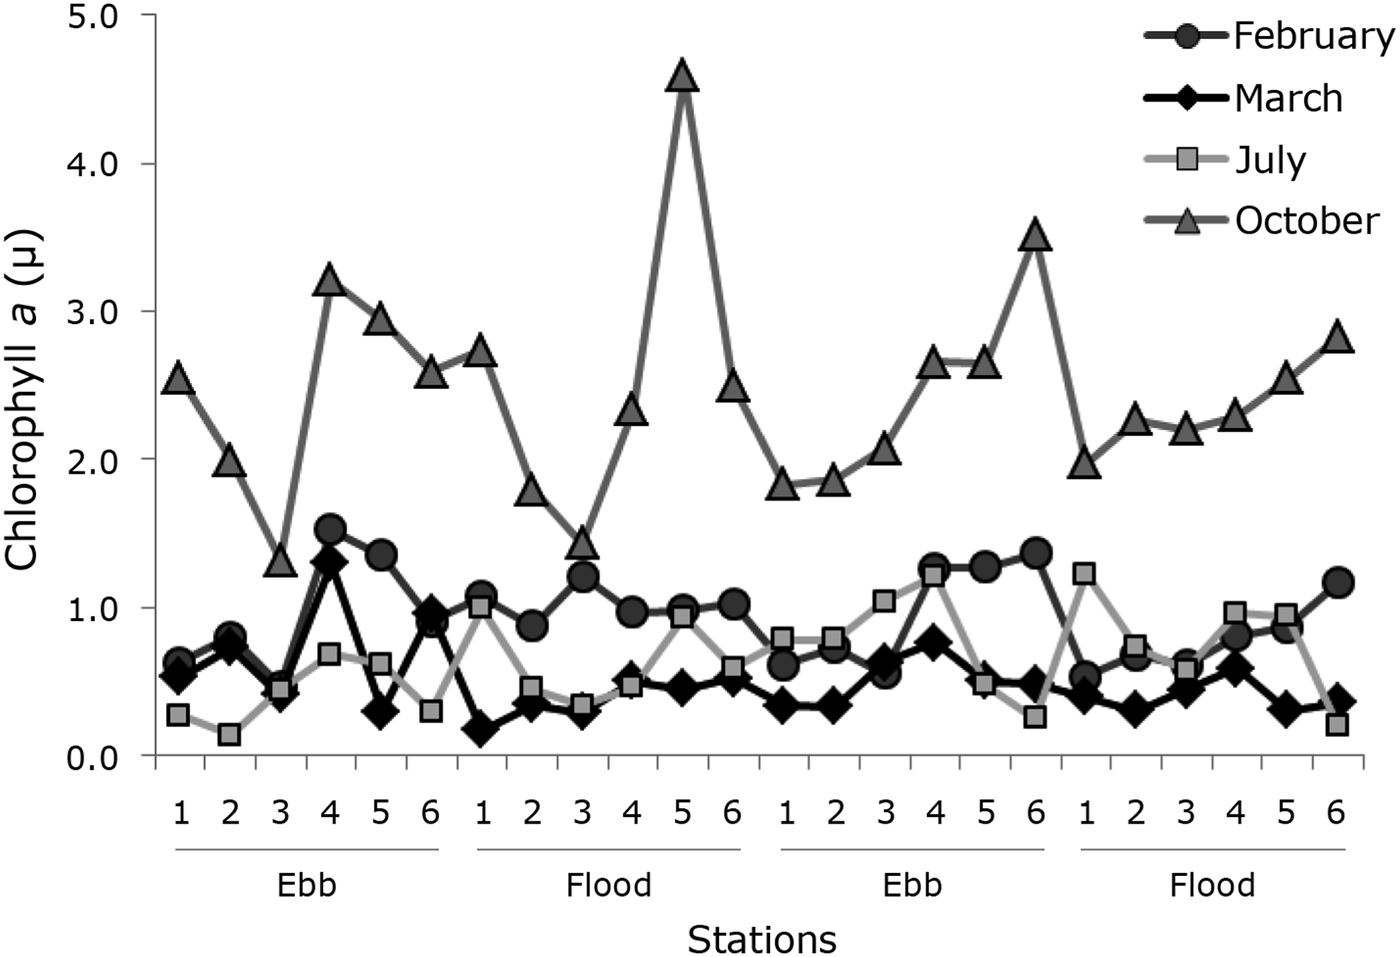
The highest values of chlorophyll-a were recorded in October, with a maximum value of 4.6 µg l−1 at the river station during the flood tide and minimum of 1.3 µg l−1 at the coastal station during the ebb tide. In March and February the highest values of chlorophyll-a were observed in the region of the mouth (1.3 µg l−1 and 1.5 µg l−1), and lowest in the coastal region (0.2 µg l−1 and 0.5 µg l−1). In July the minimum (0.1 µg l−1) and maximum (1.2 µg l−1) values occurred in the coastal region (Figure 4).

Fig. 4. Variation of chlorophyll-a concentrations (µ) at sampling stations, ebb and flood tides, conducted in March, July, October 2006 and February 2007 in the Macaé River estuary.
PRECIPITATION
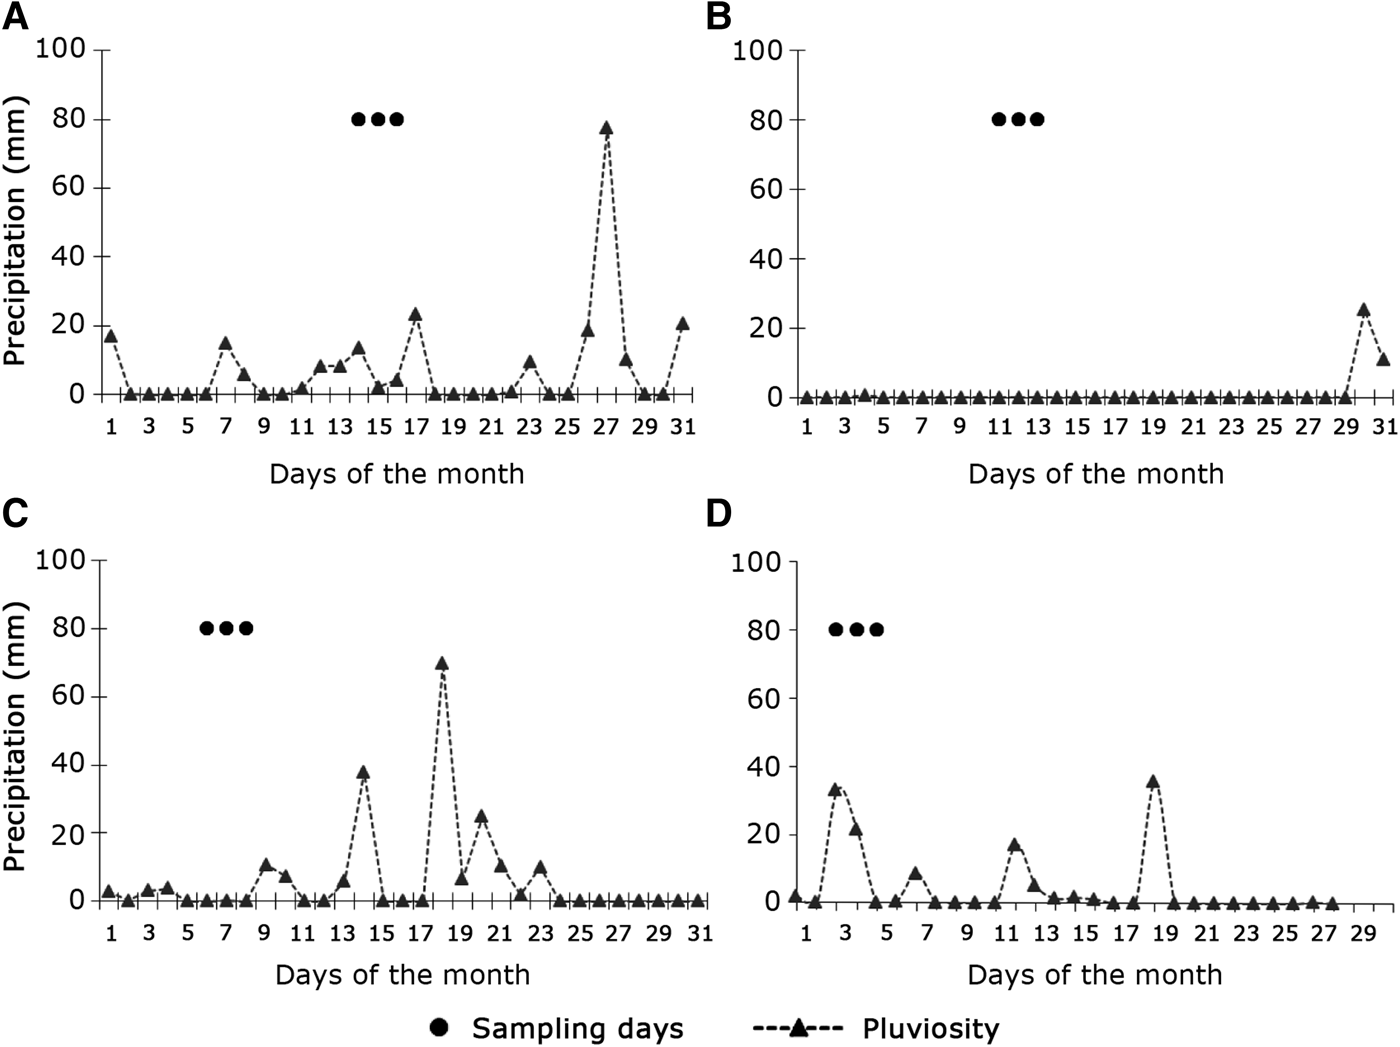
The days of maximum precipitation occurred in March (77.6 mm) and October (70 mm; Figures 5A, C). However, in October the days of greatest rainfall occurred after the sampling period (Figure 5C). Thus, the assessment carried out in this period was considered as sampling the dry season. July was the driest month, with maximum precipitation of 2.6 mm and only three days of rain (Figure 5B). In February 2007, the maximum rainfall was 36 mm (Figure 5D).

Fig. 5. Daily precipitation values in the campaigns of March 2006 (A), July 2006 (B), October 2006 (C) and February 2007 (D) in Macaé River estuary. The dots indicate the days of sampling.
Taxa composition and density
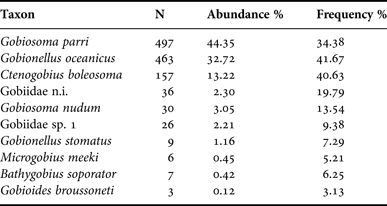
A total of 1234 Gobiidae larvae, distributed in eight species and one morphotype, were collected in March, July and October 2006 and February 2007 in the Macaé River estuary (Table 2). Thirty-six larvae were identified to family level because they were in yolk stage or damaged.
Table 2. Numbers of larvae collected for each taxon and their abundances and frequencies.

The highest density was observed in March (24.41 ±15.38 larvae 100 m−3) followed by October (21.55 ±16.40 larvae 100 m−3), July (7.93 ±7.44 larvae 100 m−3) and February 2007 (3.20 ±3.00 larvae 100 m−3).
The Macaé River estuary was dominated by three gobiid species comprising 90% of the total abundance (Table 2). The species Gobiosoma parri Ginsburg, 1933 was the most abundant comprising 44% of the total caught, followed by Gobionellus oceanicus (Pallas, 1770) 33% and Ctenogobius boleosoma (Jordan & Gilbert, 1882) 13%. The other taxa were less representative and contributed less than 10% of the total.
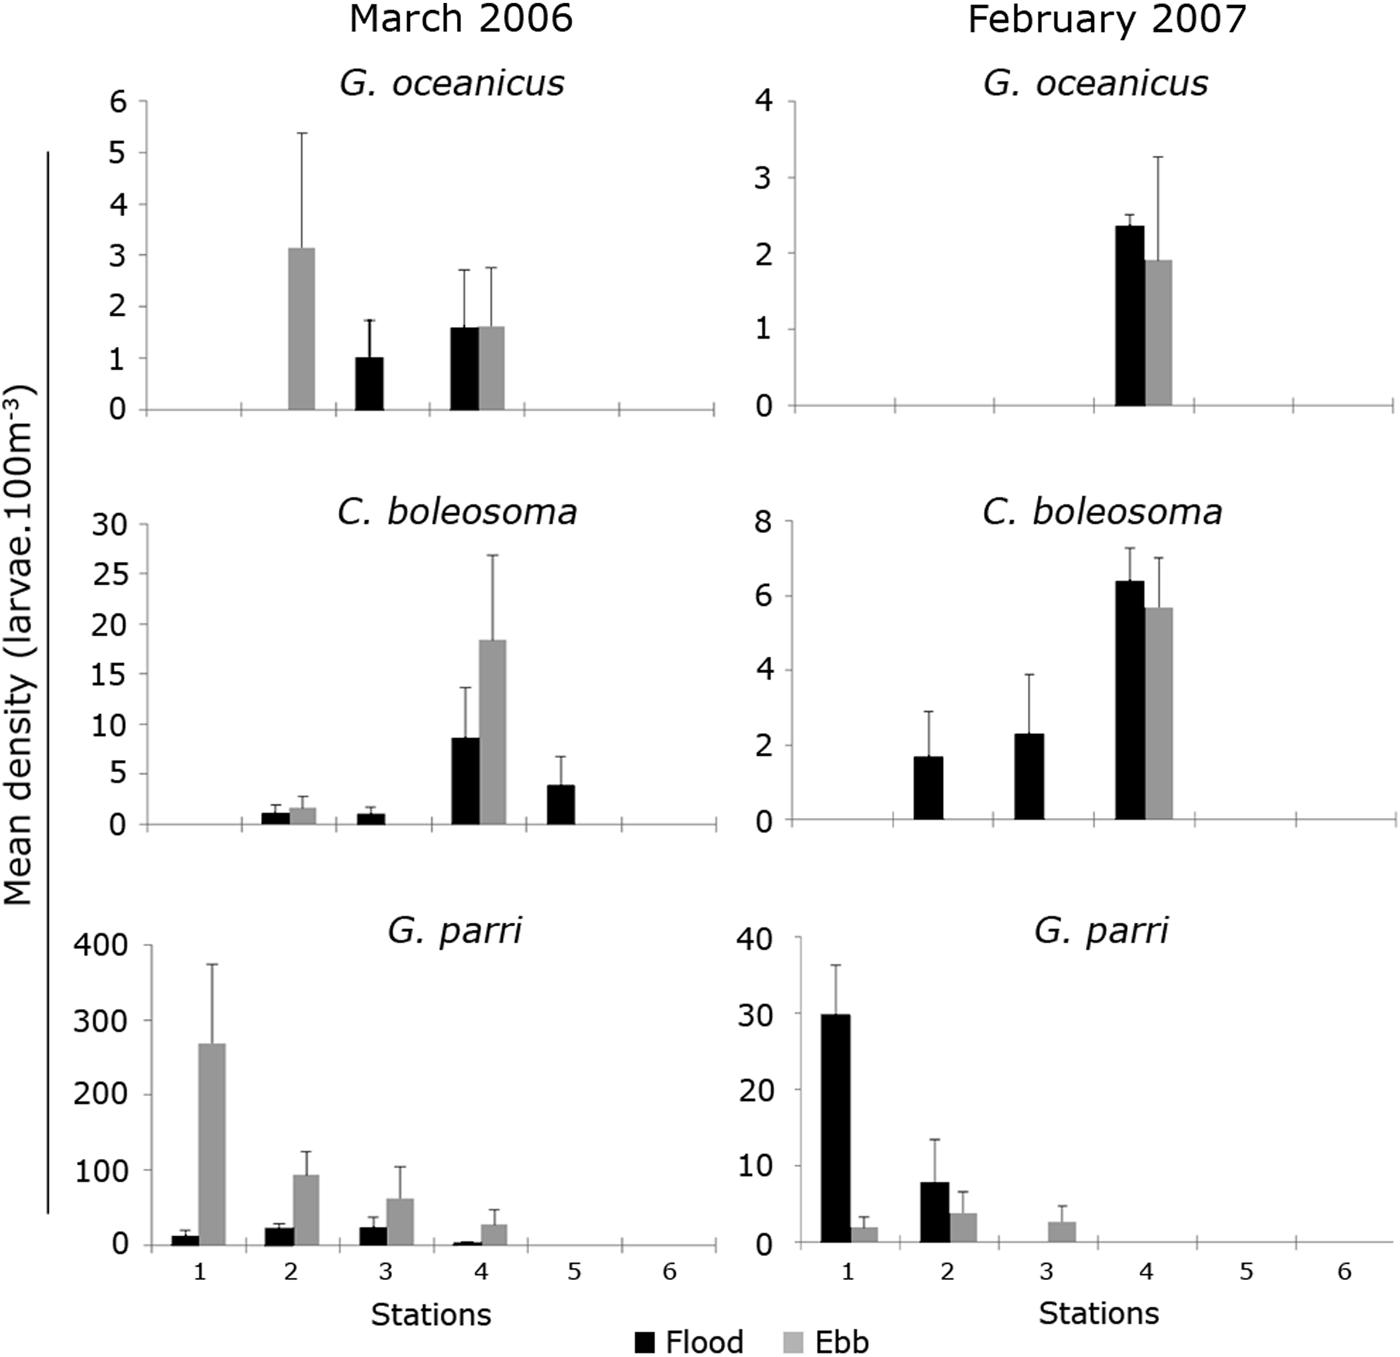
In the rainy season (February and March) coastal stations (1, 2 and 3) and the estuary mouth (4) were characterized by having the highest larval densities of the most abundant species (Figure 6). Inside the river (Stations 5 and 6) only C. boleosoma larvae were collected. In this season larvae of the species G. parri were more representative, especially at Station 1 in March, during the ebb tide (Figure 6). In February larvae of G. oceanicus occurred only in the estuary mouth, while in March it also appeared at Stations 2 and 3 (Figure 6). Larvae of C. boleosoma showed high densities at Station 4 in February, during the flood tide and March on the ebb tide. Unlike the others, this was the only species that occurred in Station 5 in March (Figure 6).

Fig. 6. Mean density of Gobionellus oceanicus (Pallas, 1770), Ctenogobius boleosoma (Jordan & Gilbert, 1882) and Gobiosoma parri Ginsburg, 1933 at sampling stations, on ebb and flood tides, during the rainy season (March 2006 and February 2007) in the Macaé River estuary. Note the different x-axis values.
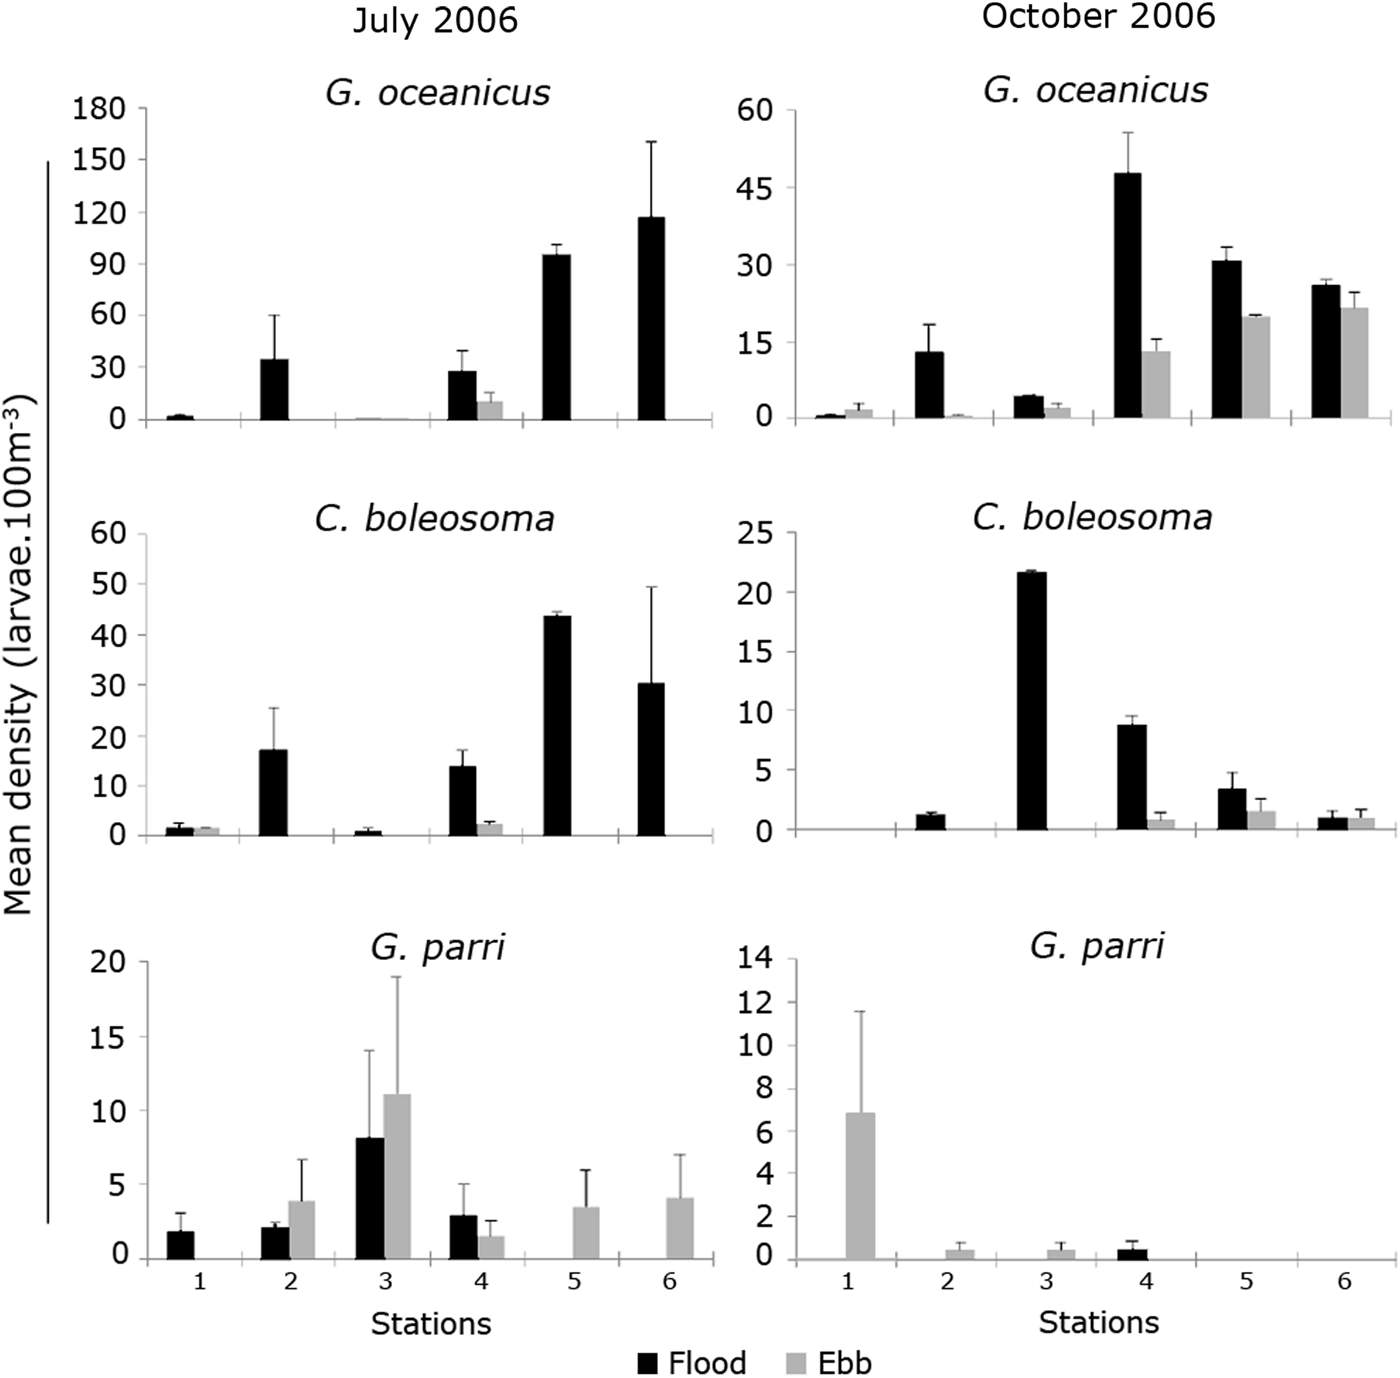
In the dry months (July and October), stations located inside the river were characterized by high densities (Figure 7), with emphasis on the larvae of the species G. oceanicus, dominant in this period. In July, G. oceanicus occurred in high densities in the river stations, without any records on the ebb tide (Figure 7). In October, this species had higher densities at the station at the mouth, followed by the stations on the river, always during the flood tide (Figure 7). Larvae of C. boleosoma occurred in higher densities at river station 5 during July (Figure 7) and at Station 3 in October (Figure 7), both on the flood tide. Larvae of G. parri were recorded in low densities during this period of the year, occurring only at the coastal stations in October (Figure 7). During July and October, they presented their highest densities at coastal stations (3 and 1, respectively) during the ebb tide (Figure 7).

Fig. 7. Mean density of Gobionellus oceanicus (Pallas, 1770), Ctenogobius boleosoma (Jordan & Gilbert, 1882) and Gobiosoma parri Ginsburg, 1933 at sampling stations, on ebb and flood tides during the dry season (July 2006 and October 2007) in the Macaé River estuary. Note the different x-axis values.
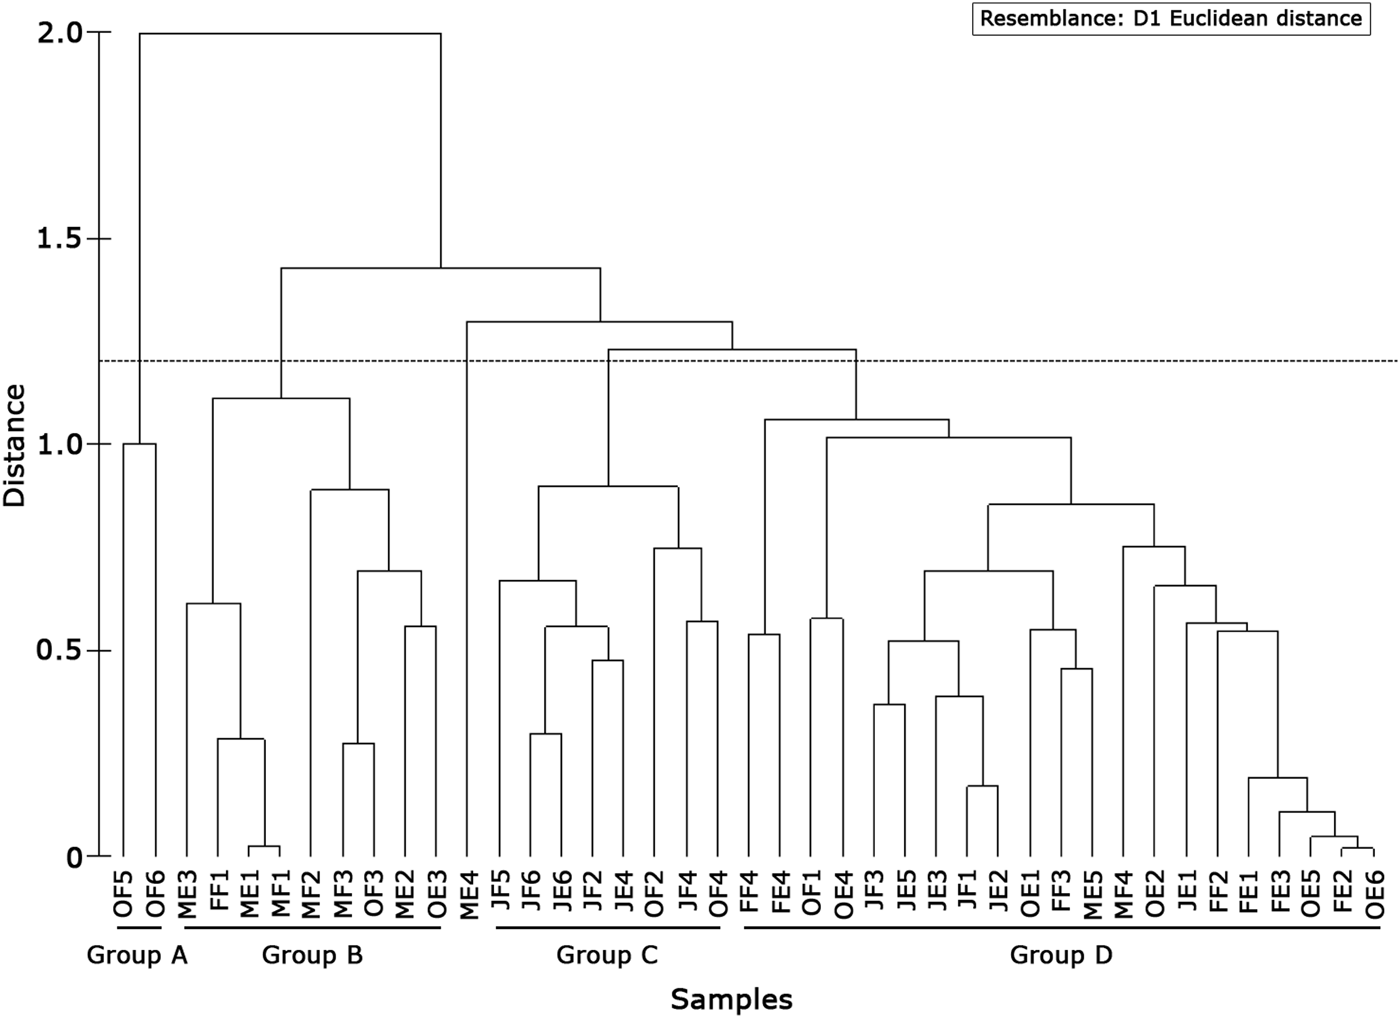
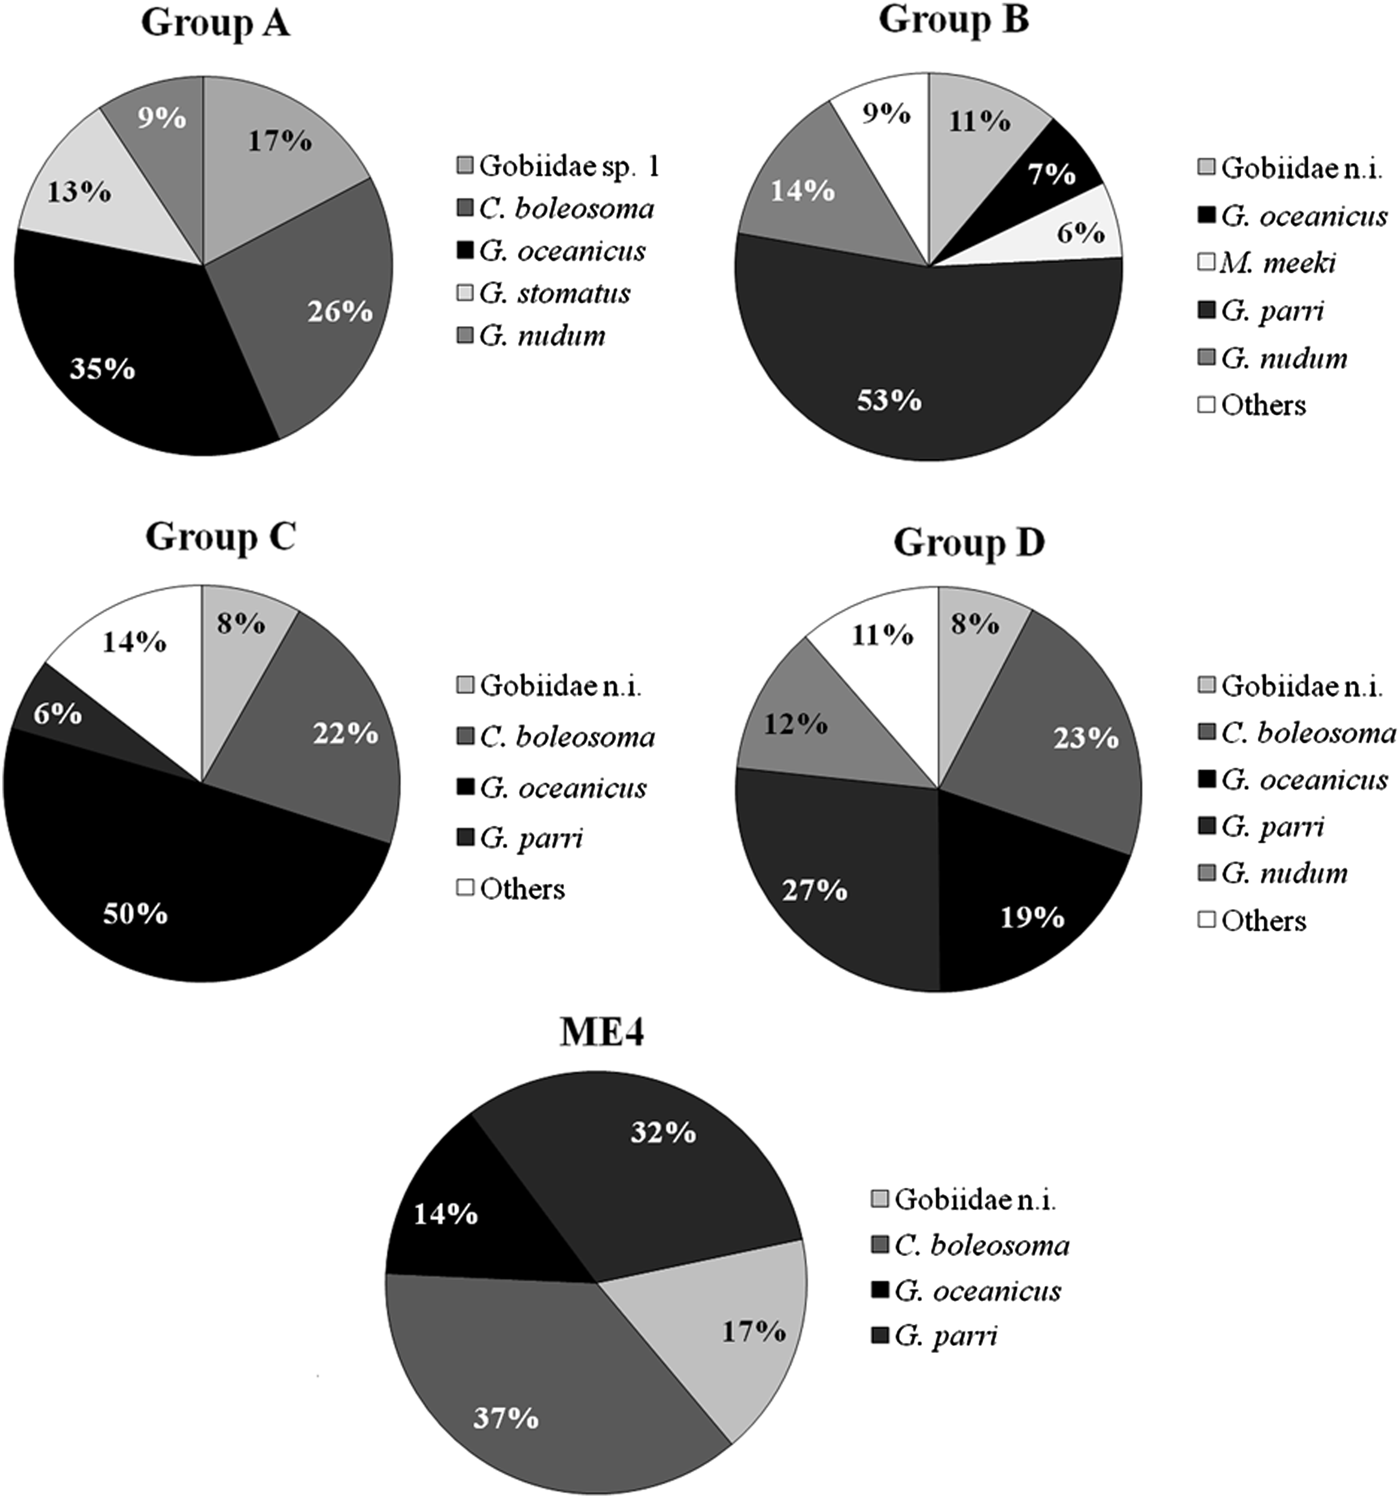
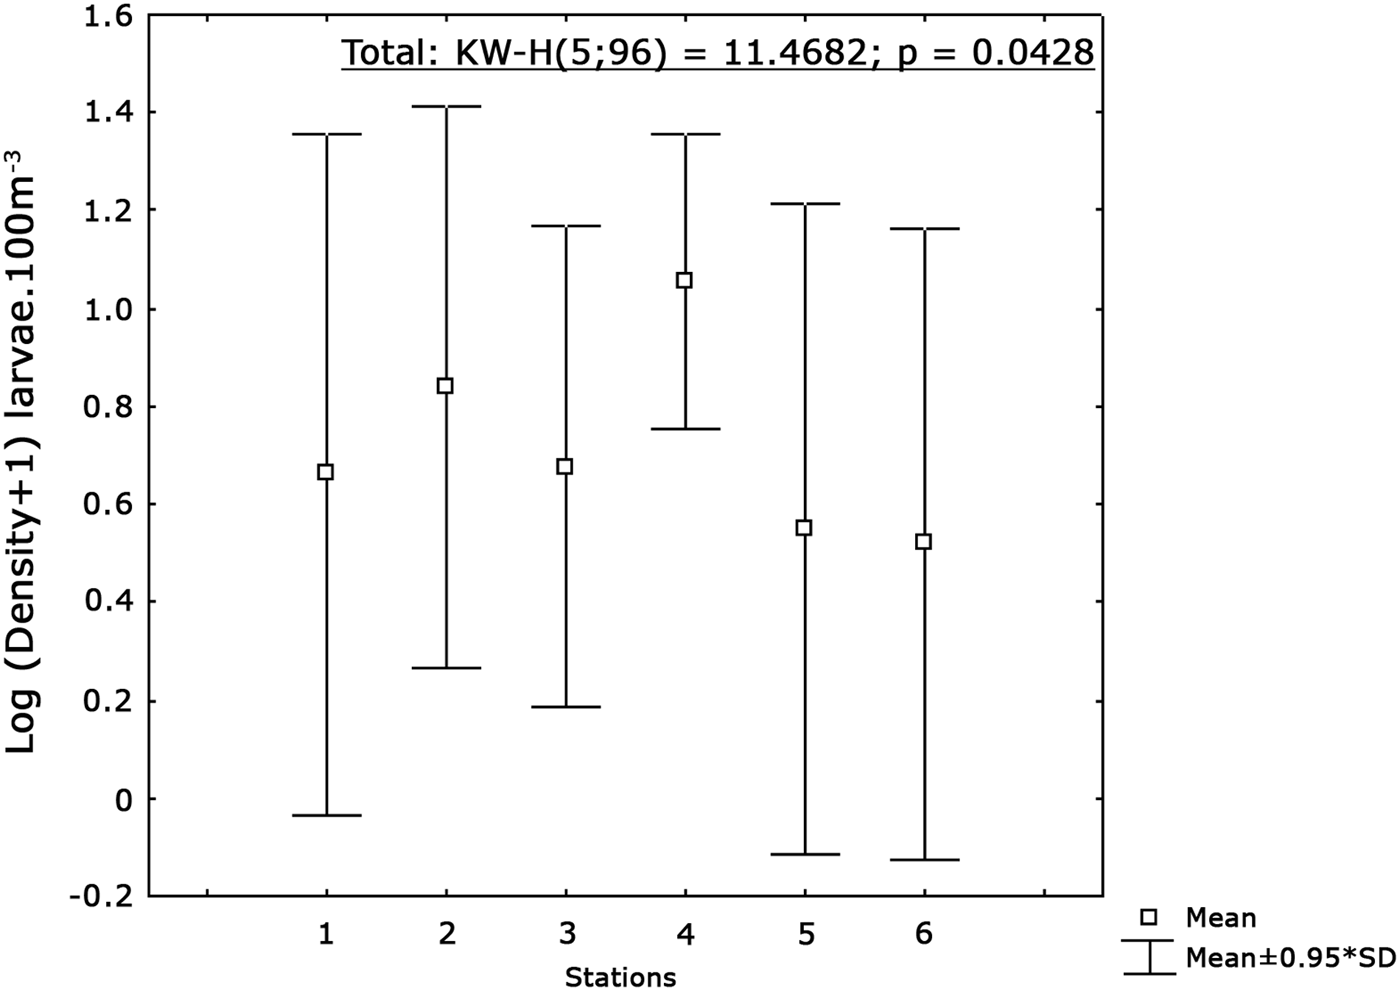
The cluster analysis showed four groups (Figure 8): the first group (A) included only samples collected in Stations 5 and 6 in October during the flood tide. Larval composition was characterized by absence of G. parri (Figure 9). Group B (Figure 8) was formed by coastal stations (1, 2 and 3) during the rainy months. This group showed high abundance of larvae G. parri (53%) and low abundance of larvae G. oceanicus (7%) and C. boleosoma (4%). The Group C was characterized by samples collected during the dry season (Figure 8) when G. parri was less abundant than in Groups B and D (Figure 9). Group D showed a greater abundance of the species G. parri (27%) compared to the small variation of C. boleosoma and G. oceanicus, ranging between 23% and 19%, respectively (Figure 9). On the other hand, Station MF4 stood out from the others for being dominated by the species C. boleosoma (37%, Figure 9). Usind a non-parametric test (Kruskal–Wallis) it was observed that the distribution of larvae differed among stations (P < 0.05). Station 4 had the highest average density followed by Station 2, while Stations 5 and 6 had lower average densities (Figure 10). In relation to the tides and the dry and rainy seasons, a Mann–Whitney test showed significant difference between densities obtained between flood and ebb tides and between the rainy and dry periods (P < 0.05).

Fig. 8. Similarity between periods and sampling stations, based on relative abundances of species in the Macaé River estuary. O, October; M, March; F, February; J, July, F, flood; E, ebb.

Fig. 9. Relative abundances of the most abundant species in each group formed by cluster analysis in the Macaé River estuary.

Fig. 10. Differences in the mean densities of Gobiidae larvae abetween the stations (P < 0.05).
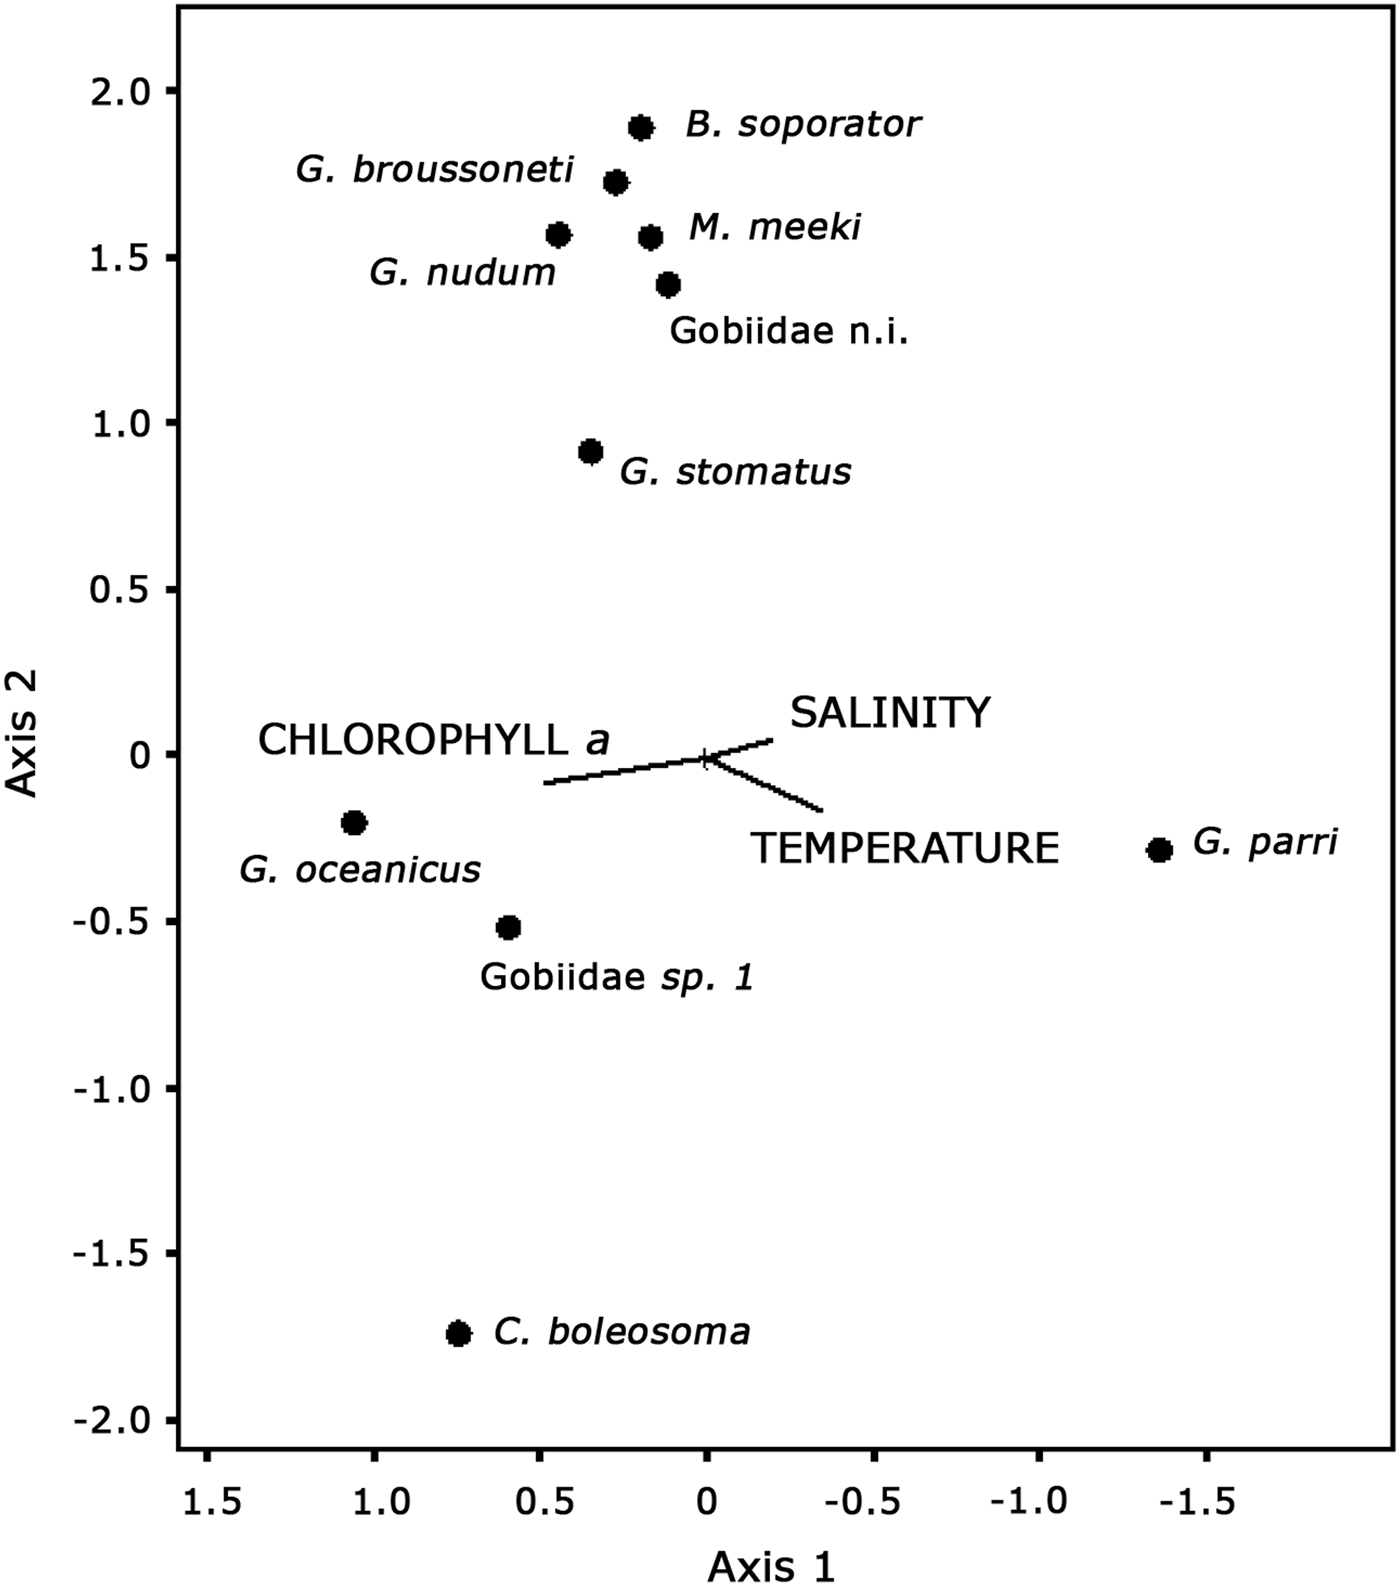
The combined effect of the three variables on the distribution of the CCA axes was significant according to the Monte Carlo permutation test (P < 0.05). The axis I (eigenvalue = 0.360) accounted for 38% and axis II (eigenvalue = 0.038) for 4% of the variation in species–environment relationship percentage. According to inter-set correlations, chlorophyll-a and temperature factors were considered biologically significant (Table 3). The chlorophyll-a correlated negatively with axis I (−0615). Temperature was positively correlated with axis I (0.446) and negatively with axis II (−0.464). Axis I separated the species G. parri due to the high temperatures and salinities and low rates of chlorophyll-a. The species G. oceanicus was associated with higher rates of chlorophyll-a and low temperatures and salinities (Figure 11). The species C. boleosoma was separated from the others by correlating with high chlorophyll-a and temperatures and low salinities. Axis II showed a separation of the species C. boleosoma and other species due to their correlation with elevated temperatures (Figure 11).

Fig. 11. Gobiidae species and environmental variables in a triplot ordination diagram using the first two canonical correspondence axes.
Table 3. Inter-set correlations for three variables: salinity, temperature and chlorophyll-a. In bold are the values of variables ≥ |0.4|, which are considered biologically important according to Rakocinski et al. (Reference Rakocinski, Lyczkowski-Shultz and Richardson1996).

DISCUSSION
The water temperature found in the present study reflected the pattern of the humid tropical climate. According to Santos et al. (Reference Santos, Amado, Minello, Farjalla and Esteves2006) it is characterized by higher temperatures from November to April and cooler temperatures from May to October, with well-defined dry and rainy seasons.
In the Macaé River estuary seasonal variation of rainfall and consequent freshwater discharge directly influence the salt wedge region. The salinity variation in this estuary allows the entry of marine species in the river without suffering drastic adjustments due to variations in salinity.
Miranda et al. (Reference Miranda, Castro and Kjerfve2002) characterized this change in regimes of estuaries as common according to the season and tide. In the Mucuri River estuary, located in the north-east of Brazil, during the dry season the salt water penetrates about 3 km, forming a salt wedge in the upper estuary, where during the rainy season salinity is virtually zero (Castro & Bonecker, Reference Castro and Bonecker1996; Bonecker et al., Reference Bonecker, Castro and Bonecker2009; Gomes et al., Reference Gomes, Campos and Bonecker2014). The Macaé River estuary showed the same pattern. Salinity presented differences between flood and ebb tides. In dry seasons, low river flow leads to an increase in the tidal influence on the estuary resulting in high seawater incursion, mainly during flood tides. The reverse occurs in rainy seasons when the high volume of river flow means the seawater cannot penetrate into the estuary and thus salinity is low.
The values of chlorophyll-a observed in the estuary of the Macaé River and adjacent coastal region were very low (maximum 4.6 µg l−1) when compared with other Brazilian estuaries. In estuarine system of Cananéia chlorophyll concentration ranged between 1.32 and 20.42 µg l−1 (Ara, Reference Ara2001) and in the estuary of Camboriú from 5.1 µg l−1 to 22.8 µg l−1 (Pereira-Filho et al., Reference Pereira-Filho, Schettini, Rörig and Siegle2001). According to studies of phytoplankton organisms in estuaries, there is a variation in the concentration of chlorophyll-a in different climatic periods during the year (Sin et al., Reference Sin, Wetzel and Anderson2000; van der Molen & Pressinotto, Reference van der Molen and Perissinotto2011). The light availability may limit algal growth during the rainy season (Gameiro et al., Reference Gameiro, Zwolinski and Brotas2011) depending on the intensification of land leaching and hence, greater amounts of suspended material will be available in the water column, hindering light penetration (Eskinazi-Leça et al., Reference Eskinazi-Leça, Koening, Silva-Cunha, Eskinazi-Leça, Newmann-Leitão and Costa2004). This fact may explain the higher rates of chlorophyll-a which occurred in the dry season (October) along with results reported for other estuaries of Brazil (Grego et al., Reference Grego, Feitosa, Honorato-da-Silva, Silva-Cunha and Filho2009; Aquino et al., Reference Aquino, Figueiredo, Anjos, Passavante and Silva-Cunha2012).
Temperature and chlorophyll-a were identified as important regulatory environmental parameters of the occurrence of goby larvae in the Macaé River estuary. In the St Lucia estuary, South Africa, temperature was the most important variable explaining larval fish distributions and abundances (Harris et al., Reference Harris, Cyrus and Beckley1999). Muiño et al. (Reference Muiño, Carrera and Iglesias2003) identified temperature as the major environmental factor responsible for temporal variations in sardine larvae abundance along the coast of Northern Spain.
In this study the estuary was used by Gobiidae larvae that were found throughout it and in both dry and rainy seasons. However, there is a general tendency for estuarine fish larvae to peak in abundance during rainy seasons (Harris et al., Reference Harris, Cyrus and Beckley1999; Young & Potter, Reference Young and Potter2003).
In February, the Gobiidae larvae showed a low preference for the Macaé River estuary. This Gobiidae larvae relationship with this month can be linked to the fact that the intense rainfall during the sampling period in February influenced the absence of Gobiidae larvae because the outflow of the river did not allow the larvae to penetrate with the salt wedge. In rainy seasons, there is an increase in river flow and salinity decreases, reducing the density of fish larvae in rivers (Ramos et al., Reference Ramos, Cowen, Ré and Bordalo2006). In March the highest density of fish larvae was reported due to the high density of the species Gobiosoma parri in coastal stations. This peak may be a sign that G. parri is spawning in this season. According to Tricklebank et al. (Reference Tricklebank, Jacoby and Montgomery1992) overall seasonality patterns often directly influence the abundance of dominant taxa, and this happened in this study, with the larvae of G. parri. The river discharges by nutrient upload of river plumes lead to the strong positive impact on coastal fisheries (Meynecke et al., Reference Meynecke, Lee, Duke and Warnken2006).
In this study we found a great number of Gobiidae taxa, with nine identified species, as in other estuaries or coastal zones in the world (Barletta et al., Reference Barletta, Barletta-Bergan, Saint-Paul and Hubold2005; Borges et al., Reference Borges, Ben-Hamadou, Chícharo, Ré and Gonçalves2007; Hermosilla et al., Reference Hermosilla, Tamura, Okazaki, Hoshino, Moteki and Kohno2012; Kundu et al., Reference Kundu, Chaudhuri, Mukherjee, Sen and Homechaudhuri2012). In the Mucuri River estuary, in a similar study with the Gobiidae family, a higher number of species was identified, but over a larger sampling period (Gomes et al., Reference Gomes, Campos and Bonecker2014). It must be remembered that not all studies of fish fauna have used the same sampling method. Furthermore, variations in the abiotic environment and habitat heterogeneity make it difficult to compare the number of species (Blaber, Reference Blaber1997).
According to this study, G. parri was the most abundant species in the Gobiidae assemblage of the Macaé River estuary as well as in the Rio de la Plata River estuary, located between Uruguay and Argentina (Madirolas et al., Reference Madirolas, Acha, Guerrero and Lasta1997). This pattern has not been described before for Brazilian estuaries, generally dominated by Ctenogobius boleosoma (Coser et al., Reference Coser, Pereira and Joyeux2007; Marcolin et al., Reference Marcolin, Conceição, Nogueira, Mafalda and Johnsson2010; Gomes et al., Reference Gomes, Campos and Bonecker2014) or Microgobius meeki Evermann & Marsh, 1899 (Barletta-Bergan et al., Reference Barletta-Bergan, Barletta and Saint-Paul2002a).
In the Macaé estuarine system the species G. parri was dominant in the rainy months and had lower densities in the dry season. Primo et al. (Reference Primo, Azeiteiro, Marques and Pardal2011) reported a similar peak of Crystallogobius linearis (Düben, 1845) in a Portuguese temperate estuary. However, Acha (Reference Acha1994), in a temperate estuary in the south-west Atlantic, showed peak abundances from June to August, inferring that the spawning season of G. parri occurs from February to April. In Brazil, larvae of this species occurred in the Patos Lagoon estuary during the whole year (Muelbert & Weiss, Reference Muelbert, Weiss and Hoyt1991). They typically use the estuaries to be transported by drift to the nearshore environment (Miller et al., Reference Miller, Reed, Pietrafesa, McCleave, Arnold, Dodson and Neill1984). This explains the high densities in coastal stations of G. parri larvae.
Gobiosoma parri migrated toward the river only on the ebb in times of drought. However, it remained at shore stations throughout the year independently of the tide. This larval retention mechanism may be explained by the migration of the larvae to greater depths during low tide (Aceves-Medina et al., Reference Aceves-Medina, Saldierna-Martínez, Hinojosa-Medina, Jiménez-Rosenberg, Hernández-Rivas and Morales-Ávila2008) or concentration at the surface during flood tide (Barletta & Barletta-Bergan, Reference Barletta and Barletta-Bergan2009).
The larvae of the species Gobionellus oceanicus and C. boleosoma migrated to the river during dry seasons, benefiting from the rising tide. This may be associated with selective tidal stream transport (STST), which is a strategy for exportation through vertical migrations synchronized with the tide (Boehlert & Mundy, Reference Boehlert and Mundy1988). The species C. boleosoma, a marine estuarine-opportunist, does not depend on the estuary as a nursery area, but uses it opportunistically, and G. oceanicus, a marine estuarine dependent, requires sheltered estuarine habitats for its development, but also lives along coasts (Gomes et al., Reference Gomes, Campos and Bonecker2014). Although this species is found in estuaries, it also inhabits the coastal zone (Camargo & Isaac, Reference Camargo, Isaac and Fernandes2003). The present data seem to indicate that whenever the salt intrusion was favourable, larvae penetrated into the Macaé River estuary.
The spatial and seasonal variations, together with the tide, influence the distribution of fish larvae of the Gobiidae family in the Macaé River estuary and its coastal zone. The mouth and the coastal region showed the highest densities of fish larvae, as also reported by Faria et al. (Reference Faria, Morais and Chícaro2006) in an estuary in south-eastern Portugal. Many other studies had similar results to the present study with the greatest densities occurring on flood tides (Neira & Potter, Reference Neira and Potter1992; Sarpedonti et al., Reference Sarpedonti, Anunciação and Isaac2008; Bonecker et al., Reference Bonecker, Castro and Bonecker2009; Gomes et al., Reference Gomes, Campos and Bonecker2014) during the rainy season (Barletta-Bergan et al., Reference Barletta-Bergan, Barletta and Saint-Paul2002a; Castro et al., Reference Castro, Bonecker and Valentin2005; Vendel & Chaves, Reference Vendel and Chaves2006; Gomes et al., Reference Gomes, Campos and Bonecker2014).
ACKNOWLEDGEMENTS
The authors thank the team of the Zooplankton and Ichthyoplankton Integrated Laboratory of Federal University of Rio de Janeiro who assisted in the field and laboratory work, especially Dr Sérgio Bonecker. The authors would also like to acknowledge Cláudia Namiki for her help with fish larvae identification and Adriana Valente de Araujo for her suggestions in statistical analysis.


