


INTRODUCTION
In Mexico, the striped marlin, Kajikia audax (Phillipi, 1887), is reserved for sport fishing within 50 nautical miles of the national coastline (DOF, 2012), with Cabo San Lucas, Baja California Sur (CSL), being one of the most important sport fishing destinations in the world. During 1990–1999, the annual average number of striped marlin caught in this area was 10,475 individuals, representing ~80% of the total billfish catch, with an annual average catch rate of 0.6 fish per fishing trip (Ortega-García et al., Reference Ortega-García, Klett-Traulsen and Ponce-Díaz2003).
Despite the economic and ecological importance of this species, analyses of the feeding habits of the striped marlin in the Pacific Ocean are scarce (Hubbs & Wisner, Reference Hubbs and Wisner1953; De Sylva, Reference De Sylva1962). In Mexico, it has been reported that the striped marlin generally preys upon other pelagic fish species, including members of the families Carangidae, Clupeidae and Engraulidae, in addition to the jumbo squid, D. gigas (d'Orbigny, 1835) (Evans & Wares, Reference Evans and Wares1972; Eldridge & Wares, Reference Eldridge and Wares1974; Abitia-Cárdenas et al., Reference Abitia-Cárdenas, Galván-Magaña and Rodríguez-Romero1997, Reference Abitia-Cárdenas, Galván-Magaña and Muhlia-Melo1998, Reference Abitia-Cárdenas, Galván-Magaña, Cruz-Escalona, Peterson and Rodríguez-Romero2011). However, no published works are currently available that explore whether El Niño–La Niña events affect the diet of this species; consequently, this work analysed the changes in the food spectrum of the striped marlin in the CSL region.
MATERIALS AND METHODS
Striped marlin specimens were collected for three consecutive days of each month from 2007 to 2010 from the landings of the sport fishing fleet that operated in CSL (Figure 1, Table 1). This species is caught by trolling with artificial or live bait (such as Decapterus macrosoma Bleeker, 1851).

Fig. 1. Study area. Cabo San Lucas, Baja California Sur, the zone where the sport fishing fleet operates.
Table 1. Number of striped marlin sampled per month at Cabo San Lucas Baja California Sur during 2007–2010.

The lower jaw fork length (LJFL, nearest centimetre) and sex of each specimen were recorded. A total of 1261 stomachs were excised, frozen and transported to the laboratory. Afterwards, each stomach was examined and classified in terms of the percentage of gastric fullness (empty, 1–25, 26–50, 51–75, 76–100%). Stomach contents were placed in a strainer and washed with water to remove excess gastric fluids and then weighed to the nearest gram. The total weight of the stomach contents was measured. Accumulated items, i.e. indigestible hard parts of prey items that accumulated over time (e.g. cephalopod beaks, fish otoliths), were sorted and excluded from the analysis because they overemphasize the importance of some prey species in fish diets (Potier et al., Reference Potier, Marsac, Cherel, Lucas, Sabatié, Maury and Ménard2007).
The taxonomic determination of the stomach contents was made using specialized literature by prey type. For fish, the identification was based on the axial skeleton, mainly vertebrae, following Clothier (Reference Clothier1950), Monod (Reference Monod1968) and Miller & Jorgensen (Reference Miller and Jorgensen1973). Slightly digested fish were identified based on the keys by Allen & Robertson (Reference Allen and Robertson1994), Fischer et al. (Reference Fischer, Krupp, Schneider, Sommer, Carpenter and Niem1995) and Thomson et al. (Reference Thomson, Findley and Kerstitch2000).
Hard structures of cephalopods and crustaceans were identified by consulting the keys of Wolff (Reference Wolff1984) and Brusca (Reference Brusca1980). For each prey category, the number of specimens of each food type was determined, and the respective wet weight was recorded to the nearest 0.01 g. The quantification of prey items was based on the number of eye pairs, heads, mouthparts (jaws), telsons, otolith pairs or other anatomical structures that could serve as a reference for whole specimens.
Considering that El Niño Southern Oscillation (ENSO) could transfer its signals across the equatorial Pacific in a matter of weeks and to the mid-latitudes in a few months (Schwing et al., Reference Schwing, Mendelssohn, Bograd, Overland, Wang and Ito2010), the two environmental scenarios (El Niño, La Niña) were defined by taking into account (a) monthly standardized sea surface temperature anomalies (SSTAs) in waters off the study area according to Ortega-Garcia et al. (Reference Ortega-García, Klett-Traulsen and Ponce-Díaz2003); SSTs were inferred from monthly satellite image composites of the AVHRR (Advanced Very High Resolution Radiometer) sensor with a resolution of 1.1 km, taking into account the area of operation of the sport fishing fleet, and (b) the Oceanic Niño Index (ONI), which is the official ENSO indicator at the National Oceanic and Atmospheric Administration (NOAA) and is based on sea surface temperatures (SSTs) in the east-central tropical Pacific Ocean (http://www.cpc.ncep.noaa.gov/products/analysis_monitoring/ensostuff/ensoyears.shtml). ONI values greater than 0.5 were considered to be indicative of an El Niño event; values lower than −0.5 indicated a La Niña event. According to SST anomalies and the ONI, three cold years (2007, 2008 and 2010) and one warm year (2009) were identified, corresponding to La Niña and El Niño events (Figure 2); the marlin diet was therefore described based on these periods.

Fig. 2. Standardized sea surface temperature anomalies in waters off Cabo San Lucas, B.C.S., from 2007 to 2010.
To determine whether the number of stomachs analysed was adequate to characterize the marlin diet, the software Estimate S Win 752 (Colwell, Reference Colwell2009) was used to plot the cumulative prey curve according to Ferry & Caillet (Reference Ferry and Caillet1996).
The contribution of each food item to the diet of the striped marlin was assessed using the prey-specific index of relative importance (PSIRI) proposed by Brown et al. (Reference Brown, Bizzarro, Cailliet and Ebert2012). The abundance of a specific prey item (%APP), the mean percentage of abundance (%PAP) and the frequency of occurrence (FO) were calculated using the following equations:
Abundance of specific prey (%PNi, %PWi):
 $$\mathop {{\rm \% APP}}\nolimits_i = \displaystyle{{\sum\nolimits_{\,j = 1}^n {\% Aij}} \over {\mathop n\nolimits_i}} $$
Mean percentage of abundance (%Ni, %Wi):
 $$\mathop {\% {\rm PAP}}\nolimits_i = \displaystyle{{\sum\nolimits_{\,j = 1}^n {\% Aij}} \over n}$$
Frequency of occurrence (FO):
 $$\mathop {{\rm FO}}\nolimits_i = \displaystyle{{ni} \over n}$$
where %PAP is the abundance (number or weight) of prey i in stomach j; ni is the number of stomachs containing prey i; and n is the total number of stomachs analysed.
PSIRI was calculated using the equation:
 $$\mathop {{\rm PSIRI}}\nolimits_i = \% {\rm F}{\rm O}_i*(\% {\rm P}{\rm N}_i + \% {\rm P}{\rm W}_i)$$
where FOi is the per cent frequency of occurrence of prey i; %PNi is the per cent number of prey i; and %WNi is the per cent weight of prey i. Prey-Specific Index of Relative Importance values are expressed as %PSIRI.
The values obtained with the above equations were used to analyse the annual and monthly variation in the diet.
The variation in the number of prey items consumed annually was tested using analysis of variance (Zar, Reference Zar1999).
The numeric abundance was used to calculate the overall and annual diet breadth with Levin's standardized index (Hurlbert, Reference Hurlbert1978; Krebs, Reference Krebs1989). This index assumes Bi values are close to zero for specialist predators and close to one for generalist predators (Krebs, Reference Krebs1989).
To explore the temporal variation in the feeding habits of the striped marlin, a comparison was performed with studies carried out in two areas in the southern Gulf of California (Buenavista and CSL) by Evans & Wares (Reference Evans and Wares1972), Eldridge & Wares (Reference Eldridge and Wares1974) and Abitia-Cárdenas et al. (Reference Abitia-Cárdenas, Galván-Magaña and Rodríguez-Romero1997, Reference Abitia-Cárdenas, Muhlia-Melo, Cruz-Escalona and Galván-Magaña2002, Reference Abitia-Cárdenas, Galván-Magaña, Cruz-Escalona, Peterson and Rodríguez-Romero2011). Differences in diets were assessed using prey biomass data for prey that contributed to 5% or more of the diet (by volume and/or weight; a conversion of 1 g = 1 ml was assumed per Arizmendi-Rodríguez et al., Reference Arizmendi-Rodríguez, Abitia-Cárdenas, Galván-Magaña and Trejo-Escamilla2006).
The similarity in the diet by month was assessed using a hierarchical cluster analysis (PRIMER 6). The average group linkage method of clustering was applied. A Bray–Curtis similarity matrix was computed among months using the log (x + 1)-transformed prey-specific index of relative importance (PSIRI) (Clarke & Warwick, Reference Clarke and Warwick2001). A non-metric multidimensional scaling ordination (NMDS) (Field et al., Reference Field, Clarke and Warwick1982) was also applied to better visualize the overall pattern. The NMDS was applied to a similarity matrix computed using the Sorensen index. A three-dimensional solution was computed, and up to 2000 iterations were used to evaluate stability, with a probability of finding the same solution by chance of 0.02. Clarke & Warwick (Reference Clarke and Warwick2001) suggest that stress <0.2 corresponds to a good ordination. To test whether there were differences in prey composition among months, a 1-way layout of ANOSIM was performed. A SIMPER (similarity of percentages) analysis was performed to identify which prey items were important in discriminating among months (Clarke, Reference Clarke1993). The NMDS, ANOSIM and SIMPER were performed using the multivariate statistical software package Primer version 6 (PRIMER-E Ltd, Plymouth Marine Laboratory, Plymouth, UK).
RESULTS
Based on sea surface temperature anomalies, 2007, 2008 and 2010 were identified as years with negative anomalies (La Niña event), while 2009 was a year with positive anomalies (El Niño event) (Figure 2).
The striped marlin diet was described based on the review of a total of 1261 specimens with a mean LJFL of 173.5 ± 17.6 cm (±1 standard deviation (SD)). Stomachs of 868 (69%) specimens had food remains, and 393 (31%) were empty. Of the stomachs analysed, 33.2% had a fullness ranging from 51–75%. Eighty-nine different prey items were identified: 74 (83%) fish, nine (10%) cephalopods and six (7%) crustaceans. The cumulative curves for the prey species showed that the number of stomachs analysed for all years (2007–2010) was sufficient, with coefficient of variation (CV) values lower than 0.05 (Figure 3).

Fig. 3. Annual cumulative curve of prey in the diet of the striped marlin, Kajikia audax for the study period.
In 2007, the stomach contents of 182 specimens (LJFL = 192.1 ± 18.6 cm) were analysed. One hundred and forty-five (80%) stomachs contained food remains, and 37 (20%) were empty. Thirty-seven prey items were identified and grouped into two categories: fish (PSIRI = 67.4%, 29 species) and molluscs (PSIRI = 32.6%, 8 species). The most important prey species was the jumbo squid (D. gigas; PSIRI = 20.7%), followed by the Pacific sardine (S. caeruleus Girard, 1854; PSIRI = 19.3%), the mackerel (S. japonicus Houttuyn, 1782; PSIRI = 15.6%), cephalopods (Argonauta spp.; PSIRI = 6.8%), and the bigeye scad (S. crumenophthalmus Bloch, 1793; PSIRI = 4.7%) (Figure 4).

Fig. 4. Annual composition of the trophic spectrum of the striped marlin (Kajikia audax) in the Cabo San Lucas area, B.C.S., as the Prey-specific Index of Relative Importance (PSIRI), 2007–2010.
In 2008, the stomach contents of 204 specimens were analysed (LJFL = 180 ± 18.6 cm). The stomachs of 156 (76%) specimens contained food remains, and 48 (24%) were empty. Twenty-seven prey items were identified: 73.5% fish (20 species) and 26.5% (7) cephalopods. The most important species were the Pacific sardine (S. caeruleus; PSIRI = 27.7%), squid (D. gigas; PSIRI = 18.5%), mackerel (S. japonicus; PSIRI = 14.4%), oceanic puffer (Lagocephalus lagocephalus Linnaeus, 1758; PSIRI = 8.3%), and bigeye scad (S. crumenophthalmus; PSIRI = 6.5%).
In 2009, the stomachs of 548 specimens were analysed (LJFL = 169 ± 10.4 cm); 345 (63%) stomachs had food remains, and 203 (37%) were empty (Figure 4). Fifty-seven prey items were identified and grouped into three groups: fish (PSIRI = 78.8%, 41 species), cephalopods (PSIRI = 20.9%, 12 species) and crustaceans (PSIRI = 0.3%, 4 species). The main prey species was the sardine (S. caeruleus; PSIRI = 14.6%), followed by the jumbo squid (D. gigas; PSIRI = 12.7%), the mackerel (S. japonicus; PSIRI = 12.4%), the puffer (L. lagocephalus; PSIRI = 11.8%), the bigeye scad (S. crumenophthalmus; PSIRI = 11.4%), the green jack (Caranx caballus Günther, 1868; PSIRI = 6.7%) and scombrids (Auxis spp.; PSIRI = 3.3%).
In 2010, the stomachs of 327 striped marlins were examined (LJFL = 165 ± 16.4 cm). Of these, 222 (68%) stomachs had food remains, and 105 (32%) were empty. Forty-three prey items were identified and grouped into three groups: fish (PSIRI = 55.8%, 34 species), cephalopods (PSIRI = 43.3%, 6 species) and crustaceans (PSIRI = 0.9%, 3 species). The striped marlin was feeding mostly on two cephalopods (D. gigas, PSRI = 23.6% and Argonauta spp, PSIRI = 13.1%) and the horse mackerel D. macrosoma (PSIRI = 10.1%). Other important prey species (PSIRI < 10%) were S. japonicus, Auxis spp., Katsuwonus pelamis, and the dart squid, Loliolopsis diomedeae.
The monthly analysis of prey items revealed changes in the main prey items. In 2007, S. japonicus was the most important prey item; it was consumed for 9 months (warm and cold) and was the most important prey item in March (PSIRI = 29.1%). Dosidicus gigas was consumed for 7 months (Figure 5), but it was an important prey item in the warmer months, mainly in June (PSIRI = 68.6%).
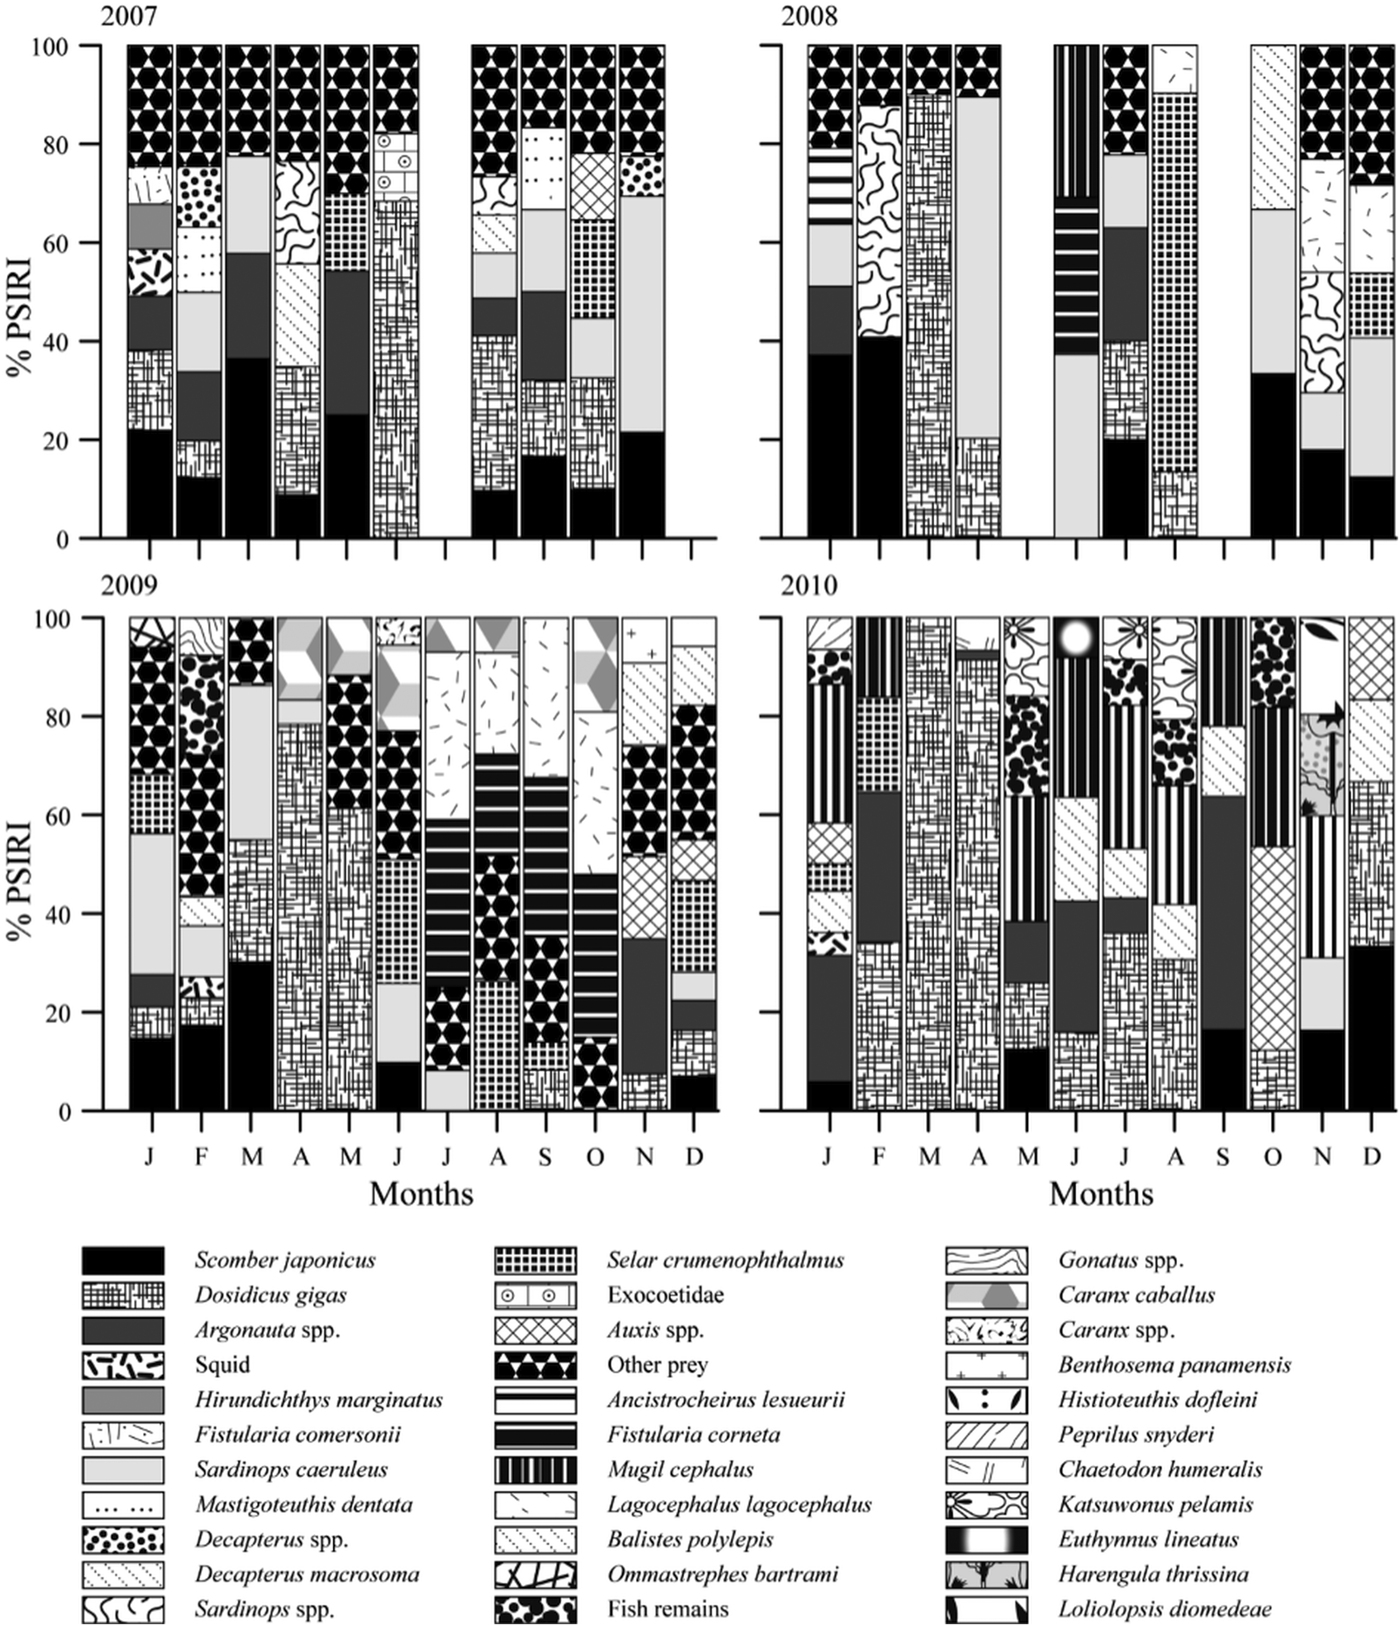
Fig. 5. Monthly variation in the main prey items in the diet of the striped marlin in 2007 to 2010, according to the Prey-Specific Index of Relative Importance (PSIRI).
In 2008, S. caeruleus was the main prey item for 7 months, being the most important prey item in April (PSIRI = 69.3%), followed by the mackerel, S. japonicus, which was consumed for 6 months and the most important prey item in February (PSIRI = 40.8%). Both prey species were consumed in cold and warm months.
In 2009, the most important prey species was D. gigas. It was identified in the stomachs collected in April and was consumed in both cold and warm months. Dosidicus gigas was the main prey item in April (PSIRI = 78.4%). The second most important prey species was S. caeruleus, which was consumed for 7 months and was the most important prey item in March (PSIRI = 31.4%). Caranx caballus and L. lagocephalus were identified in the diet in 2009; these prey items were consumed mainly in the warmer months, while S. crumenophthalmus was consumed in January.
In 2010, the fish D. macrosoma was identified in the stomach contents; it was consumed in the cold months (January, December) and in the warm months (June, July, August, September). Decapterus. macrosoma was the most important prey item in June (PSIRI = 21.0%). The squid D. gigas was identified in the stomachs for 9 months (cold and warm) and was the main prey item in April (PSIRI = 91.4%).
Based on the overall and annual niche breadth values (Bi = 0.03 and Bi ≤ 0.08), the striped marlin was characterized as a specialist predator. The analysis of variance showed significant differences in the mean annual number of prey items (F (3.44) = 3.41, P < 0.05); a large number of prey items was recorded in 2009, coinciding with the highest mean temperature values (Figure 6).

Fig. 6. Relationship of mean sea surface temperature with number of prey consumed per year (2007–2010).
Our results along with those reported in previous studies conducted in Buenavista, B.C.S. (Evans & Wares, Reference Evans and Wares1972; Eldridge & Wares, Reference Eldridge and Wares1974), and Cabo San Lucas, B.C.S. (Abitia-Cárdenas et al., Reference Abitia-Cárdenas, Galván-Magaña and Rodríguez-Romero1997, Reference Abitia-Cárdenas, Muhlia-Melo, Cruz-Escalona and Galván-Magaña2002, Reference Abitia-Cárdenas, Galván-Magaña, Cruz-Escalona, Peterson and Rodríguez-Romero2011), are shown in Table 2.
Table 2. Percentage of volume/weight of main preys (≥5%) in the stomach of the striped marlin from Buenavista and Cabo San Lucas, Mexico. Environmental conditions (normal, La Niña, El Niño) were assigned considering the Oceanic Niño Index (ONI) values recorded during sampling years in previous studies.

The analysis of similarity of the PSIRI values showed four groups. The NMDS showed that these groups were formed with a similarity of 30% and a stress of 0.17 (Figure 7). Group d was the most important because it included 26 of the 44 months analysed and presented the highest SIMPER (or similarity) value (58.96%), mainly because of the recurrence of the prey consumed over several months and years (from January to May of 2007; from August to November of 2007; January, February, April, July and October to December of 2008; January, February, March, June, November and December of 2009; and January, February, September and November of 2010). The second most important group was group c because of the similarity in the prey consumed during June 2007, March 2008, April and May 2009, and from March to December with the exception of September and November 2010. The third group, b, was formed by the similarity in the prey consumed during August 2008 and from July to October 2009. The least important group was a, consisting of prey consumed in June 2008.

Fig. 7. Non-metric multidimensional scaling (NMDS) diagram based on a Bray–Curtis similarity matrix of log-transformed abundances. Distances of points represent relative similarity in preys. Symbols represent each groups of months. The ellipses are drawn around percentages of similarity of Bray–Curtis to 30%.
Significant differences among groups were found (ANOSIM, r = 0.63, P < 0.05). The SIMPER analysis showed that group d had a similarity of 58.96%; the prey items that defined this group were S. japonicus (40.53%), S. caeruleus (24.65%), Argonauta spp. (13.43%) and D. gigas (13.22%). The similarity in the diet of group c was 45%; the prey items that defined this group were D. gigas (84.17%), fish remains (4.34%) and D. macrosoma (4.17%). The similarity in group b was 52.21%; the prey items that defined this group were Lagocephalus lagocephalus (62.54%), C. caballus (14.57%) and S. crumenophthalmus (14.52%). Group a consisted of only three prey species of tropical affinity. It is important to mention that this group consisted of a single month (June 2008) with negative anomalies (−0.3); however, the anomalies were positive in the following months, so this could be considered a transitional month.
DISCUSSION
The convergence of surface waters from the California Current System, the Eastern Tropical Pacific System and the Gulf of California System promote the formation of oceanic fronts in the southern part of the Gulf of California (Castro et al., Reference Castro, Gómez and Klett1996, Reference Castro, Mascarenhas, Durazo and Collins2000; Lavín et al., Reference Lavín, Badan and Beier1997). These fronts promote high productivity within the Gulf, hence favouring the striped marlin population that inhabits this ecosystem (Abitia-Cárdenas, Reference Abitia-Cárdenas1992).
The striped marlin population achieves its highest abundance in the Gulf of California during late autumn and winter (Ortega-Garcia et al., Reference Ortega-García, Camacho-Bareño and Martínez-Rincón2015). In addition, spawning events have also been recorded in this area, hence the importance of the Gulf of California as a major feeding ground for this species (Squire & Au, Reference Squire and Au1990; González-Armas et al., Reference González-Armas, Sosa-Nishizaki, Funes-Rodríguez and Levy-Pérez1999; Abitia-Cárdenas et al., Reference Abitia-Cárdenas, Muhlia-Melo, Cruz-Escalona and Galván-Magaña2002).
Ovchinnikov (Reference Ovchinnikov1970) reported the relationship between variation in the percentage of gastric repletion and the daytime hours when fish feed; based on these results, it can be assumed that the striped marlin in the Gulf of California feeds at dawn, the time when 51–75% of the gastric repletion was observed and when prey items were partially digested. Importantly, the digestion of prey in the stomach of the striped marlin is a continuous process (Abitia-Cárdenas et al., Reference Abitia-Cárdenas, Galván-Magaña and Muhlia-Melo1998); therefore, we revised the time of capture (the fishing fleet normally operates from 6:00 am to 2:00 pm) and found that specimens caught at the beginning of the sport fishing period had high percentages of gastric repletion, supporting our conclusion.
The annual analysis of specific prey species revealed that the jumbo squid, D. gigas, was the primary prey item in 2007 and 2010, years when negative sea surface temperature anomalies occurred (La Niña event). Although the same conditions prevailed in 2008, the main food item consumed was S. caeruleus, which was also the most important prey in 2009, a year when positive anomalies prevailed (El Niño event). The main prey species in 2007 and 2010 – the jumbo squid D. gigas – is an epipelagic squid distributed in areas where upwelling events, convergences and/or fronts are common (Lavín et al., Reference Lavín, Badan and Beier1997; Bazzino-Ferreri et al., Reference Bazzino-Ferreri, Salinas-Zavala and Markaida2007). During 2007 and 2010, sea surface temperatures fluctuated between 22 and 30°C, the range reported by Ehrhardt et al. (Reference Ehrhardt, Jacquemin, González, Ulloa, García, Ortiz and Solís1982) for the distribution of D. gigas in the Gulf of California (16–30°C). Waluda & Rodhouse (Reference Waluda and Rodhouse2006) reported that favourable conditions for the jumbo squid along the Peruvian coast occur at temperatures between 17 and 22°C, associated with the rise in upwelling intensity during La Niña events. On the other hand, Salinas-Zavala & Manzano-Sarabia (Reference Salinas-Zavala and Manzano-Sarabia2007) reported that the presence of the jumbo squid in upwelling areas is related to periods of high food availability, when it feeds on the red crab, Pleuroncodes planipes (Stimpson, 1860), in waters off the coast of the western Baja California peninsula (Salinas-Zavala et al., Reference Salinas-Zavala, Bazzino-Ferreri, Camarillo-Coop, Rosas-Luis, Mejía-Rebollo, Ramos-Castillegos, Gaxiola-Castro and Durazo2010). This crustacean is highly abundant throughout the year, being available for various predators (Salinas-Zavala et al., Reference Salinas-Zavala, Bazzino-Ferreri, Camarillo-Coop, Rosas-Luis, Mejía-Rebollo, Ramos-Castillegos, Gaxiola-Castro and Durazo2010), and could foster the presence of the jumbo squid in waters off CSL. Therefore, these prey–predator relationships and the increase in primary production during cold periods favoured the presence and abundance of the striped marlin in the study area.
During 2008 (negative anomalies) and 2009 (positive anomalies), the jumbo squid was the second most consumed prey item, with PSIRI values of 18.5 and 12.7% respectively. The presence of this squid in cold (La Niña) and warm (El Niño) periods can be attributed to the ability of this species to withstand broad temperature ranges (Yatsu et al., Reference Yatsu, Yamanaka and Yamashiro1999; Nevárez-Martínez et al., Reference Nevárez-Martínez, Hernández-Herrera, Morales-Bojórquez, Balmori-Ramírez, Cisneros-Mata and Morales-Azpeitia2000). According to our results, temperature variations (La Niña and El Niño events) do not affect the availability of the jumbo squid for the striped marlin in CSL waters, although El Niño contributes to a drop in the number of squids in this area, as it leads to lower primary productivity (Chávez et al., Reference Chávez, Pennington, Castro, Ryan, Michisaki, Schlining, Walz, Buck, McPhaden and Collins2002).
In 2008 and 2009, the food spectrum of the striped marlin mainly included S. caeruleus, locally known as the Pacific sardine. This is a pelagic fish species that lives near the coast in large schools (Fischer et al., Reference Fischer, Krupp, Schneider, Sommer, Carpenter and Niem1995). In the present work, up to 44 sardine specimens were found in a single marlin stomach; this result is consistent with that reported by Abitia-Cárdenas et al. (Reference Abitia-Cárdenas, Muhlia-Melo, Cruz-Escalona and Galván-Magaña2002), who mentioned that this predator fed on species that tend to form schools, such as D. gigas, S. japonicus and S. caeruleus. Ortega-García et al. (Reference Ortega-García, Camacho-Bareño and Martínez-Rincón2015) reported exceptional sardine catches in waters adjacent to the Golden Gate Bank during these years. Such catches were explained as resulting from the interaction between two factors: high chlorophyll-a concentrations during May and June 2008 despite abnormally high SSTs and a negative phase of the PDO that occurred during this period associated with an increase in coastal upwelling events, according to Goericke et al. (Reference Goericke, Bograd, Gaxiola-Castro, Gomez-Valdes, Hooff, Huyer, Hyrenbach, Lavaniegos, Mantyla, Peterson, Schwing, Smith, Sideman, Venrick and Wheeler2004).
Previous reports on the trophic spectrum of the striped marlin have listed the Pacific sardine (Abitia-Cárdenas et al., Reference Abitia-Cárdenas, Galván-Magaña and Rodríguez-Romero1997, Reference Abitia-Cárdenas, Muhlia-Melo, Cruz-Escalona and Galván-Magaña2002, Reference Abitia-Cárdenas, Galván-Magaña, Cruz-Escalona, Peterson and Rodríguez-Romero2011) and the jumbo squid (Evans & Wares, Reference Evans and Wares1972; Eldridge & Wares, Reference Eldridge and Wares1974) as prey. Our results suggest variation in the abundance and availability of the Pacific sardine in the study area, at least during the period analysed, which can be attributed to three factors: fishing intensity, recruitment and environmental changes (Radovich, Reference Radovich1982). Variation in the abundance of minor pelagic stocks is clearly related to environment fluctuations: during El Niño events, the distributions of minor pelagic fish tend to concentrate in small regions adjacent to the coast (Lluch-Belda et al., Reference Lluch-Belda, Lluch-Cota, Hernández-Vázquez, Salinas-Zavala and Schwartzlose1991). Based on this hypothesis, our results suggest that from 2007 (La Niña) to 2009 (El Niño), the Pacific sardine was available for the striped marlin and that variations in temperature did not affect its presence around CSL. One of the characteristics of the Pacific sardine is its plasticity, which allows it to respond rapidly to environmental conditions (Melo-Barrera et al., Reference Melo-Barrera, Félix-Uraga and Quiñónez-Velázquez2010); however, warm periods may increase its abundance.
The Pacific sardine was the main prey during 2008 (PSIRI = 27.7%). This result suggests that during La Niña events (negative anomalies), environmental conditions are favourable for the Pacific sardine, while the opposite was true during the 2009 El Niño (positive anomalies), when the contribution of the Pacific sardine dropped to a PSIRI of 13.1%. This reduction can be attributed to the influence of El Niño events on the availability and migration of the Pacific sardine in the Pacific off the coast of Bahia Magdalena, B.C.S. (Félix-Uraga et al., Reference Félix-Uraga, Alvarado-Castillo and Carmona-Piña1996). The presence of the Pacific sardine in the stomach contents of the striped marlin during a warm event can be attributed to the fact that El Niño causes strong vertical migration of plankton (Bograd & Lynn, Reference Bograd and Lynn2001) as well as sardines (Nevárez-Martínez, personal communication) and other fish populations (Sette & Isaacs, Reference Sette and Isaacs1960; Chávez et al., Reference Chávez, Pennington, Castro, Ryan, Michisaki, Schlining, Walz, Buck, McPhaden and Collins2002) to greater depths. Consequently, these prey items are available to the striped marlin during its vertical migrations to deep water (Holts & Bedford, Reference Holts, Bedford and Stroud1990; Brill et al., Reference Brill, Holts, Chang, Sullivan, Dewar and Carey1993; Abitia-Cárdenas, Reference Abitia-Cárdenas2001). This is supported by the identification of demersal prey in the stomach contents during 2009, including Lobotes pacificus (Gilbert, 1898), Synodus scituliceps (Jordan & Gilbert, 1882) and Zu cristatus (Bonelli, 1819).
In 2009, Ophistonema libertate, Günther, 1867 (the Pacific thread herring), a species distributed in tropical waters, was recorded in the stomach contents. The presence of this species can be attributed to its preference for warm waters. Lluch-Belda et al. (Reference Lluch-Belda, Magallon and Schwartzlose1986) concluded that the Pacific thread herring broadens its habitat during El Niño events and that catches therefore increase in areas where it is not usually common. Therefore, the presence of this fish in the stomachs of marlin specimens collected in 2009 confirms that it broadens its distribution range and that the environmental conditions in the study area were warm.
When warm conditions (El Niño) occurred, the following fish species were found in the stomach contents: C. caballus, L. lagocephalus, Fistularia corneta (Gilbert & Starks, 1904) and S. crumenophthalmus. Fischer et al. (Reference Fischer, Krupp, Schneider, Sommer, Carpenter and Niem1995) reported that these fish species are distributed in our study area, forming schools. These results were related to temperatures from 23.4 to 30.5°C, suggesting that these temperatures allow a greater availability of additional prey species around CSL. Our findings coincide with those reported by Abitia-Cárdenas et al. (Reference Abitia-Cárdenas, Muhlia-Melo, Cruz-Escalona and Galván-Magaña2002) and Tripp-Valdez (Reference Tripp-Valdez2005) for the same study area during the warm months, where C. caballus, F. corneta and S. crumenophthalmus were identified in the stomach contents.
The feeding habits of the striped marlin remained unchanged for a long period of time from 1972 to 2010 (Evans & Wares, Reference Evans and Wares1972; Eldridge & Wares, Reference Eldridge and Wares1974; Abitia-Cárdenas et al., Reference Abitia-Cárdenas, Galván-Magaña and Rodríguez-Romero1997, Reference Abitia-Cárdenas, Muhlia-Melo, Cruz-Escalona and Galván-Magaña2002, Reference Abitia-Cárdenas, Galván-Magaña, Cruz-Escalona, Peterson and Rodríguez-Romero2011). These results suggest that CSL is a key area in the Pacific that increases the availability and abundance of prey due to the presence of ocean fronts that lead to a rise in biological productivity, producing food for predators such as the striped marlin (Abitia-Cárdenas, Reference Abitia-Cárdenas2001).
The mackerel, S. japonicus, was part of the food spectrum during the whole study period (2007–2010); this finding suggests that this species is unaffected by temperature changes, probably due to the mackerel being a predominantly coastal pelagic species (Fischer et al., Reference Fischer, Krupp, Schneider, Sommer, Carpenter and Niem1995). A single stomach contained up to 18 specimens of S. japonicus, suggesting that the striped marlin consumes prey that form schools such as S. japonicus (Allen & Robertson, Reference Allen and Robertson1998).
The largest number of stomachs (54) were collected in January 2009, coinciding with the maximum number of prey consumed (28 food items); this same number of prey items occurred again in January 2010. The mean temperature was 24°C in January of both years, which suggests that the maximum number of prey species in CSL occurs at this temperature. In the same area, Abitia-Cárdenas et al. (Reference Abitia-Cárdenas, Muhlia-Melo, Cruz-Escalona and Galván-Magaña2002) found that the striped marlin consumed the largest number of prey (24) in February 1995. Based on the diet breadth, we found that the striped marlin displayed specialist behaviour, which is supported by the high consumption of three main prey species: D. gigas, S. caeruleus and S. japonicus. This result differs from the findings by Abitia-Cárdenas et al. (Reference Abitia-Cárdenas, Galván-Magaña and Rodríguez-Romero1997), who reported that the striped marlin showed a generalist spectrum, as it consumed both pelagic and oceanic prey. Abitia-Cárdenas et al. (Reference Abitia-Cárdenas, Galván-Magaña, Cruz-Escalona, Peterson and Rodríguez-Romero2011) reported that the striped marlin in the area of CSL fed mostly on three prey groups, in the following order of importance: fish, cephalopods and crustaceans. These prey species are available and abundant in CSL. In addition, during the study period, the striped marlin consumed a greater number of fish. Based on the results reported here, the striped marlin, Kajikia audax, can be considered a biological sampler of its prey in waters of this region.
Group d was comprised of 14 months with negative SST anomalies and 12 months with positive anomalies. These months were mainly grouped by the recurrence of the prey species S. japonicus, which was consumed in 23 of the 26 months that form this group, confirming that this is a species that tolerates changes in temperature, which was suggested by García-Franco et al. (Reference García-Franco, Cota-Villavicencio and Sánchez-Ruiz2001). Other species that contributed to this group were S. caeruleus, Argonauta spp. and D. gigas, which were recorded in both warm and cold months, suggesting that these species tolerate or are adapted to wide SST ranges. This capacity has been reported for D. gigas by Nevárez-Martínez et al. (Reference Nevárez-Martínez, Hernández-Herrera, Morales-Bojórquez, Balmori-Ramírez, Cisneros-Mata and Morales-Azpeitia2000) and for S. caeruleus by Melo-Barrera et al. (Reference Melo-Barrera, Félix-Uraga and Quiñónez-Velázquez2010). Although there are no previous studies that document tolerance to temperature changes for the genus Argonauta, Guerra et al. (Reference Guerra, González and Rocha2002) found that the species Argonauta argo (Linnaeus, 1758) is a poikilothermic organism, and it can therefore be suggested that Argonauta spp. in our study area also tolerate changes in temperature, which is why they were part of this group.
Argonauta spp. were the third most important prey item of group d, and this was also recorded during both warm and cool SST anomalies, similarly to what was previously reported by Arizmendi-Rodríguez et al. (Reference Arizmendi-Rodríguez, Abitia-Cárdenas, Galván-Magaña and Trejo-Escamilla2006). These authors found that this cephalopod genus was part of the trophic spectrum of sailfish during the years 2002 and 2003, years of positive and negative SST anomalies. Additionally, Evans & Wares (Reference Evans and Wares1972) reported that this cephalopod genus was consumed by striped marlin and sailfish in 1967 and 1968, when normal conditions were recorded. Eldridge & Wares (Reference Eldridge and Wares1974) recorded this genus as part of the trophic spectrum of striped marlin during 1970, when La Niña conditions dominated. Our results and those of previous studies showed that Argonauta spp. were part of the predators' diets during normal, La Niña and El Niño conditions, which indicate that this species can tolerate wide SST changes.
Groups c and d overlapped in the NMDS diagram due to similarities in the consumed prey in months when either negative anomalies (April 2007 and June, July, August and December of 2010) and positive anomalies (February and March of 2010) were recorded. The prey items that were shared between the groups were S. japonicus, D. gigas, Argonauta spp., S. caeruleus, D. macrosoma, Auxis spp. and C. caballus. These prey items were consumed in similar quantities during those months. The presence of these prey items under both SST conditions showed that the study area is part of the area of distribution of these species, which are capable of tolerating wide temperature changes (Froese & Pauly, Reference Froese and Pauly2016).
Group b occurs only in months when positive anomalies were recorded; during this period, striped marlins mainly consumed L. lagocephalus, C. caballus and S. crumenophthalmus, organisms with subtropical habitats. In this group, it was observed that the number of individuals of the consumed prey items increased, suggesting that positive anomalies increase the abundance and availability of these prey items in the region of CSL. The month of June comprised the group in which negative SST anomalies were recorded. During this month, striped marlin consumed three prey species: S. caeruleus, F. corneta and Mugil cephalus; the latter two are species with tropical and subtropical affinities (Froese & Pauly, Reference Froese and Pauly2016). Their presence in the stomach contents in samples collected during this month could be related to the fact that positive SST anomalies were recorded in the previous month (May 2008) and that they remained positive from July 2008 to February 2009. Due to the changes in the composition of prey with different SST affinities, stomach content analysis could be used as an indicator of changes in SST in the mouth of the Gulf of California.
ACKNOWLEDGEMENTS
Our gratitude goes to the staff of the Fishes Ecology Laboratory of Centro Interdisciplinario de Ciencias Marinas (CICIMAR), where our samples were analysed. SOG is a scholar of EDI and COFAA of IPN. Thanks to María Elena Sánchez-Salazar, who contributed the English translation. Also, thanks to Carolina Minte-Vera and Eileen Murillo-Glazier for the final editing of the manuscript.
FINANCIAL SUPPORT
This study was developed within the SIP20141071 and ‘Biological studies of apex predators and their movements within the pelagic ecosystem of the Northeastern Mexican Pacific’ projects supported by the Instituto Politecnico Nacional and Marine Conservation Science Institute, respectively. We thank the anonymous reviewers for their careful reading of our manuscript and their comments and suggestions.


