INTRODUCTION
Planktonic cnidarians are important components in the pelagic environment. The group is traditionally considered among the main predators of crustaceans and fish eggs and larvae, including important commercial species. The species have varied diets, e.g. Clytia spp. and Mitrocoma spp., which are predators of other medusae (Purcell, Reference Purcell1991); the cosmopolitan Obelia spp., which concentrate bacteria by filter feeding (Boero et al., Reference Boero, Bucci, Colucci, Gravili and Stabili2007); and Aglaura hemistoma Péron & Lesueur, 1810, which is an omnivore, feeding mainly on small protists (Colin et al., Reference Colin, Costello, Graham and Higgins III2005). Whenever abundance is high, the predation pressure by planktonic cnidarians may control other prey populations (Purcell & Arai, Reference Purcell and Arai2001). Since episodes of extremely high densities are usually temporary, information about their seasonality is a key to understanding their ecological role.
Planktonic cnidarians have diverse life cycles and life-history strategies, but little is known about their specific responses to environmental variations. The sudden density changes typical of many species arouses interest in how species rapidly appear and disappear from the plankton (Boero et al., Reference Boero, Bouillon, Gravili, Miglietta, Parsons and Piraino2008). For most meroplanktonic species, the environmental cues that trigger the budding of planktonic medusae are still unknown (Mills, Reference Mills1993). For most holoplanktonic species, the density fluctuates mainly in response to prey abundance and temperature (Boero et al., Reference Boero, Bouillon, Gravili, Miglietta, Parsons and Piraino2008). Consistent species-level knowledge about the phenology of planktonic cnidarians is limited to some mid- and high-latitude locations (e.g. Williams & Conway, Reference Williams and Conway1981; Buecher et al., Reference Buecher, Goy, Planque, Etienne and Dallot1997; Licandro et al., Reference Licandro, Braconnot, Carré, Dallot, Etienne, Ibanez, Moitié and Briand2001). While in temperate ecosystems most of the seasonal density patterns of planktonic cnidarians are linked to the yearly cycles of primary production during spring and the warmer months (e.g. Mills, Reference Mills1981; Hosia & Båmstedt, Reference Hosia and Båmstedt2007; Boero et al., Reference Boero, Bouillon, Gravili, Miglietta, Parsons and Piraino2008), the hydrographic regime in subtropical regions is more dynamic and the seasonal cycles are less pronounced. Environmental factors other than light and temperature may be more important for the pulses of planktonic populations (e.g. prey availability, local hydrodynamics and salinity).
In the coastal region of the Southern Brazilian Bight (SBB) (22°00′–28°30′S), advection of oceanic nutrient-rich waters from offshore and land-drainage sources are the main fertilization processes (Castro & Miranda, Reference Castro, Miranda, Robinson and Brink1998; Castro et al., Reference Castro, Brandini, Pires-Vanin, Miranda, Robinson and Brink2006). Thus, higher zooplankton abundances are found at upwelling sites or off large estuaries (Lopes et al., Reference Lopes, Katsuragawa, Dias, Montú, Muelbert, Gorri and Brandini2006). Along the SBB, spatial patterns of planktonic cnidarians and the relationship to the major water masses have been described (Vannucci, Reference Vannucci1957; Reference Vannucci1963; Cordeiro & Montú, Reference Montú and Cordeiro1988; Mianzan & Guerreiro, Reference Mianzan and Guerrero2000; Tronolone, Reference Tronolone2007). However, few studies have investigated population dynamics, and only for hydromedusae (Vannucci, Reference Vannucci1963; Moreira, Reference Moreira1973; Navas Pereira, Reference Navas-Pereira1980) and scyphomedusae (Haddad & Nogueira, Reference Haddad and Nogueira2006; Nogueira et al., Reference Nogueira, Nagata and Haddad2010), but not for siphonophores. Spatio-temporal dynamics are still barely known locally, and the same is true for similar tropical and subtropical environments. In order to assess patterns of temporal fluctuation of plankton populations, field data such as seasonal monitoring are necessary to describe the linkages between physical processes and population dynamics, testing the predictability of the population-dynamics models, and evaluating their geographical and taxonomic applicability. This study describes the population dynamics of medusae and siphonophores on the inner shelf off the State of Paraná in southern Brazil, exploring the relationships between the distributional patterns and environmental factors such as hydrographic structure and food availability.
MATERIALS AND METHODS
Study site
The central part of the SBB off Paraná is about 200 km wide. Over the shallow shelf (~70 km from the coast, 50 m isobath), the coastal water (CW) predominates. The CW is resultant of the mixture between shelf and land-drainage waters and its characterized by high vertical mixture, and thermohaline characteristics determined by local climatology, geomorphology and seasonality (Castro et al., Reference Castro, Brandini, Pires-Vanin, Miranda, Robinson and Brink2006). Waters of oceanic origin (e.g. South Atlantic Central Water (SACW) and tropical water (TW)) may also influence the area (Castro et al., Reference Castro, Brandini, Pires-Vanin, Miranda, Robinson and Brink2006). The cool SACW is characterized by temperature and salinity below 20°C and 36.4 and the warm TW is characterized by temperature and salinity higher than 20°C and 36.4 (Castro et al., Reference Castro, Brandini, Pires-Vanin, Miranda, Robinson and Brink2006; Lopes et al., Reference Lopes, Katsuragawa, Dias, Montú, Muelbert, Gorri and Brandini2006). The area receives nutrient- and plankton-rich continental water outflow from the Paranaguá estuarine complex (PEC) and to a lesser extent from Guaratuba Bay (Lana et al., Reference Lana, Marone, Lopes and Machado2001; Fernandes & Brandini, Reference Fernandes and Brandini2004). The mean annual rainfall is about 2500 mm. A rainy season begins in late spring (December) and continues through most of the summer, followed by a dry season that begins in late autumn (June) and extends through part of the winter (August) (Brandini et al., Reference Brandini, Silva, Silva and Kolm2007). The most important meteorological process is the arrival of cold fronts, with the highest monthly frequency (five on average) in October and the lowest (three) in February (Castro et al., Reference Castro, Brandini, Pires-Vanin, Miranda, Robinson and Brink2006). Especially off the PEC, high zooplankton biomass and fish spawning activity have been recorded (Lopes et al., Reference Lopes, Katsuragawa, Dias, Montú, Muelbert, Gorri and Brandini2006).
Sampling, identification and quantification of planktonic cnidarians
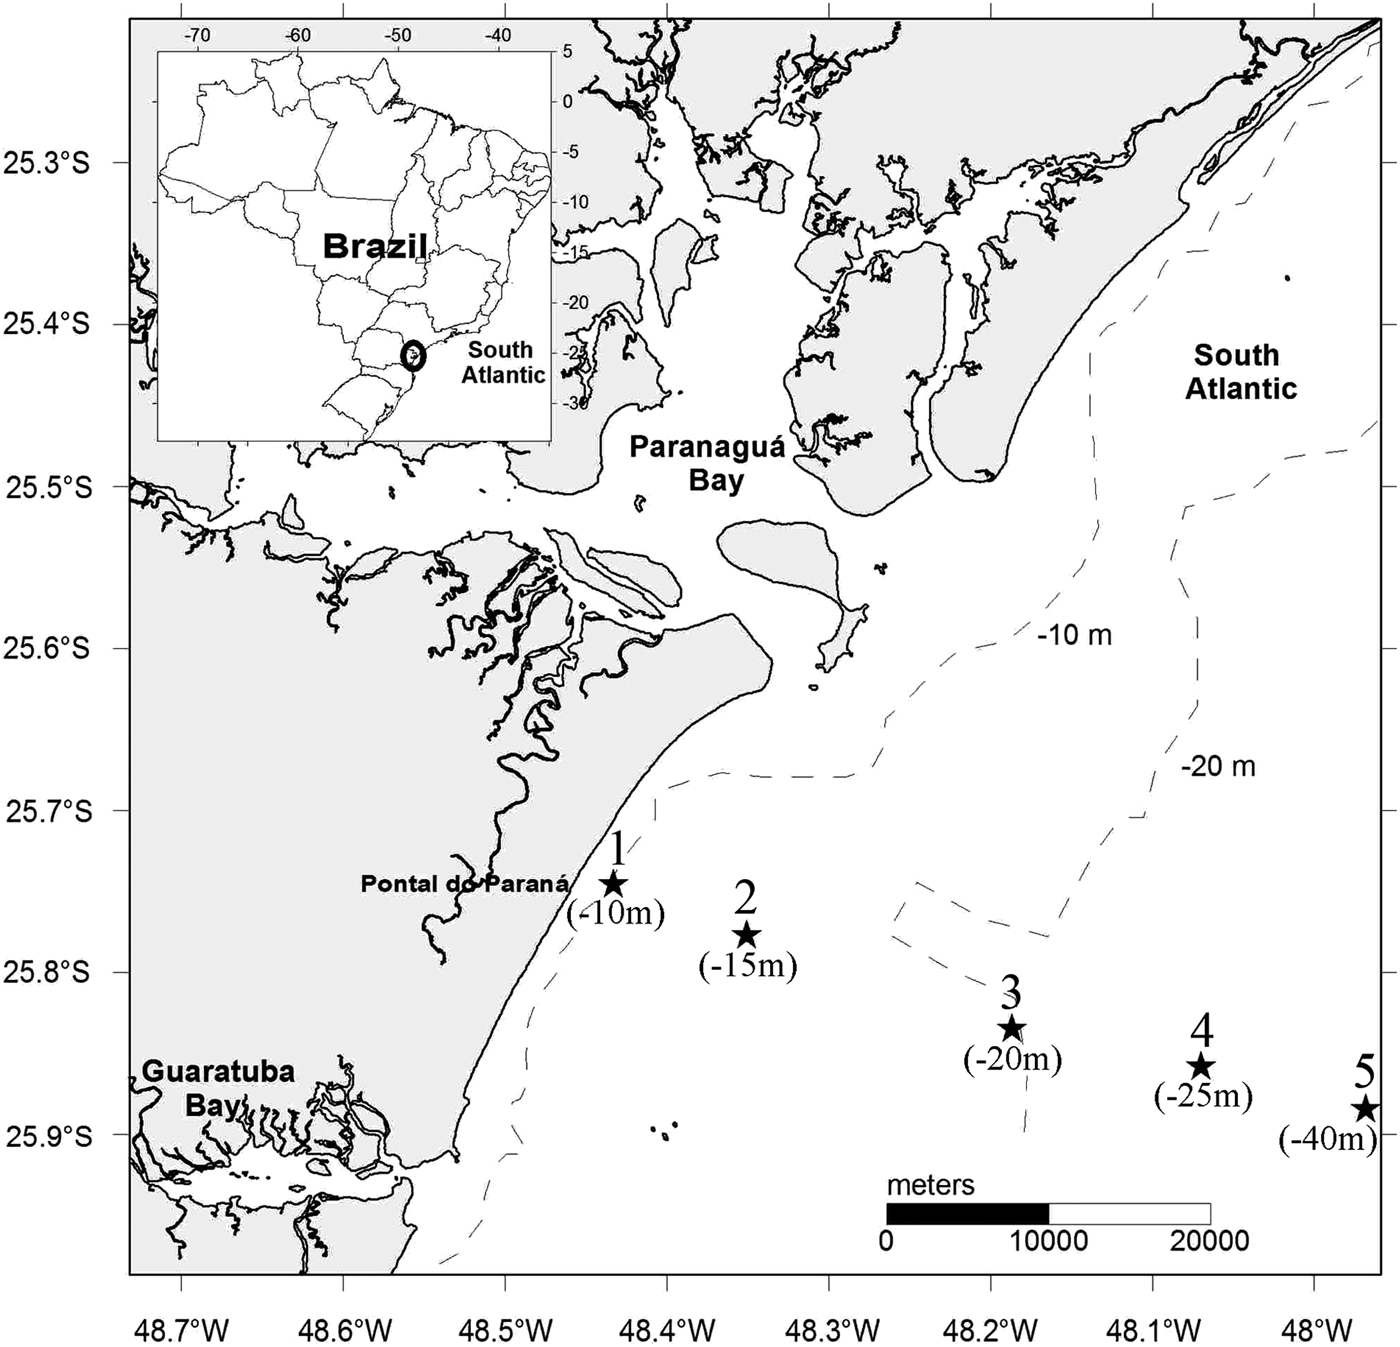
The sampling campaigns were conducted at monthly intervals, in a total of 17 cruises from November 1997 to March 1999, with the support of the Brazilian Navy lightship LB ‘Fomalhaut’. The five sampling stations were arranged along a perpendicular transect on the inner shelf (≤40 m) off Paraná (Figure 1). Because of adverse weather conditions, especially during winter, it was not possible to sample all the stations on some cruises, but samples were collected in all months.

Fig. 1. Sampling transect with the five stations and respective depths in parentheses, across the inner shelf off the State of Paraná in southern Brazil.
Descriptions of the sampling procedure for environmental parameters are available in Brandini et al. (Reference Brandini, Silva, Silva and Kolm2007). Some of these environmental data were used to explain the species distribution (see below). Plots of mean temperature and salinity of the mixed layer were constructed. Thermal and salinity stratification indices were calculated from the difference between the subsurface (<2 m depth) and the near-bottom water. The mixed layer was defined as the surficial 15 m over the thermocline that develops during warmer months (November–March), due to the bottom intrusion of the SACW over the shallow shelf (Brandini et al., Reference Brandini, Silva, Silva and Kolm2007). During the remaining period the mixed layer was defined as the entire water column because of the thermohaline homogeneity caused by the wind-driven vertical circulation (Brandini et al., Reference Brandini, Silva, Silva and Kolm2007).
Zooplankton samples were collected by vertical hauls with a plankton net with 200 μm mesh, and a 0.30 m diameter mouth opening, from 1 m above the bottom to the surface. Samples were preserved with borate-buffered 4% formalin in seawater. All the planktonic cnidarians from the total samples were counted and identified. The densities were calculated based on the length (m) of the haul and the mouth opening area (0.071 m2), assuming 100% catching efficiency. Siphonophore densities were calculated by the number of colonies (polygastric or eudoxid stages) for calycophorans (col m−3). Polygastric and eudoxid stages of M. kochi and D. bojani co-occurred mostly in similar density patterns, and the numbers of both stages were pooled. The number of colonies of the physonect Nanomia bijuga was estimated primarily by the number of pneumatophores in the sample; when this was not feasible, the nectophores were counted and the total was divided by ten. The bell diameter of the most abundant medusa was measured. Well-preserved individuals from each species were deposited in the Museu de Zoologia da Universidade de São Paulo (MZUSP 1485–1529).
Data analysis
We calculated for all species, the frequency of occurrence (FO), as the percentage of samples a given species occurred from the total, and the relative abundance (RA), as the percentage of specimens a given species accounted of the total specimens. Multivariate statistical analyses were performed with Primer v.6.1.2 (PRIMER-E Ltd, UK) and a canonical correlation analysis (CCA) was performed with Canoco v.4.5 (ter Braak & Smilauer, Reference ter Braak and Smilauer1998). For further discussion and analysis of the temporal patterns, we classify the sampling months as seasons, thus spring gathers months from November to December of 1997 and from October to December of 1998, summer, months from January to March, autumn, months from April to June and winter, months from July to September.
In order to test assemblage differences, considering spatial (sampling station), and temporal (months of the year) factors, we applied the permutation test two-way analysis of similarity (ANOSIM) without replication (P < 0.05 after 999 runs). The ANOSIM allow to test of the null hypothesis that there are no assemblage differences between groups of samples specified by the levels (sampling stations and months) of the factors (Clarke & Warwick, Reference Clarke and Warwick2001). Before the test, the densities were fourth root-transformed in order to include the rarer species, except for the ambiguous taxa (Bougainvilliidae spp., Leptothecata spp., Lovenelidae spp., Athorybia larvae, Physonectae spp., and Narcomedusae larvae) that were excluded from the analyses. The ANOSIM was applied to a similarity matrix between samples, created using the Bray–Curtis coefficient. Once we noted significant differences, we performed a one-way ANOSIM in order to estimate the differences between stations, and the similarity of percentages routine (SIMPER) (Clarke & Warwick, Reference Clarke and Warwick2001), to quantify the contribution of the species to the differences between sample groups. In this analysis, species with high values of the mean dissimilarity-to-standard deviation ratio (Diss:SD) are good discriminating species (Clarke & Warwick, Reference Clarke and Warwick2001).
To identify species assemblages with similar patterns of spatial-temporal distribution, a hierarchical cluster analysis was applied, with group average linking over the matrix of Bray–Curtis similarities between all the species (densities were 4th root-transformed). After an evaluation of the groups of species at >25% of similarity, the species not clustered within these groups were excluded from the analysis.
Plots of temperature–salinity–plankton (TSP) were constructed for the dominant species. For these plots, we calculated the mean temperature and salinity values of the entire water column, except for the surface values. In order to obtain a better correlation between the species density and temperature, we excluded from this analysis samples in which the upper and bottom temperatures differed by more than 5°C.
In order to evaluate the association between the environment variables, and the variation of the species densities, a direct gradient analysis (constrained ordination) was used. In order to decide whether to use a linear or a unimodal model we followed the guidelines provided by Leps & Smilauer (2003) and obtained a gradient length of 3.01, which is >3, and therefore a CCA was applied. In this analysis, a multiple linear regression is performed between a matrix of environmental variable values (explanatory or independent) and a matrix of species densities (response or dependent) (Legendre & Legendre, Reference Legendre and Legendre1998). We added data for mesozooplankton density, as a measure of food availability, to the matrix of environmental variables. These data represent the pooled densities of copepods and mollusc larvae estimated from aliquots of the same samples (Sartori & Lopes, Reference Sartori and Lopes2000; Ugaz-Codina, Reference Ugaz-Codina2003). Because mesozooplankton data were available only for the period between November 1997 and August 1998, we restricted our first analysis to this time interval. Only environmental variables that significantly (P < 0.05) explained part of the variation in species density (listed by the Monte Carlo test, after 999 runs) were added to the model. Since food availability was not significant to the model, the analysis was applied again, this time considering the entire sampling period. Before all analyses, the environmental variables were centred (mean = 0) and standardized by subtracting the mean from each value and dividing by the standard deviation. The ambiguous taxa mentioned above were excluded and species densities were log-transformed (log10(x + 1)). The inclusion of rarer species (FO < 10%) does not significantly change the analysis, since the CCA works fine with a matrix containing many zero values (see Attayde & Bozelli, Reference Attayde and Bozelli1998). We also keep the rarer species because they can be indicative of particular environmental conditions (see Poos & Jackson, Reference Poos and Jackson2012).
RESULTS
Hydrography
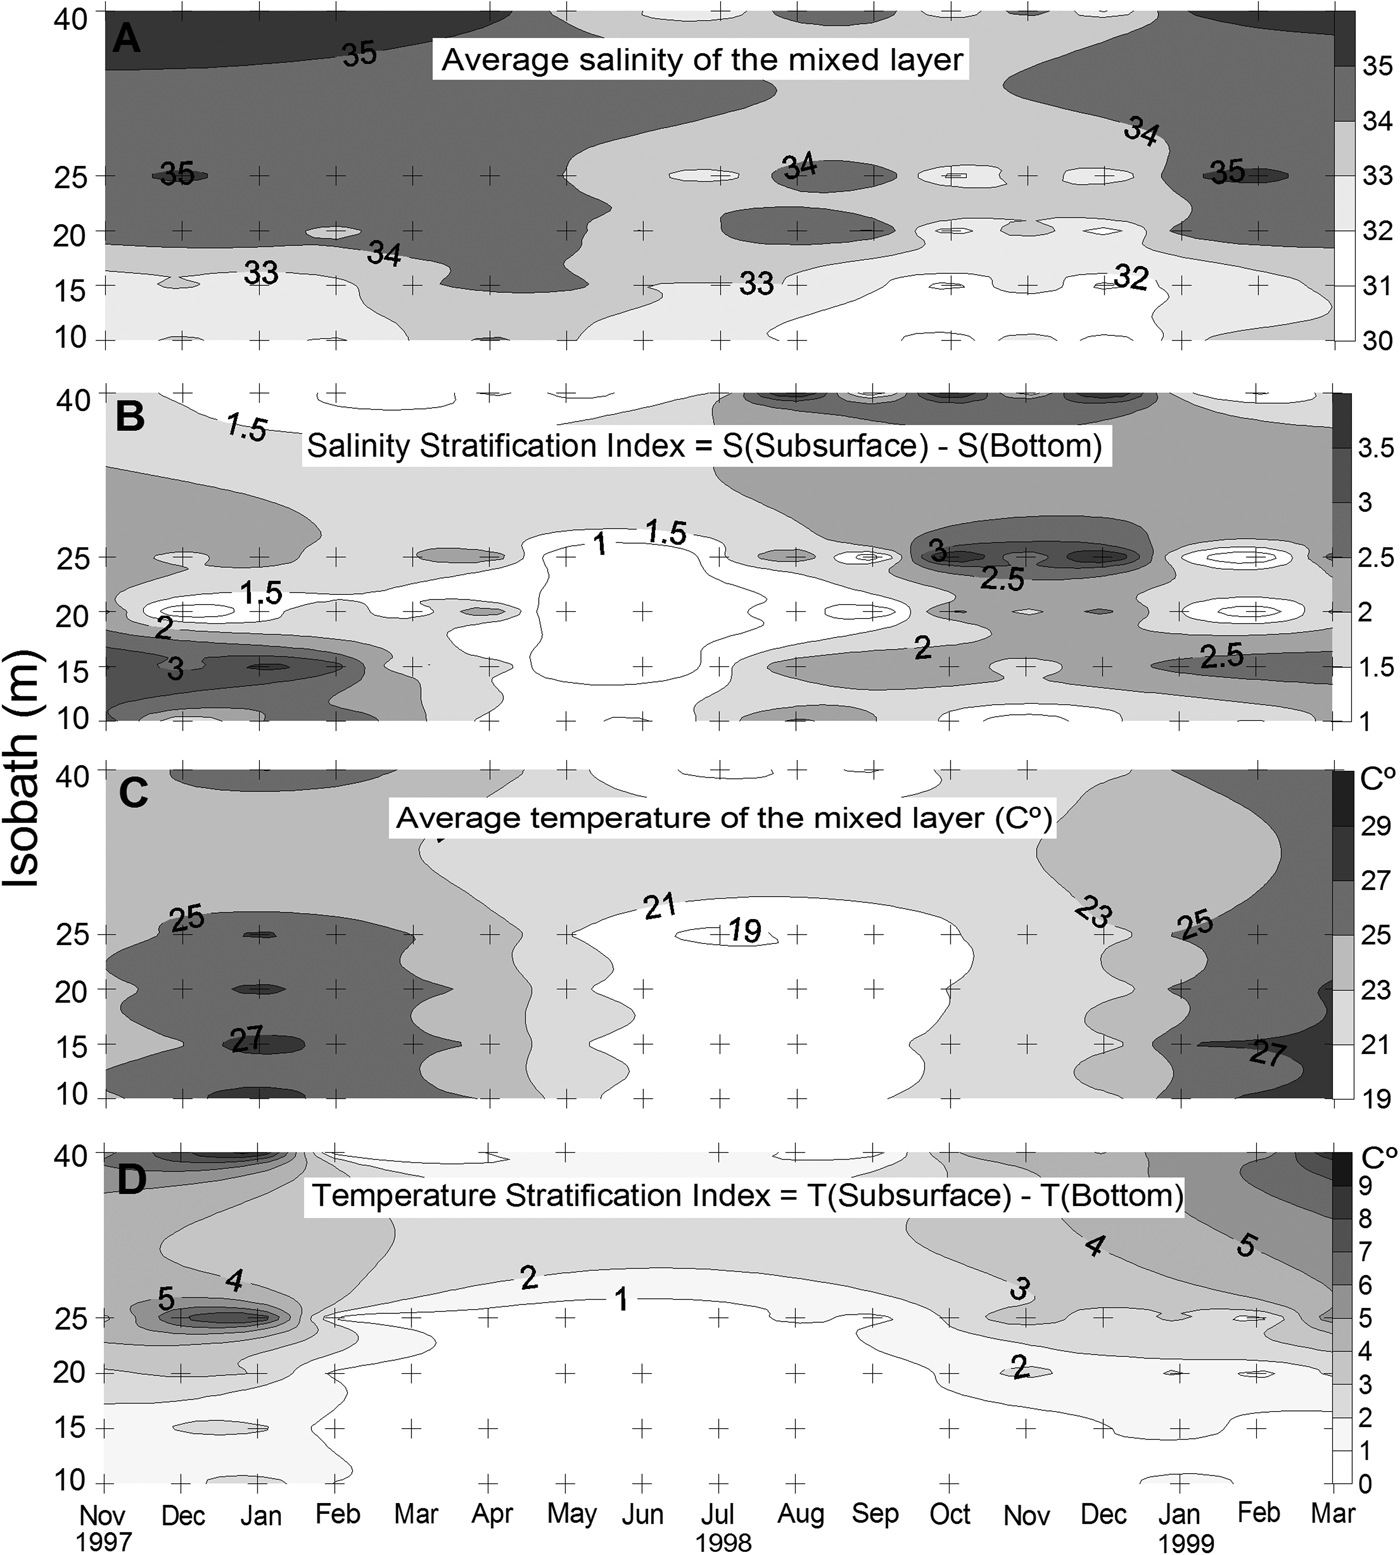
For detailed analysis of the seasonal dynamics of nutrients, chlorophyll, and other hydrographic parameters see Brandini et al. (Reference Brandini, Silva, Silva and Kolm2007). Briefly, vertical thermohaline stratifications in the warm months, from November through March, alternated with winter homogeneity from May through August (Figure 2). On a seasonal scale, the lowest water transparency and salinity were found at Stations 1 and 2 (10 and 15 m isobaths) during summers (Figure 2A), due to higher precipitation; and at Stations 4 and 5 (25 and 40 m isobaths) during winter, due to the presence of the subtropical shelf front (see Brandini et al., Reference Brandini, Silva, Silva and Kolm2007). The seasonal pattern of water temperature was well defined, with two warm and thermally stratified periods, with moderate temperatures in the mixed layer; and a cold and vertically mixed period from June through October 1998 (Figure 2C, D). At the two outer (4 and 5) stations, a thermocline developed, with vertical differences up to 8°C, in midsummer (Figure 2C, D).

Fig. 2. Spatial and temporal variation of average salinity (A) temperature (C) of the mixed layer, and of the respective stratification index (B, D) on the inner continental shelf off the State of Paraná in southern Brazil, from November 1997 to March 1999. Crosses indicate the sampling stations.
Species composition and density
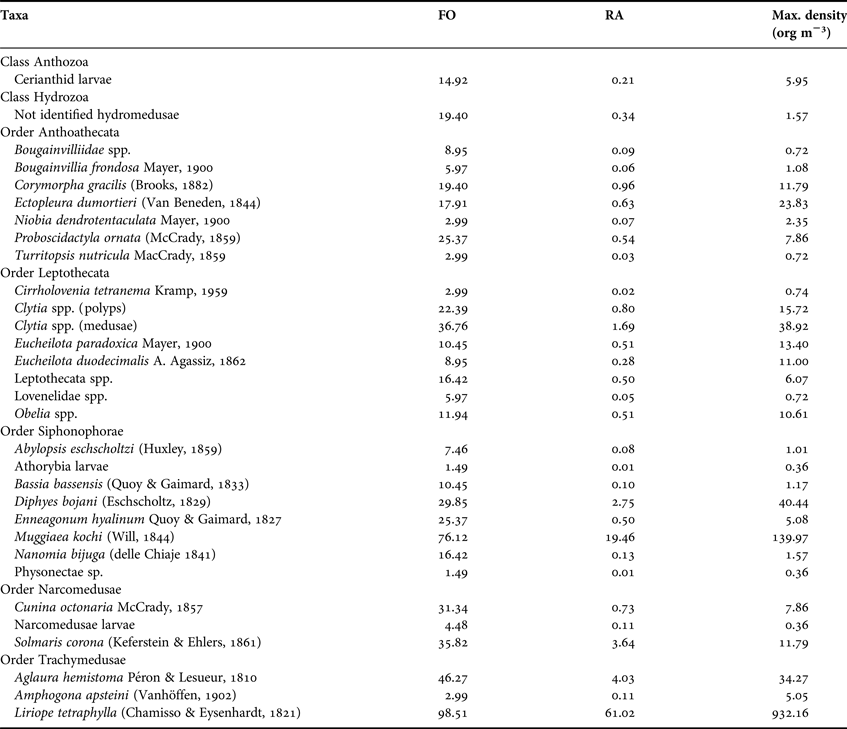
A total of 7395 hydromedusae, 2185 siphonophore colonies, and 21 cerianthid larvae were collected, belonging to 31 taxa, of which 20 were identified to species level (Table 1). The meroplanktonic orders Ceriantharia, Anthoathecata and Leptothecata were represented by 17 taxa. The holoplanktonic orders Siphonophorae, Narcomedusae and Trachymedusae accounted for 14 taxa (Table 1). The holoplanktonic Liriope tetraphylla (Chamisso and Eysenhardt,1821) (77.2% of all hydromedusae) and Muggiaea kochi (Will, 1844) (82.2% of the siphonophores) were numerically dominant.
Table 1. Taxa and their frequency of occurrence (FO), relative abundance (RA), and maximum density. The taxonomic system follows the adopted by Daly et al. (2007).

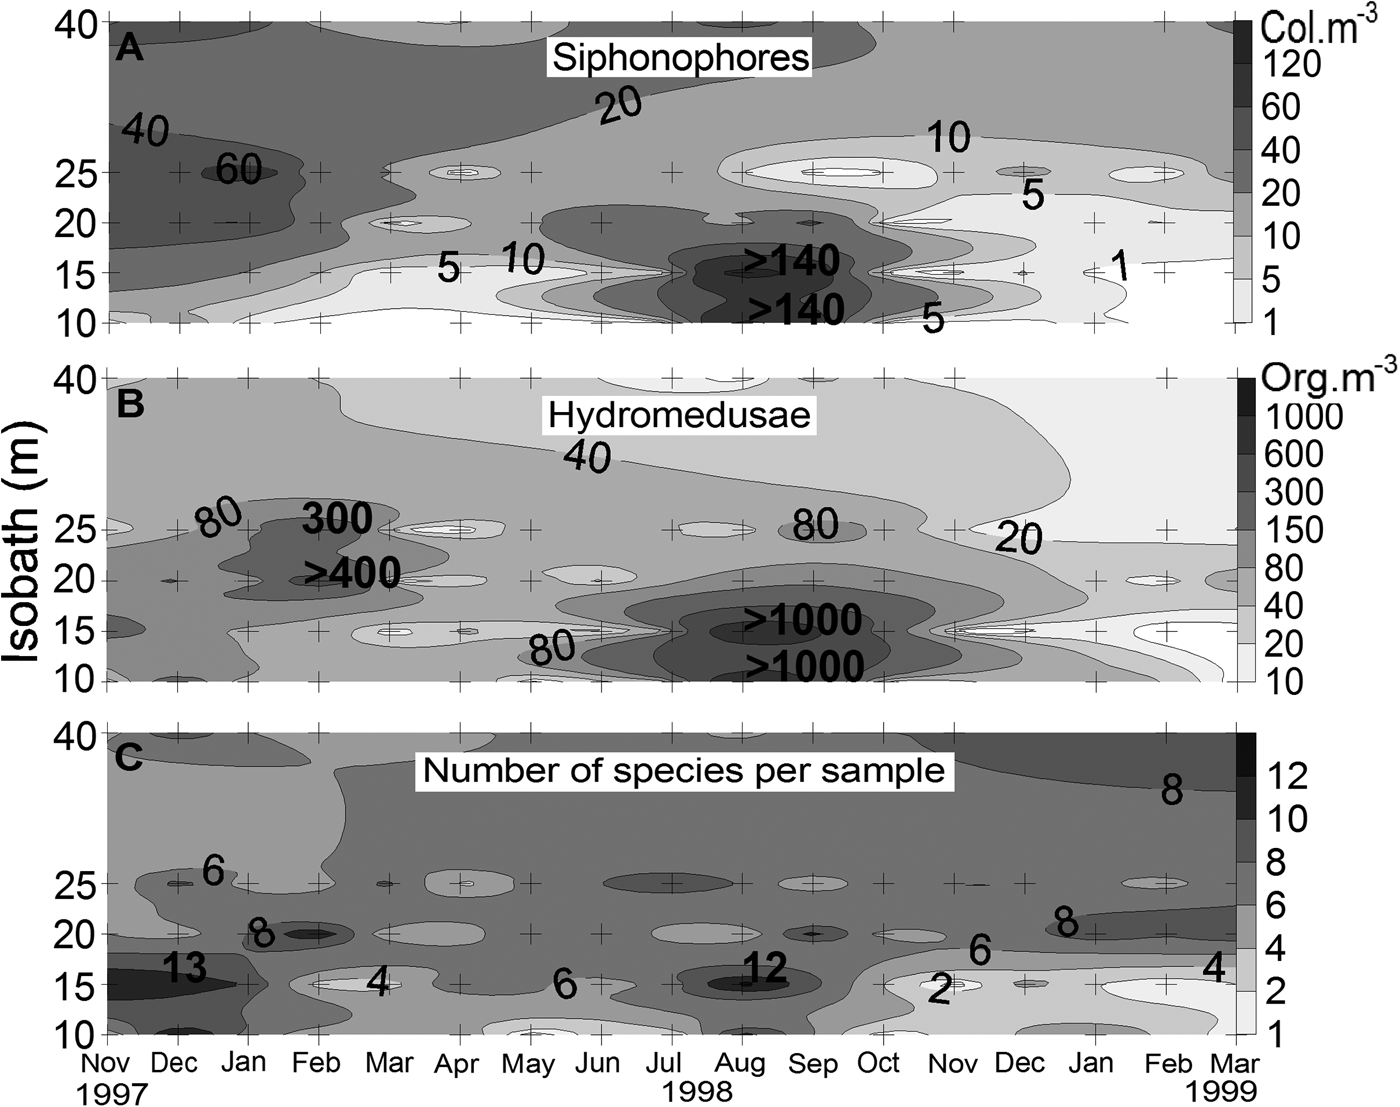
The patterns of occurrence of siphonophores and hydromedusae were somewhat similar (Figure 3), with a peak from July to October at Stations 1 and 2 (winter abundance peak), and smaller peaks from November 1997 to February 1998 (summer abundance peak) at Stations 2 and 3 (hydromedusae) and Stations 2–5 (siphonophores). Siphonophores occurred mainly at the outer Stations 3 and 4, except during the winter abundance peak, when M. kochi was abundant throughout the Stations 1−5. Densities of hydromedusae were evenly distributed along the transect, except during the two abundance peaks, when higher concentrations occurred at Stations 3 and 4 (summer) or Stations 1 and 2 (winter). The number of species per sample ranged from 0 (February 1999, Station 2) to 13 (December 1997, Station 2 and August 1998, Station 2) (Figure 3). Except in December 1997 and August 1998, higher numbers of species were usually found at Stations 3, 4 and 5.

Fig. 3. Spatial and temporal variation of the density of: (A) siphonophores; (B) hydromedusae; (C) number of cnidarian species per sample on the inner continental shelf off the State of Paraná in southern Brazil. Note that the plots are in different scales. Crosses indicate the sampling stations.
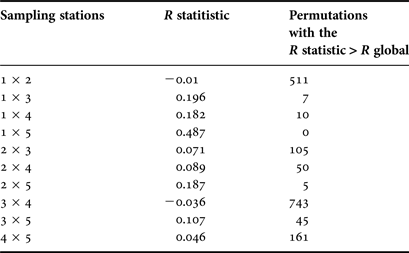
The two-way crossed ANOSIM test indicated significant differences between stations (R = 0.411; P < 0.001; t = 0/999), but not between months (R = 0.125; P = 0.14; t = 13/999). The pairwise comparisons of the one-way ANOSIM indicated a pattern of spatial structuring, with higher differences between the inner (1, 2 and 3) and outer stations (Table 2).
Table 2. Results of the analysis of similarity (one-way). Pairwise comparisons between sampling stations. Number of permutations = 999. R global (ρ) = 0.12. Permutations with the R statistic ≥R global = 0; P ≤ 0.001. The larger values of R statistic and small number of permutations with the R statistic > R global, indicates where large difference are present.

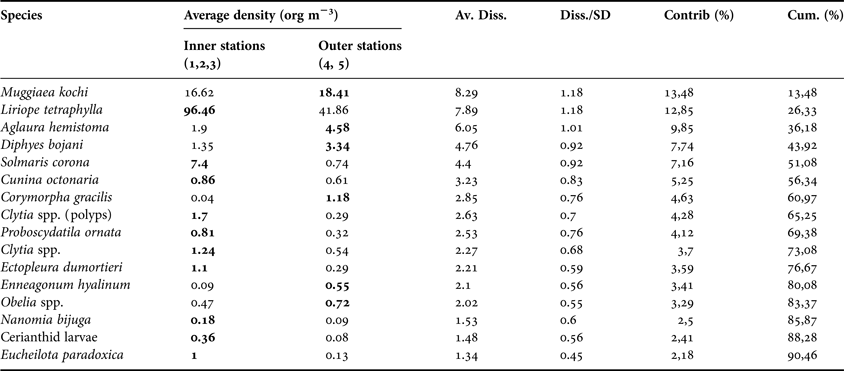
The SIMPER analysis demonstrated that the inner stations were characterized by relatively high densities of the hydromedusae L. tetraphylla, Cunina octonaria McCrady, 1857, Ectopleura dumortieri (Van Beneden, 1844), Proboscidactyla ornata (McCrady, 1859), Eucheilota paradoxica Mayer, 1900, Solmaris corona (Keferstein & Ehlers, 1861), Clytia spp. (polyps), and cerianthid larvae (Table 3). The outer stations were mainly characterized by the prevalence of the siphonophores M. kochi and Diphyes bojani (Eschscholtz, 1829) and the hydromedusae A. hemistoma and Corymorpha gracilis (Brooks, 1882). Other, rarer species occurred mainly at the two outer stations, such as the siphonophores Bassia bassensis (Quoy & Gaimard, 1833), and Enneagonum hyalinum Quoy and Gaimard, 1827 and the hydromedusae Turritopsis nutricula McCrady, 1859, Niobia dendrotentaculata Mayer, 1900, Bougainvillia frondosa Mayer, 1900, and Amphogona apsteini (Vanhöffen, 1902).
Table 3. Species contribution as average dissimilarities (Av. Diss.) to the total dissimilarities (Diss.: 61.45) between inner (1, 2 and 3) and outer (4 and 5) stations indicated by the SIMPER analysis. Species accounting to the first 90% of the dissimilarity are shown in decreasing order of percentage contribution. The higher average densities (Inner vs Outer station) for each species is in bold. Species with high values of average dissimilarity to standard deviation ratio (Diss:SD) are good discriminating species (Clarke & Warwick, Reference Clarke and Warwick2001).

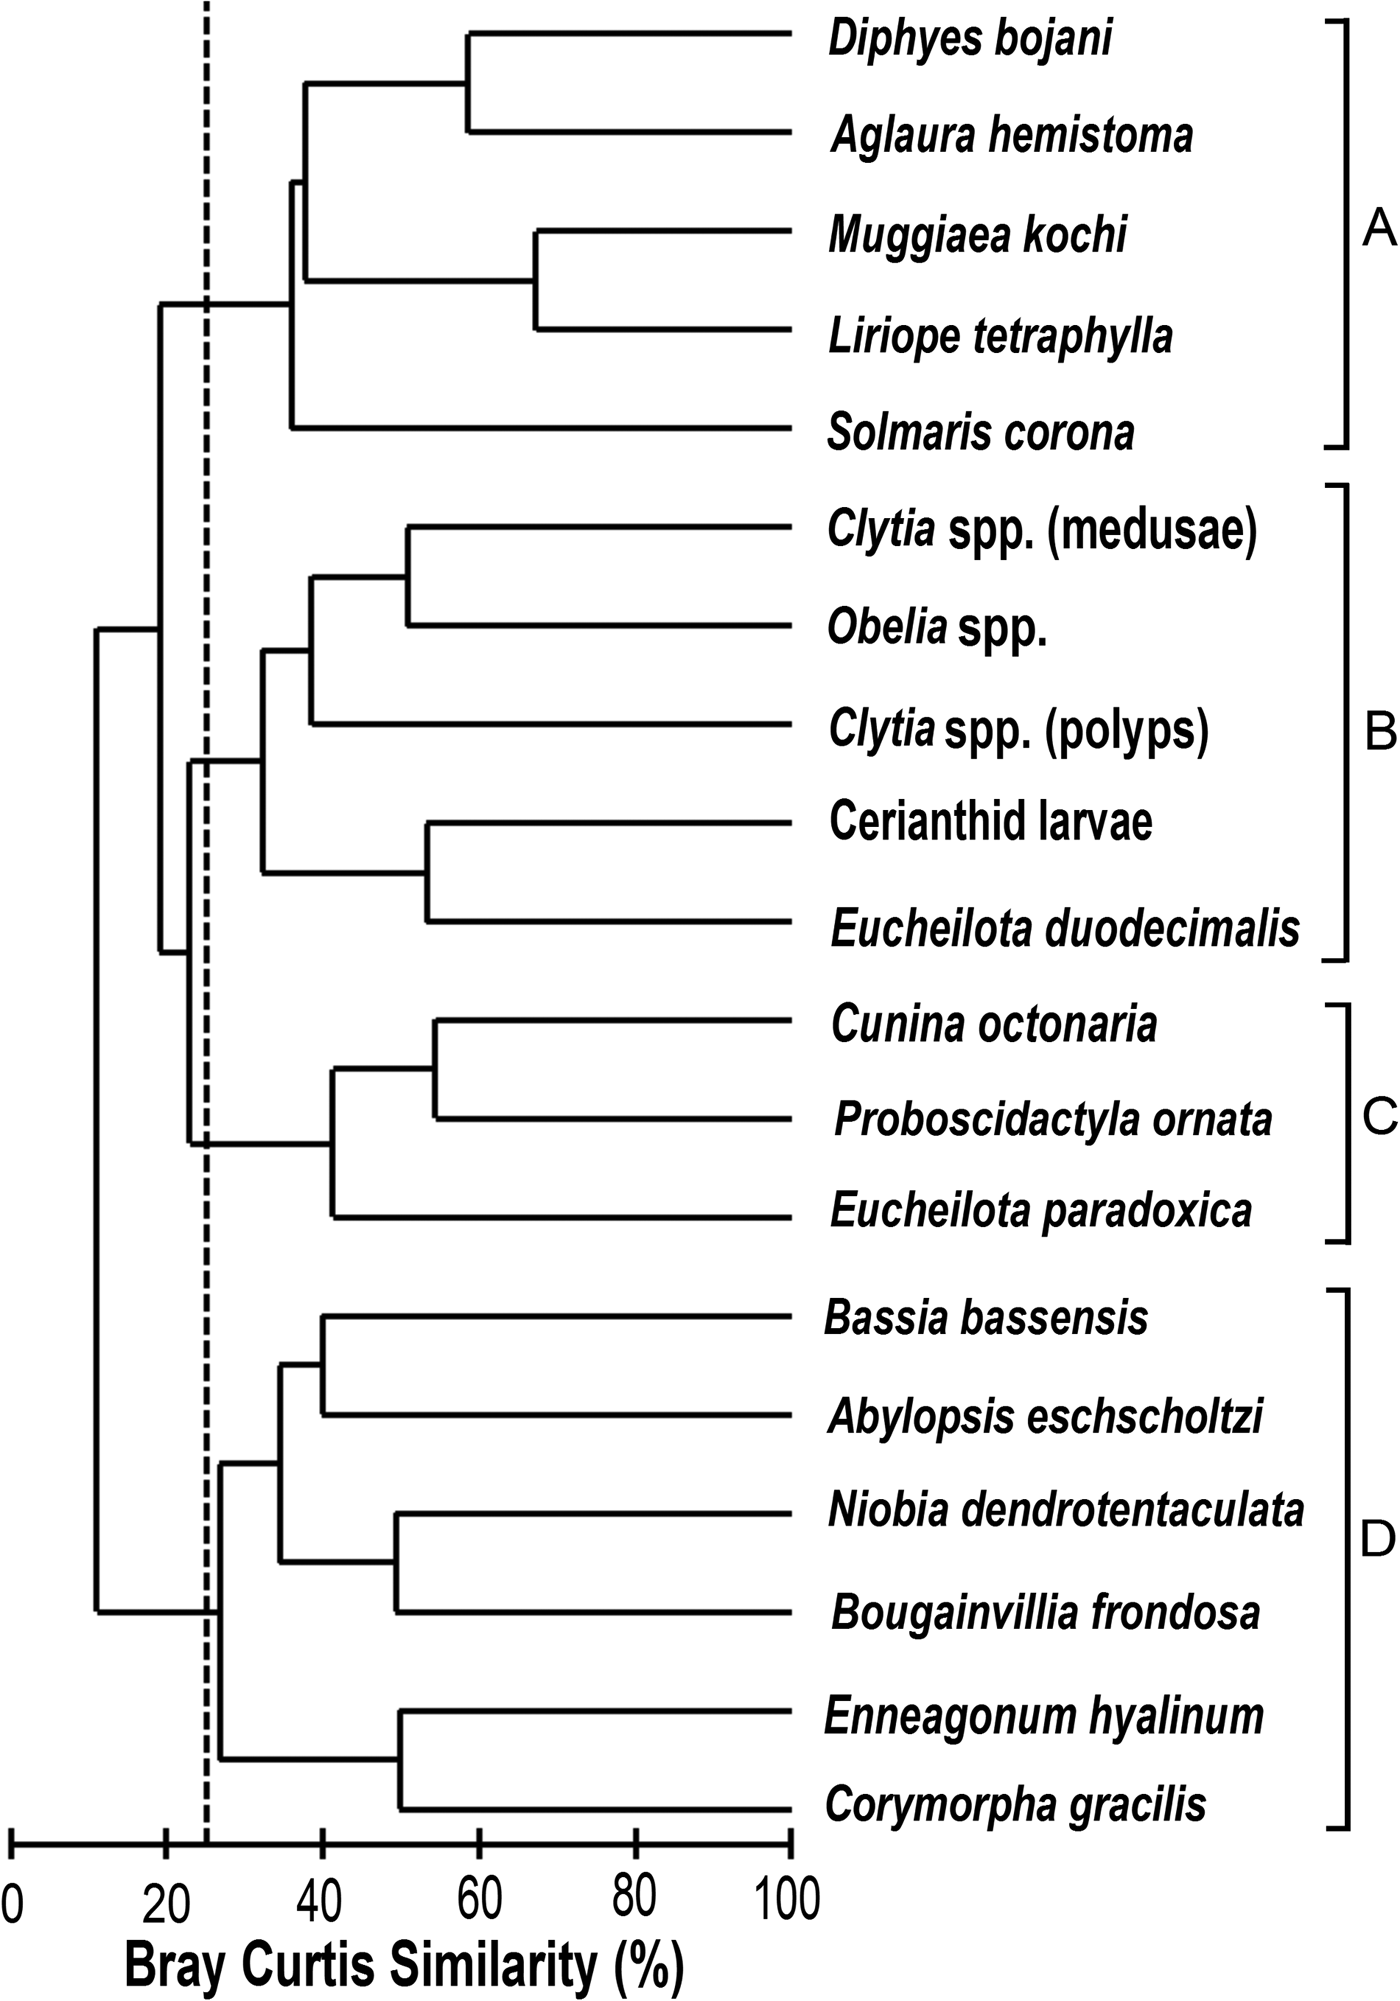
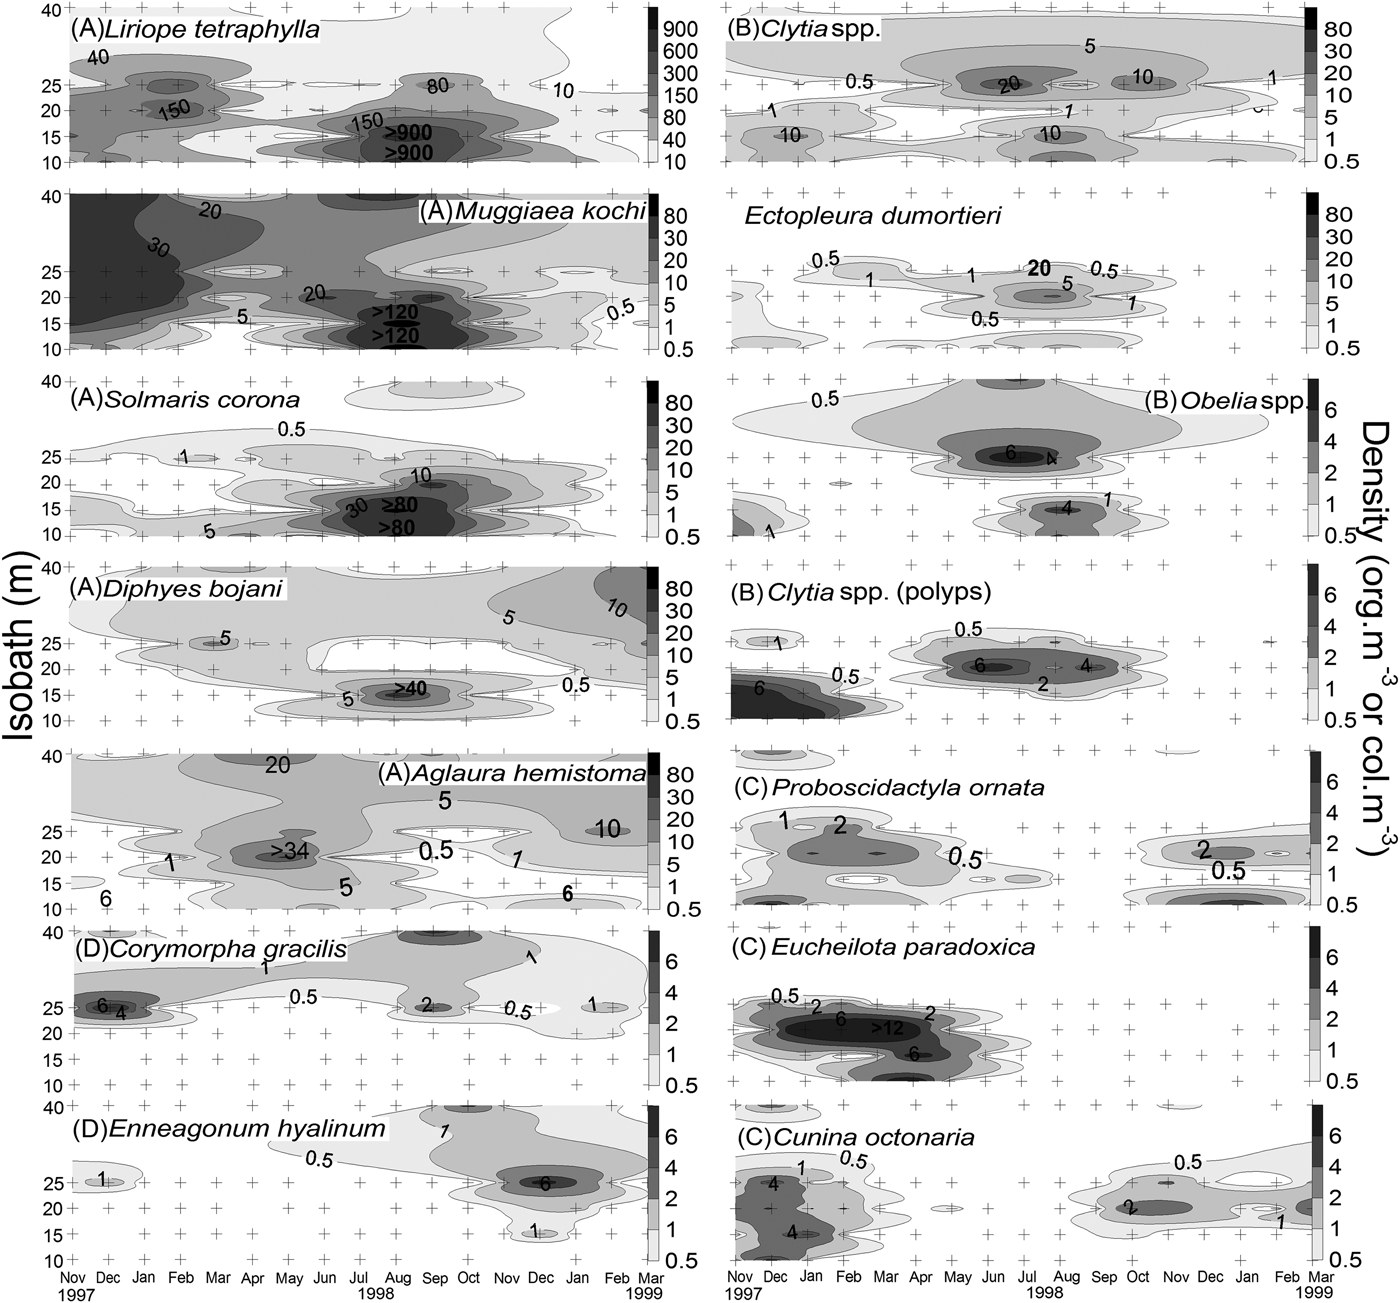
The cluster analysis showed 4 species groups at a 25% similarity level (Figure 4). Cluster ‘A’ gathered the most abundant sampled species, which peaked in August 1998 (Stations 1 and 2; Figure 5) except for A. hemistoma which peaked in May 1998. Cluster ‘B’ gathered coastal and meroplanktonic species (Figure 4). Clytia spp. (medusae), Clytia spp. (polyps), and Obelia spp. were found in both summer and winter, whereas Eucheilota duodecimalis A. Agassiz, 1862 and cerianthid larvae occurred mainly in midsummer in 1998, with a few individuals in the summer of 1999 (not shown). Cluster ‘C’ gathered E. paradoxica, C. octonaria and P. ornata, which were more common in the warmer months and at the inner (1, 2 and 3) stations (Figure 5). Cluster ‘D’ gathered species mostly found at the outermost stations, such as the rare B. bassensis, B. frondosa and N. dendrotentaculata (not shown), and Enneagonum hyalinum, Abylopsis eschscholtzi (Huxley, 1859) and C. gracilis, which were more abundant during the warm months (Figure 5).

Fig. 4. Hierarchical clustering, of the most relevant species in four resulting groups at 25% of similarity.

Fig. 5. Distribution maps of the seasonal variation of the densities of the 14 most abundant species of planktonic cnidarians across the inner continental shelf off the State of Paraná in southern Brazil, from November 1997 to March 1999. Letters in parentheses represent the groups of Figure 4. Note that the maps are in different density scales. Crosses indicate the sampling stations.
Size structure of hydromedusae population
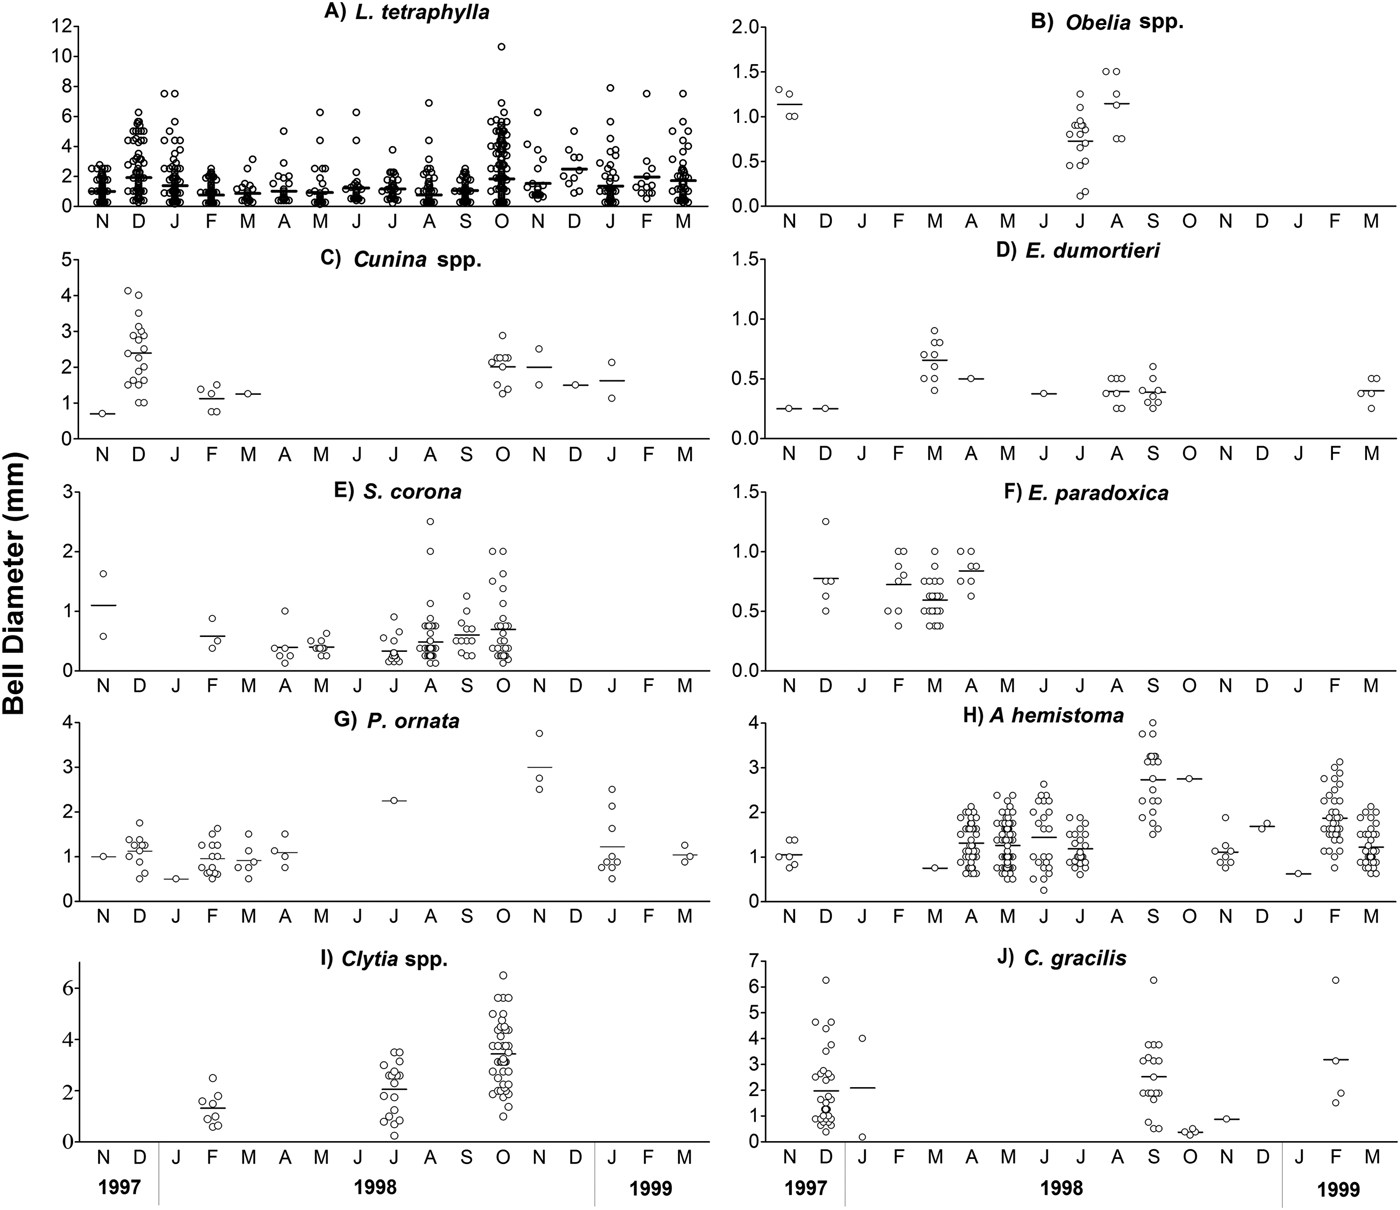
Periods of growth and recruitment for most species were indistinct during the sampling period. For L. tetraphylla (mean and range: 1.25, 0.13–10.25 mm in bell diameter) the bulk of the population (70.9%) was comprised by immature individuals (0.1–2 mm). Mature specimens (≥4 mm) occurred in higher proportions in December 1997, October and December 1998, and February and March 1999. The two population peaks coincided with the largest proportions of immatures, whereas the lowest densities coincided with the largest proportion of mature individuals (Figure 6A). Specimens of Obelia spp. (0.97, 0.75–1.6 mm), C. octonaria (2, 0.7–4.1 mm) and E. dumortieri (0.48, 0.25–1 mm) were mostly adults, with gonads (Figure 6B–D). On the other hand, specimens of S. corona (0.52, 0.13–2.5 mm) were mostly (>90%) immature, except from July to October 1998, when few adults were found (Figure 6E). All specimens of E. paradoxica (0.68, 0.37–1.25 mm), and P. ornata (1.18, 0.5–3.75 mm) were immature, most of them with medusa buds on the radial canals, and mature individuals were not observed (Figure 6F, G). No clear pattern of growth and reproduction was observed for A. hemistoma (1.45, 0.25–4 mm). All specimens of A. hemistoma ≥1.3 mm (~50% of the population) bore sausage-shaped gonads. In June 1998, two main size classes were found, juveniles (0.25–1 mm) and adults (1.63–2.63 mm). In September, only adults (1.5–4 mm) were found (Figure 6H). For Clytia spp. (2.27, 0.25−5.62 mm) and C. gracilis (0.25−6.25 mm), juveniles and adults co-occurred with no pattern of growth during the sampling period (Figure 6 I, J).

Fig. 6. Size variation of the bell diameter, and mean values (dash), of the most abundant hydromedusa species in the inner continental shelf off Paraná State, collected from November 1997 to March 1999. Note that the figures are in different scales.
Correlation of species densities with abiotic variables
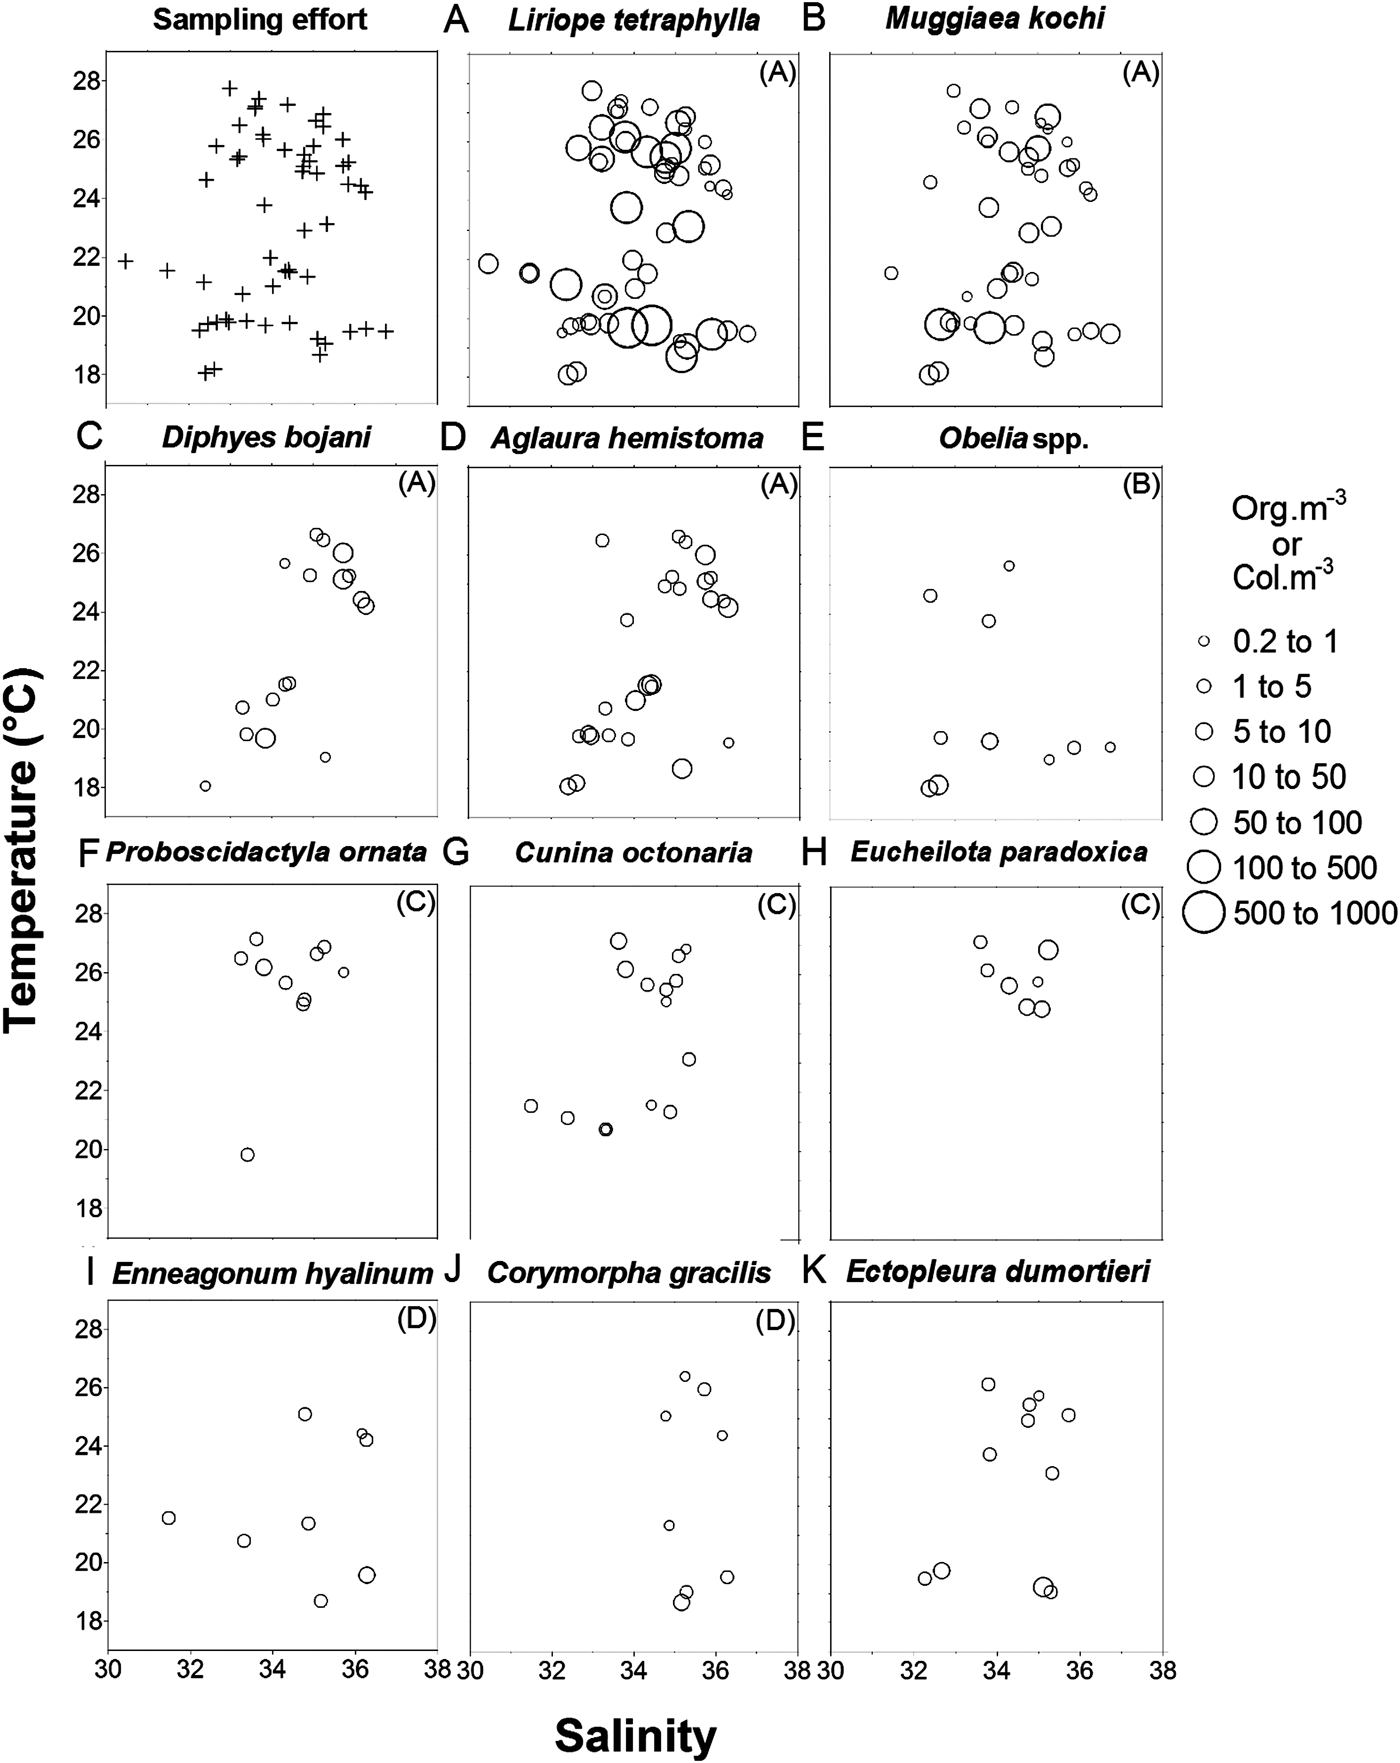
In the temperature–salinity–density plots, L. tetraphylla and M. kochi were abundant throughout the range of values (Figure 7A, B). Diphyes bojani and A. hemistoma were most abundant in salinities above 35 at higher temperatures, but without temperature preferences (Figure 7C, D). Obelia spp. densities occurred mainly in salinities below 34.5 (Figure 7E). Proboscidactyla ornata densities occurred primarily above 25.5°C and C. octonaria was found throughout the range of temperatures, but the highest densities were above 25.5°C (Figure 7F, G). Eucheilota paradoxica densities occurred within narrow temperature (24–27.5°C) and salinity (33.8–36) intervals (Figure 7H). Ennaegonum hyalinum densities occurred mainly in salinities above 34.5 and Corymorpha gracilis was absent in salinities below 35 (Figure 7I, J). Obelia spp. and E. dumortieri were found throughout the range of temperatures, but the highest densities were below 22°C (Figure 7E, K).

Fig. 7. Diagrams of temperature, salinity and density of the most abundant species. The densities (org.m−3 or col.m−3) of the species are plotted over the mean point of the values of salinity and temperature, of the water column in each station. Samples from stations in which the values of surface and bottom temperatures varied in more than 5°C, were not used in this analysis. Letters in parentheses represent the groups of Figure 4.
The Monte Carlo test of the CCA detected significant relationships (P = 0.002) between the species and five of the nine explanatory variables (bottom depth, water temperature, salinity stratification, temperature stratification and salinity); therefore, precipitation (P = 0.064) water transparency (P = 0.140), chlorophyll (P = 0.210), and dissolved oxygen (P = 0.206) were excluded from the model. The four first axes explained 20.5% of the cumulative variance in the species density (Table 4). This means that most of the variability of the species density was not explained by the measured environmental variables.
Table 4. Summary of the results of the canonical correspondence analysis (CCA) performed with the planktonic cnidarians and the five selected explanatory variables.

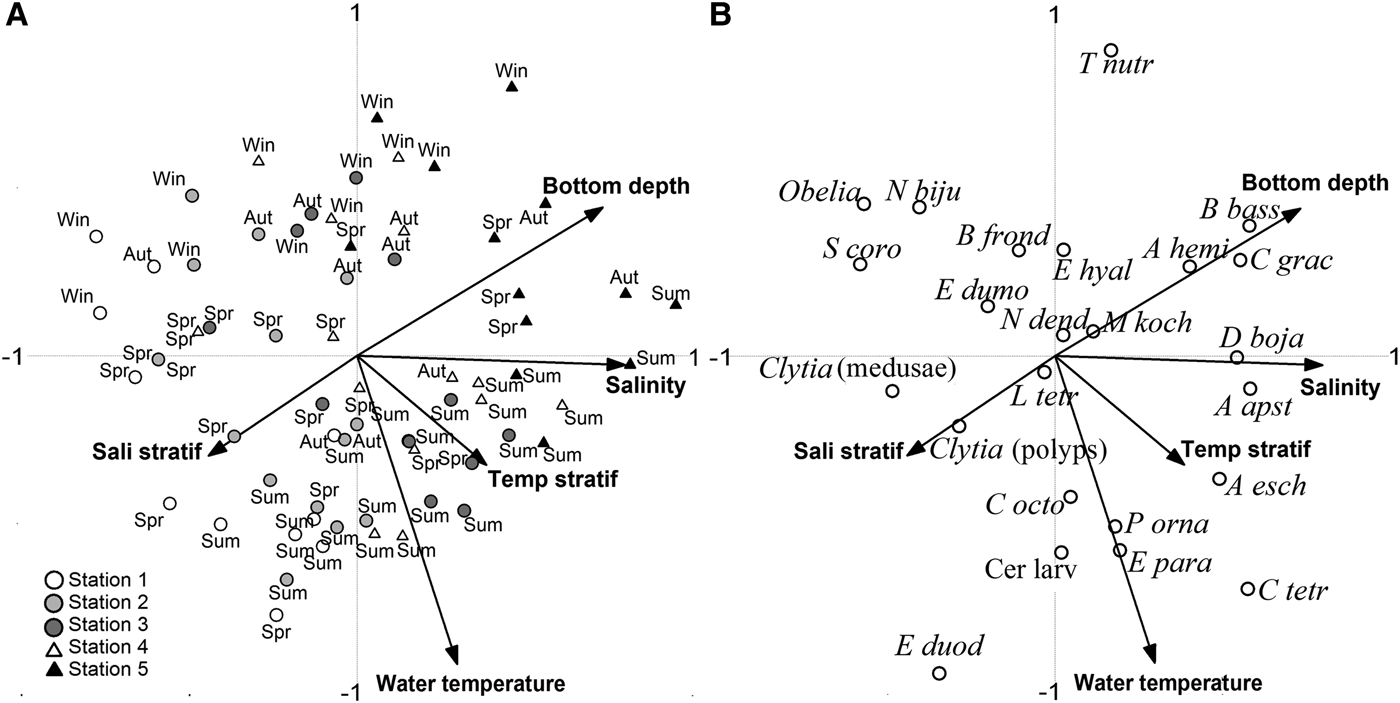
The highest collinearity between the explanatory variables was found between salinity and bottom depth (0.595). Axis 1 was positively related to salinity (0.635) and bottom depth (0.582), reflecting the spatial gradient (Figure 8A). Samples from Stns 1 and 2 (low salinity) were on the negative side of Axis 1, and those from Stns 4 and 5 on the positive side. Axis 2 was negatively related to water temperature (0.661). Samples from warm seasons were on the negative side of Axis 2, and were related to saline and temperature stratification (Figure 8A).

Fig. 8. Ordination plots of the canonical correspondence analysis: (A) relationships between the distribution of the samples over the two first Axis and the five selected explanatory variables; (B) relationships between the species and the five selected explanatory variables.
Considering the specific environmental preferences, those with weaker relationships situated close to the axes origin, such as L. tetraphylla and M. kochi, which occurred in almost all the samples with an unclear relationship to the environmental variables (Figure 8B). Corymorpha gracilis, A. hemistoma and B. bassensis were clearly associated with increasing bottom depth, and D. bojani and A. apsteini were associated to high salinities. Proboscidactyla ornata, E. paradoxica, cerianthid larvae, and C. octonaria were associated with high temperatures of late-spring and summer. On the other hand, Obelia spp., S. corona, and N. bijuga, were mainly associated with low salinities, and to a lesser extent with a shallow and cold-water environment of the late autumn and winter. Clytia spp. (polyps), Clytia spp. (medusae), and E. dumortieri, which did not occur in the samples from Station 5, had a shallow-water distribution, and the former was associated with high salinity stratification of samples with estuarine water influence (Figure 8A, B).
DISCUSSION
The community and the spatial gradient
As expected for a shallow coastal area, most of the species found here are common in coastal and estuarine waters along the SBB (Vannucci Reference Vannucci1957, Reference Vannucci1963; Navas-Pereira, Reference Navas-Pereira1980; Cordeiro & Montú, Reference Cordeiro and Montú1991; Nogueira & Oliveira Jr, Reference Nogueira and Oliveira1991; Nogueira, Reference Nogueira2012). This coastal community, formed by L. tetraphylla, S. corona, E. duodecimalis, E. paradoxica, E. dumortieri, Obelia spp. and Clytia spp. (medusae and polyps) decreased in abundance toward the outer stations.
The most abundant species, the medusa L. tetraphylla, is particularly abundant in the highly productive waters off estuaries and also within estuaries, such as Cananéia (24.5°S), Paranaguá (25°S) and Babitonga (25.5°S) bays in Brazil (Vannucci, Reference Vannucci1957; Montú & Cordeiro, Reference Montú and Cordeiro1988; Tronolone, Reference Tronolone2007; Nogueira, Reference Nogueira2012); and also in the temperate waters of the La Plata Estuary (36°S) (Zamponi & Genzano, Reference Zamponi and Genzano1994; Mianzan et al., Reference Mianzan and Guerrero2000). A few siphonophores are restricted to or prefer coastal and estuarine waters, such as M. kochi along the SBB (Abreu & Nogueira, Reference Abreu and Nogueira1989; Cordeiro & Montú, Reference Cordeiro and Montú1991; Nogueira & Oliveira Jr, Reference Nogueira and Oliveira1991; Nogueira, Reference Nogueira2012). Liriope tetraphylla and M. kochi exhibited similar patterns of spatial and temporal distribution, and may be among the most important planktonic predators in these shallow coastal waters.
Oceanic species and those from the outer/intermediate shelf represented <10% of the total. The medusae N. dendrotentaculata and T. nutricula, and the siphonophores A. eschscholtzi and B. bassensis are typical of the intermediate shelf (50–100 m isobaths) in regions of mixing between coastal and shelf waters (Vannucci, Reference Vannucci1963; Navas-Pereira, Reference Navas-Pereira1981; Cordeiro & Montú, Reference Cordeiro and Montú1991; Tronolone, Reference Tronolone2007). We found a clear preference for the Stations 4 and 5 by C. gracilis; however, its preference for shelf waters, as previously suggested for the SBB (Vannucci, Reference Vannucci1957, Reference Vannucci1963; Tronolone, Reference Tronolone2007; this study) contrasts with several occurrences in the estuarine waters of Sepetiba Bay (22.5°S), Paranaguá Bay (25°S) and Babitonga Bay (26°S), where it was found in salinities ≥22 (Montú & Cordeiro, Reference Montú and Cordeiro1988; Navas Pereira, Reference Navas-Pereira1980; Nogueira, Reference Nogueira2012). Proboscidactyla ornata is also traditionally considered an indicator of shelf waters, with its main distribution from the 50–100 m isobaths (Vannucci, Reference Vannucci1957, Reference Vannucci1963; Moreira, Reference Moreira1973; Navas-Pereira, Reference Navas-Pereira1981; Tronolone, Reference Tronolone2007). Nevertheless, in this study the species was equally distributed along the five stations and was also recently found in the Babitonga Bay estuary (Nogueira, Reference Nogueira2012). Diphyes bojani and A. hemistoma are the most abundant cnidarian species from tropical waters in the SBB (Abreu & Nogueira, Reference Abreu and Nogueira1989; Nogueira & Oliveira Jr, Reference Nogueira and Oliveira1991; Cordeiro & Montú, Reference Cordeiro and Montú1991; Tronolone, Reference Tronolone2007). Their preference for Stations 4 and 5 agreed with previous studies that collected both species mainly outside the 40 m isobaths, with few occurrences in shallower waters.
Increasing salinity from inner to outer stations (30 to 35) comprises a coast–ocean physical gradient, along with biological gradients such as decreasing phytoplankton abundance (Brandini et al., Reference Brandini, Silva, Silva and Kolm2007). The salinity gradient is influenced by estuarine outflows, which in turn vary seasonally according to precipitation. Species with a preference for the outer/intermediate shelf entered the Stations 1, 2 and 3 under particular hydrographic conditions. During the transitional period from late autumn to winter (April–July), precipitation declined, decreasing the continental runoff and bringing the 34 isohaline near the coast. Moreover, during winter, shelf waters were pushed toward the coast by strong southeasterly winds, following Ekman transport (Resgalla et al., Reference Resgalla, de la Rocha and Montú2001; Brandini et al., Reference Brandini, Silva, Silva and Kolm2007). These winter conditions may favor the entrance of shelf species into coastal waters, as observed for A. hemistoma, B. bassensis and D. bojani.
Temporal variability and considerations on species ecology
Cnidarians have extremely diverse life cycles and pathways of reproduction, which impedes interpretation of their population oscillations and life-history strategies (Boero et al., Reference Boero, Bouillon, Gravili, Miglietta, Parsons and Piraino2008). Among the holoplanktonic species, L. tetraphylla and M. kochi had two density peaks, while S. corona, D. bojani and A. hemistoma had only one (Figure 5). A possible period of recruitment occurred for L. tetraphylla and S. corona at the main abundance peak (July–October 1998), which coincided with increasing mean size for both species. Nevertheless, young individuals of L. tetraphylla, S. corona and A. hemistoma were found during most of the sampling period, which suggests continuous reproduction throughout the year.
For the siphonophores M. kochi and D. bojani, the overall proportion of eudoxids and polygastric stages was similar with eudoxid representing respectively 50.7% and 55.3% of the population. For M. kochi polygastric phase dominated (56–90%, averaging ~70%) during the winter peak (July and August); while eudoxids dominated (41–75%) during the spring–summer peak (December 1997 and January 1998). The pattern of higher proportions of polygastrics during winter and eudoxids during summer, may be due to the temperature influence in the life cycle of M. kochi, as demonstrated by Carré & Carré (Reference Carré and Carré1991).
Meroplanktonic species, Cirrholovenia tetranema Kramp, 1959, T. nutricula, E. dumortieri, Obelia spp., and Clytia spp. are frequently found in the polyp stage in Brazil (Migotto et al., Reference Migotto, Marques, Morandini and da Silveira2002). The seasonal patterns of these species depend on the seasonality of their benthic stages, and on the environmental variables affecting the release of medusae. Factors that trigger medusae production and release may be, in order of importance: temperature, food availability, photoperiod, salinity, lunar cycles, and possible combinations of them (Werner, Reference Werner1963; Carré & Carré, Reference Carré and Carré1990; Arai, Reference Arai, Bouillon, Boero, Cicogna, Gili and Hughes1992).
Food availability is considered the main factor correlated with individual growth and reproductive rates, for both hydromedusae and siphonophores (Purcell, Reference Purcell1982; Larson, Reference Larson1986; Arai, Reference Arai, Bouillon, Boero, Cicogna, Gili and Hughes1992). Because the zooplankton biomass in this coastal area typically remains high (Sartori & Lopes, Reference Sartori and Lopes2000), due to the influence of nutrient- and plankton-rich outflows from the estuaries, the planktonic cnidarians are probably never food-limited, and other environmental variables and combinations of factors should be considered to explain population increases.
From November 1997 to February 1998, Brandini et al. (Reference Brandini, Silva, Silva and Kolm2007) found a period of stability, with a stratified water column, high nutrient concentrations, and increasing phytoplankton abundance throughout the transect. At the three inner stations, the highest densities of copepods (3000–5000 org m−3), and molluscs (400–800 org m−3) were recorded from December 1997 to January 1998 (Sartori & Lopes, 2001; Ugaz-Codina, Reference Ugaz-Codina2003). Therefore, peaks of mesozooplankton and hydromedusae (300–400 org m−3) and siphonophores (60–80 org m−3) in January and February 1998 may represent a response to these summer pulses in primary and secondary production.
In August 1998, the maximum total densities (>1000 org m−3) of L. tetraphylla, M. kochi, D. bojani, Obelia spp., Clytia spp. (medusae), E. dumortieri and S. corona at Stations 1 and 2 were not as clearly related to a productivity pulse. In this cold period of thermohaline homogeneity in the water column, slight increases in chlorophyll concentrations and copepod densities were recorded; nevertheless these values were half the levels observed in the previous summer (Sartori & Lopes, Reference Sartori and Lopes2000; Brandini et al., Reference Brandini, Silva, Silva and Kolm2007). Two possible explanations may be assigned to this multispecies peak: (1) real population increase; sustained by increases of other plankton groups that were not quantified here (bacteria, flagellates, microzooplankton), because some hydrozoans consume other food items in addition to mesozooplankton (Colin et al., Reference Colin, Costello, Graham and Higgins III2005; Boero et al., Reference Boero, Bucci, Colucci, Gravili and Stabili2007); and (2) near-shore accumulation; the arrival of cold fronts with strong southeasterly winds may cause coastward advection of planktonic populations. This last represents a redistribution of a population and should be increased by the lower precipitation rates during winter, which decrease the volume of coastal waters and carry shelf waters toward the coast.
Most of the species showed variable patterns of seasonality, compared to other temporal studies in the SBB. In this study and in the São Sebastião Channel (Tronolone, Reference Tronolone2001), most of the Obelia spp. specimens were found in winter, whereas at Cananéia and Santos, Vannucci (Reference Vannucci1963) and Moreira (Reference Moreira1973) found spring–summer peaks. These variations in relatively close regions (<200 km apart) may be explained by variable seasonal patterns of indistinguishable species. While inside estuaries of Paranaguá and Babitonga, high densities of L. tetraphylla were observed in early spring (Montú & Cordeiro, Reference Montú and Cordeiro1988; Pukanski, Reference Pukanski2011), off Santos and in the La Plata Estuary the peaks occurred in mid-summer (Moreira, Reference Moreira1973; Zamponi & Genzano, Reference Zamponi and Genzano1994). If one considers temperature as a determining factor for the species dynamics, the early spring peaks found here occur in similar temperatures (20–22°C) in mid-summer in the temperate La Plata Estuary. For E. dumortieri, ~75% of the individuals occurred in winter, below temperatures of about 19°C (Figure 7K), but both midwinter and summer peaks were found in the cold SACW, at Cananéia, Santos and São Sebastião (Vannucci, Reference Vannucci1963; Moreira, Reference Moreira1973; Tronolone, Reference Tronolone2001). Asexual reproduction through the production of medusae buds in P. ornata, E. paradoxica and N. dendrotentaculata can rapidly produce a dense population (Kawamura & Kubota, Reference Kawamura and Kubota2008). Laboratory experiments showed high bud production of P. ornata from Japan, and of E. paradoxica from the Mediterranean under specific temperatures: 20°C (Kawamura & Kubota, Reference Kawamura and Kubota2008) and 24°C (Carré & Carré, Reference Carré and Carré1990), respectively. In this study, E. paradoxica and P. ornata were mostly found in higher temperatures (25–27°C: Figures 7, 8B), nevertheless, the spring and summer peaks at Santos were below the thermocline, in 16–18°C waters (Moreira, Reference Moreira1973) and in late winter at Cananéia, at ca 20°C (Vannucci, Reference Vannucci1963).
Knowledge of the population dynamics of planktonic cnidarians is based on the results of long-term sampling programs in temperate regions, such as the North Sea (Greve et al., Reference Greve, Reiners, Nast and Hoffmann2004), North Atlantic (Gibbons & Richardson, Reference Gibbons and Richardson2009), the Mediterranean Sea (Buecher et al., Reference Buecher, Goy, Planque, Etienne and Dallot1997; Licandro et al., Reference Licandro, Braconnot, Carré, Dallot, Etienne, Ibanez, Moitié and Briand2001) and in Argentina (Genzano et al., Reference Genzano, Mianzan, Díaz-Briz and Rodríguez2008). In colder regions, the seasonality of many species is more regular, with population peaks and reproductive activity concentrated in the warmer months (Mills, Reference Mills1981; Larson, Reference Larson1986; Ballard & Myers, Reference Ballard and Myers2000; Hosia & Båmstedt, Reference Hosia and Båmstedt2007; Hosia & Båmstedt, Reference Hosia and Båmstedt2008; Gibbons & Richardson, Reference Gibbons and Richardson2009). Reproductive events around the warmer months were not observed here, since young individuals were found throughout the year for most species (Figure 6) suggesting continuous recruitment.
Comparisons of specific seasonality patterns among studies in the SBB should be made with caution, due to possible regional and inter-annual variability. Between June 1997 and June 1998, Garcia et al. (Reference Garcia, Vieira and Winemiller2001) recorded higher than usual precipitation in southern Brazil as a consequence of an El Niño event, which may have influenced the distribution and seasonality of the cnidarians observed here. Nevertheless, the major hydrographic and meteorological conditions along the SBB are similar to those found here; the wide variation in seasonal patterns among the studies could suggest that regular seasonality and succession, such as that found in some high latitude ecosystems (Mills, Reference Mills1981; Gibbons & Richardson, Reference Gibbons and Richardson2009) are unlikely to be repeated here.
Our vertical hauls sampled relatively small volumes, which may potentially increase the uncertainty of field density estimations as planktonic cnidarians exhibit patchy distributions. Small sample volumes may also reduce (or not perceive) density estimations of larger or sparse animals (Hosia et al., Reference Hosia and Båmstedt2008). Larger hydromedusae such as Rhacostoma atlanticum L. Agassiz, 1850 and Olindias sambaquiensis Müller, 1861 were absent in this survey, despite being abundant in the SBB when sampled with larger nets, such as bottom trawls (Nagata et al., 2014) and rectangular mid-water trawls (Mianzan & Guerrero Reference Mianzan and Guerrero2000). We cannot ignore that density variations can be caused by re-distribution of populations due to concentrating factors (Graham et al., Reference Graham, Pagès and Hamner2001). Populations can aggregate on both vertical and horizontal physical gradients, such as oceanic fronts, and thermoclines (Graham et al., Reference Graham, Pagès and Hamner2001), imposing a challenge to any quantitative sampling by standard plankton nets.
Our data described a distinct coast–ocean faunistic transition off Paraná, the inner stations (≤20 m) dominated by L. tetraphylla, S. corona and other meroplanktonic species, and the outer stations (25 and 40 m isobaths) characterized by siphonophores and taxa typical of the outer/intermediate shelf. This pattern of cross-inner shelf distribution may be explained by the salinity gradient and is probably representative of the central SBB. On a temporal scale, holoplanktonic taxa were the most abundant and frequent throughout the sampling period, whereas meroplanktonic taxa had more restricted periods of occurrence. Meteorological and hydrographic data explained the onshore transport of outer/intermediate shelf species to the inner stations, particularly in the winter, when rainfall is lower, salinity is high, and shelf waters are pushed onshore by the prevalent southeasterly winds. Comparisons with other seasonal studies in the SBB did not identify common patterns of seasonality, which could suggest a low predictability of specific periods of occurrence, and the possibility that other factors affect the species' seasonality.
Most seasonal studies in tropical and subtropical environments were based on sampling over the course of one year. To reach a better understanding of the temporal dynamics, long-term monitoring programmes should be implemented, to account for the inter-annual variability. Moreover, not merely the natural species seasonality should be considered, but also studies on anthropogenic factors (global warming, eutrophication, acidification) need to be carried out to evaluate this influence on the long-term dynamics, such as faunistic or phenological changes, invasions, and extinctions.
ACKNOWLEDGEMENTS
The authors are indebted to the Brazilian Navy and the crew of the support vessel ‘Fomalhaut’ for supporting all the sampling cruises in open shelf areas off Paraná State. Dr José G. Bersano Filho allowed us the use of his laboratory facilities to analyse the zooplankton samples. The authors thank Dr José G. Bersano Filho, Dr Erick Muxagata and two anonymous referees for improving this manuscript.
FINANCIAL SUPPORT
This work was supported by Conselho Nacional de Desenvolvimento Científico e Tecnológico—Programa de Apoio ao Desenvolvimento Científico e Tecnológico, CNPq/PADCT (grant number 62.0408/98-7). CNPq grant (MSc grant number 131171/2008-9) and Fundação de Amparo à Pesquisa do Estado de São Paulo grant (FAPESP, PhD grant number 2011/00436-8) to R.M.N. CNPq grant (PhD grant number 140945/2007-5), and FAPESP grant (post-doctoral grant number 2011/09880-8) to M.N.Jr.


