INTRODUCTION
Blooms and global dispersion of certain scyphozoan (jellyfish) species threaten the world's oceans due to their ecologically and economically negative impacts on the marine environment (Mills, Reference Mills2001). Harmful jellyfish species can be translocated accidentally by international ship transportation (Holland, Reference Holland2000; Purcell et al., Reference Purcell, Uye and Lo2007), because jellyfish, larvae, and/or polyps can attach to the surface of a ship or can be transported in the ballast water. Correct and rapid discrimination of such cryptic jellyfish would be useful to monitor the dispersion of these species and manage jellyfish blooms. Traditionally, jellyfish are classified based on morphological features and body measurements. However, identification of some jellyfish species is challenging because jellyfish have complex, morphologically distinct life cycle stages (polyp, ephyra and medusa stages); furthermore, their medusae can be morphologically variable (Russell, Reference Russell1970).
As an alternative to morphological identification, molecular tools have been used to identify and detect cryptic species (Schroth et al., Reference Schroth, Jarms, Streit and Schierwater2002; Dawson, Reference Dawson2003, Dawson et al., Reference Dawson, Sen Gupta and England2005; Ki et al., Reference Ki, Kim and Lee2009). In addition, these tools can help identify population sources and transmission vectors, and allow assessment of the extent and impact of invasions (Holland, Reference Holland2000; Wares et al., Reference Wares, Goldwater, Koug and Cunningham2002). Molecular tools that are frequently employed include the polymerase chain reaction (PCR), DNA sequencing, and real-time PCR assays. In addition to techniques for single species detection, multiple detection assays, e.g. multiplex PCR and microarrays, have been developed to allow parallel analysis of several samples. These techniques have been applied successfully to marine microorganisms (Metfies & Medlin, Reference Metfies and Medlin2004; Ki & Han, Reference Ki and Han2006; Gescher et al., Reference Gescher, Metfies and Medlin2008; Kochzius et al., Reference Kochzius, Nölte, Weber, Silkenbeumer, Hjörleifsdottir, Hreggvidsson, Marteinsson, Kappel, Planes, Tinti, Magoulas, Garcia Vazquez, Turan, Hervet, Campo Falgueras, Antoniou, Landi and Blohm2008) to detect multiple species simultaneously, demonstrating that DNA microarrays have the potential to improve monitoring of marine organisms.
In this study, we report the development of a DNA microarray (‘DNA chip’) and demonstrate the effectiveness of this chip for simultaneous detection of more than one jellyfish species. Capture probes arrayed on the chip were designed from annotated, well-described mitochondrial cytochrome c oxidase subunit I (COI) gene sequences by comparing these sequences between jellyfish and other related marine animals within the phylum Cnidaria. The DNA chip was tested using Aurelia Lamarck, 1816 and Chrysaora Péron & Lesueur, 1810, because species in these genera are abundant and some of the species in these genera are increasing in number worldwide. Species in both genera, including Aurelia sp.1 (Ki et al., Reference Ki, Hwang, Shin, Yoon, Lim, Kang, Lee and Lee2008) and Chrysaora sp., have frequently been found in southern Korean coastal waters, and sometimes form dense blooms.
MATERIALS AND METHODS
Specimen collection
Two jellyfish species (Aurelia sp.1 and Chrysaora sp.) were collected from Korean coastal waters, near Incheon (37°26.23′N 126°22.40′E) and Geoje-do (34°59.33′N 128°40.31E′). Individuals were immediately preserved in absolute ethanol for dehydration, washed several times, and stored at room temperature until use. Genomic DNA was isolated from the stored tissues using Proteinase K treatment followed by chloroform extraction and isopropanol precipitation. The isolated DNA was further purified using the DNeasy tissue kit (Qiagen, Valencia, CA).
Capture probe development
A total of 26 selected scyphozoan species and three negative controls (Table 1) were used for development of species-specific oligonucleotide capture probes by comparison with COI sequences from an additional 83 cnidarian species (see Supplementary Table 1 online), obtained either by DNA sequencing (Ki et al., Reference Ki, Hwang, Shin, Yoon, Lim, Kang, Lee and Lee2008) or from public databases (GenBank, EMBL, and DDBJ). All the sequences were aligned in ClustalW 1.83 (Thompson et al., Reference Thompson, Higgins and Gibson1994). A simple sequence comparison was performed, by observing phylogenetic relationships in Bayesian tree constructed with the GTR + I + G model of sequence evolution in MrBayes (see Supplementary Materials and Methods online), and an entropy plot was calculated based on the amount of variability in a column in the sequence alignment using BioEdit 5.0.6 (North Carolina State University, NC). Based on the aligned sequences, species-specific oligonucleotides were designed within one of the highly variable regions identified in the sequence alignment. Each oligonucleotide was up to 32 nucleotides long (including 10 nucleotides of dT-spacer), and contained a G/C content of around 50% (Table 2). Although several different oligonucleotide capture types are available (e.g. bridge, dT- or dA-spacers, direct linkages), 20–25-mer oligonucleotides with 10 dTs as a spacer have been shown to be able to stably capture PCR amplicons less than 400 bp and gave reproducible signals in hybridization experiments (Ki & Han, Reference Ki and Han2006). Thus, all capture probes used in this study included a 10-dT spacer between the core sequence and the amine at the 5′-end (Table 2). All the oligonucleotides designed as capture probes were labelled with amine molecules at the 5′ terminal, and were prepared by Bionics Inc (Seoul, Korea).
Table 1. Species locality and GenBank accession number of the species included in this study.

arepresents negative controls used in this study; b indicates expected PCR fragment size and per cent GC amplified by the primer pair Cy3-JF-COIR1 and JF-COIF1 (see Materials and Methods).
Table 2. Capture probe names and their sequences based on mitochondrial COI sequences.

aamine (6) was labelled at the end of the capture oligonucleotide; bTm, melting temperature. Predictions are accurate for oligonucleotides from 8 to 60 bases in length, in neutral buffered solutions (pH 7–8) with monovalent cation concentrations ranging from 10 mM to 1.2 M; ccorresponds to the numbering of the COI sequence of Aurelia sp.1 (Accession No. EU010386).
Oligonucleotide array
Amine-linked oligonucleotides were arrayed on silylated DNAchip slides (CEL Associate Inc, USA). For spotting, all the probes were diluted to 100 pM with nuclease-free water, and were then further diluted with the same amount of GenoCheck PlatinumTM spotting solution (GenoCheck Inc, Ansan, Korea). Each probe was spotted in triplicate on the slides at an interval of 300 µm using a ProsysTM Gantry System (Cartesian Technologies, Inc, USA). After spotting the probes, the slide was left at room temperature (~25°C, <60% relative humidity) for 16 hours to permit covalent binding of the DNA onto the surface of the silylated slide. After the oligonucleotides had been linked to the slide, the arrayed slide was dried and stored at room temperature.
Array reduction
Prior to hybridization, probes arrayed on the slides were reduced with sodium borohydride to stabilize the oligonucleotides. To remove unbound oligonucleotide probes from the slides, we rinsed the slide surfaces with 0.1% sodium dodecyl sulphate for 1 minute, followed by three rinses with distilled water. The slides were then reacted with sodium borohydride solution (NaBH4 1 g:PBS 300 ml:ethanol 100 ml) for 5 minutes, followed by incubation with dH2O at 95°C for 3 minutes; the slides were then rinsed with ice-cold absolute ethanol for 1 minute. Finally, the chips were spin-dried by centrifugation at 500 rpm for 90 seconds. The ready-to-use slides were stored at room temperature until use.
PCR labelling
Jellyfish target PCR primers were designed to bind to conserved regions adjacent to the capture probes to produce PCR amplicons that included the probe-target sequences. Nucleotide sequences of Light (L-) strand target JF-COIF1, and Heavy (H-) strand target Cy3-JF-COIR1 were 5′-TAA TGA THT TCT TYT TYG TDA TGC C-3′ (Tm, 51°C; GC, 37%) and 5′-AAT ATW GCC ATA TCN ACW GAA CC-3′ (Tm, 51°C; GC, 30%). The Cy3-JF-COIR1 primer was labelled with Cy3 dye at the 5′ end. The JF-COIF1 and Cy3-JF-COIR1 primers are located at positions 197–221 and 427–449, with numbering relative to the complete COI gene sequence of Aurelia sp.1 (GenBank accession No. EU010386).
Labelled PCR amplicons of each jellyfish were prepared as follows: PCR reactions included 1x GO Taq polymerase buffer, 1 µl genomic DNA template (approximately 0.5 ng/μl), 200 µM each of each dNTP, 0.5 µM of each primer, and 1 Unit GO Taq polymerase (Promega, Madison, WI) in a 25 µl reaction volume. PCR amplification was performed on a DNA engine (MJ Research, Inc) using the following thermocycling parameters: an initial denaturation at 94°C for 3 minutes, followed by 35 cycles of denaturation at 94°C for 20 seconds, annealing at 50°C for 30 seconds, and extension at 72°C for 30 seconds. This was followed by a final extension at 72°C for 5 minutes. The PCR products (2 µl) were analysed by 1.0% agarose gel electrophoresis. PCR amplicons were stored at 4°C until hybridization.
Hybridization
Prior to hybridization, labelled PCR products were purified using the QIAquick PCR purification Kit (Qiagen GmbH, Germany). The purified Cy3-labelled PCR products were separated into single strands at 94°C for 3 minutes, then immediately placed on ice. After that, the Cy3-labelled PCR amplicons of the COI gene were hybridized to the oligonucleotide array as follows. A volume of 10 µl fluorescent PCR products were dissolved in 90 µl of GenoCheck PlatinumTM hybridization solution (GenoCheck Inc). The mixture was collected by brief centrifugation and carefully loaded onto the oligo area on the arrayed slide using a micropipette. A glass coverslip was used to cover the hybridization solution on the array area. The slides were incubated in a sealed humid chamber at 50°C for 1 hour, and washed carefully with GenoCheck PlatinumTM wash solution for 5 minutes. The hybrid slide was dried by centrifugation for 1 minute. The slides were dried under flowing argon gas and kept in a slide box at room temperature until the fluorescence was read.
Data analysis
The intensity of fluorescence emitted from a target spot on the array was detected at a pixel resolution of 10 µm using a LuxScanTM 10K-A Microarray Scanner (Capitalbio Corp, China). A TIFF image of 10 µm resolution was obtained based on Cy3 fluorescence. Fluorescence intensities of the individual spots measured with the scanner were analysed using Microsoft Office Excel 2003.
RESULTS AND DISCUSSION
Comparison of scyphozoan COI genes in Cnidaria
In the present study, we examined the phylogenetic relationships of cnidarians (e.g. scyphozoans, hydrozoans and anthozoans), with a particular focus on scyphozoan species (see Supplementary Figure 1 online). Because the branch lengths in a phylogenetic tree indicate the amount of nucleotide divergence among taxa, branch length can be used as a rough indicator of sequence relevance when designing species-specific molecular probes or probes for DNA barcoding. A phylogenetic tree constructed using Bayesian methods showed that the scyphozoans included in the study were monophyletic; this clade was supported by a posterior probability of 0.98. In addition, certain genera (e.g. Aurelia, Cyanea and Cassiopea) belonging to the class Scyphozoa grouped according to genus. Furthermore, the COI gene sequences of the scyphozoans, particularly the 12 Aurelia species (Dawson et al., Reference Dawson, Sen Gupta and England2005), showed very low inter-specific variation (Ki et al., Reference Ki, Hwang, Shin, Yoon, Lim, Kang, Lee and Lee2008). According to Hellberg (Reference Hellberg2006) and Huang et al. (Reference Huang, Meier, Todd and Chou2008), medusozoans, which include Scyphozoa and Hydrozoa, have more typical rates of COI evolution than other basal metazoans such as anthozoans and poriferans, and thus the COI of medusozoans can be used for DNA barcoding. However, COI gene sequences of anthozoans are not suitable for DNA barcoding due to low inter-specific variation (Hebert et al., Reference Hebert, Cywinska, Ball and deWaard2003). Our findings are consistent with these previous reports, and indicate that variation in scyphozoan COI sequences should allow discrimination between jellyfish species.
Design of species-specific probes based on scyphozoan COI genes
We used COI gene sequences determined in this study and others (Hebert et al., Reference Hebert, Cywinska, Ball and deWaard2003; Hellberg, Reference Hellberg2006; Huang et al., Reference Huang, Meier, Todd and Chou2008) to develop scyphozoan-targeting oligonucleotide probes for array-based identification of schyphozoans. We designed oligonucleotide probes for 26 scyphozoan species based on diverse molecular comparisons of mitochondrial COI gene sequences. In this case, based on our experience with a previous DNA chip platform (Ki & Han, Reference Ki and Han2006), we designed oligonucleotide probes more than 22 nucleotides in length to capture labelled PCR fragments less than 400 bp in length effectively. Each oligonucleotide probe was approximately 25 nucleotides long and the probes had similar melting temperatures (around 50°C) when adjusted for nucleotide length. We chose probe sequences that incorporated as many nucleotide mismatches as possible based on sequence comparisons. The mismatches were located centrally in each probe. We included samples from a gastropod, a copepod and a fish as negative controls because these types of animals often co-exist with jellyfish (Table 1).
PCR optimization
A pair of universal primers (JF-COIF1 and Cy3-JF-COIR1) was designed to specifically amplify the COI sequences of scyphozoans (jellyfish). The resultant amplicons were 253 bp in length. Thermal gradient PCR was used to estimate the optimal thermal temperature. Amplification was poor when the annealing temperature was greater than 58°C (Figure 1A). Thus, we used an annealing temperature of 55°C for PCR labelling of jellyfish COI genes. At this annealing temperature, we did not detect any fragments from negative controls. We used these PCR conditions to amplify various jellyfish samples, and were able to successfully amplify the expected regions from mixtures of genomic DNA from different jellyfish species (Figure 1B). In addition, we successfully amplified the region of interest from environmental genomic DNA extracted from field samples and different life-stages of the target jellyfish. In contrast, no PCR amplicons were generated from either fish or copepod genomic DNA. Some non-specific PCR by-products were produced when using field specimens. However, these minor products are expected to have a negligible effect on hybridization because the capture probes recognize PCR products amplified from the mitochondrial COI gene (Ki & Han, Reference Ki and Han2006).

Fig. 1. Amplification of the COI gene from two jellyfish species (CJ, MJ) and a negative sample (TJ) (A), and from various combinations of the jellyfish and negative control (B) using JF-COIF1 and Cy3-JF-COIR1 primers. (A): PCR was carried out using a thermal gradient block. The annealing temperature was varied from 60°C (lanes 1, 6 and 11) to 45°C (approximately 3°C of intervals). Three gDNAs from moon jelly (lanes 1–5), sea nettle (lanes 6–10), and a copepod (lanes 11–15) were tested to determine optimal PCR conditions; (B) PCR was performed using a mixture of samples prepared by proportional dilutions of genomic DNA from MJ and CJ as template. M, 100 bp DNA marker; MJ, moon jelly; CJ, Chrysaora jelly; TJ, a copepod (Tigriopus sp.); M, 100 bp DNA marker; MJ, Aurelia sp.1; CJ, Chrysaora sp.; TJ, a copepod (Tigriopus sp.).
Oligonucleotide concentration on the array
Prior to spotting, we determined the optimal concentration of arrayed molecules on the silylated slide (CEL Associate Inc, USA). In this test, we used amine-labelled probes and complementary Cy3-labelled oligomers. The sensitivity of Cy3 was measured with serial 2-fold dilutions of the Cy3-labelled Cy3-JF-COIR1 primer, with six concentrations ranging from 1.6 to 50 µM. The diluents were spotted on a silylated DNA chip slide and left to dry. The Cy3-spotted slide was scanned using a ProsysTM Gantry System, and the scanned image was used to measure the fluorescence intensity of each spot using a LuxScanTM 10K-A Microarray Scanner (Capitalbio Corp, China). The monochrome image and its fluorescence plot are shown in Figure 2. Intensities from the diluted Cy3-oligos were scaled exponentially, therefore the values were transformed to log10-scaled units (linear curve; R2 = 0.9633) within the concentration range from 1.6–50 µM. Fluorescence intensity less than 1.6 µM was not detectable. When the Cy3-labelled primer concentration was greater than 3.1 µM, the fluorescent signals showed a clear linearity between the log10-scaled signals and the dilution range. Consequently, we spotted 50 µM of each probe onto the silylated slides.
Fig. 2. Monochrome images obtained from serial two-fold dilutions of a captured probe and hybridization of complementary Cy3-labelled products (A), and their plotted signal intensities (B).
Analysis of hybridization
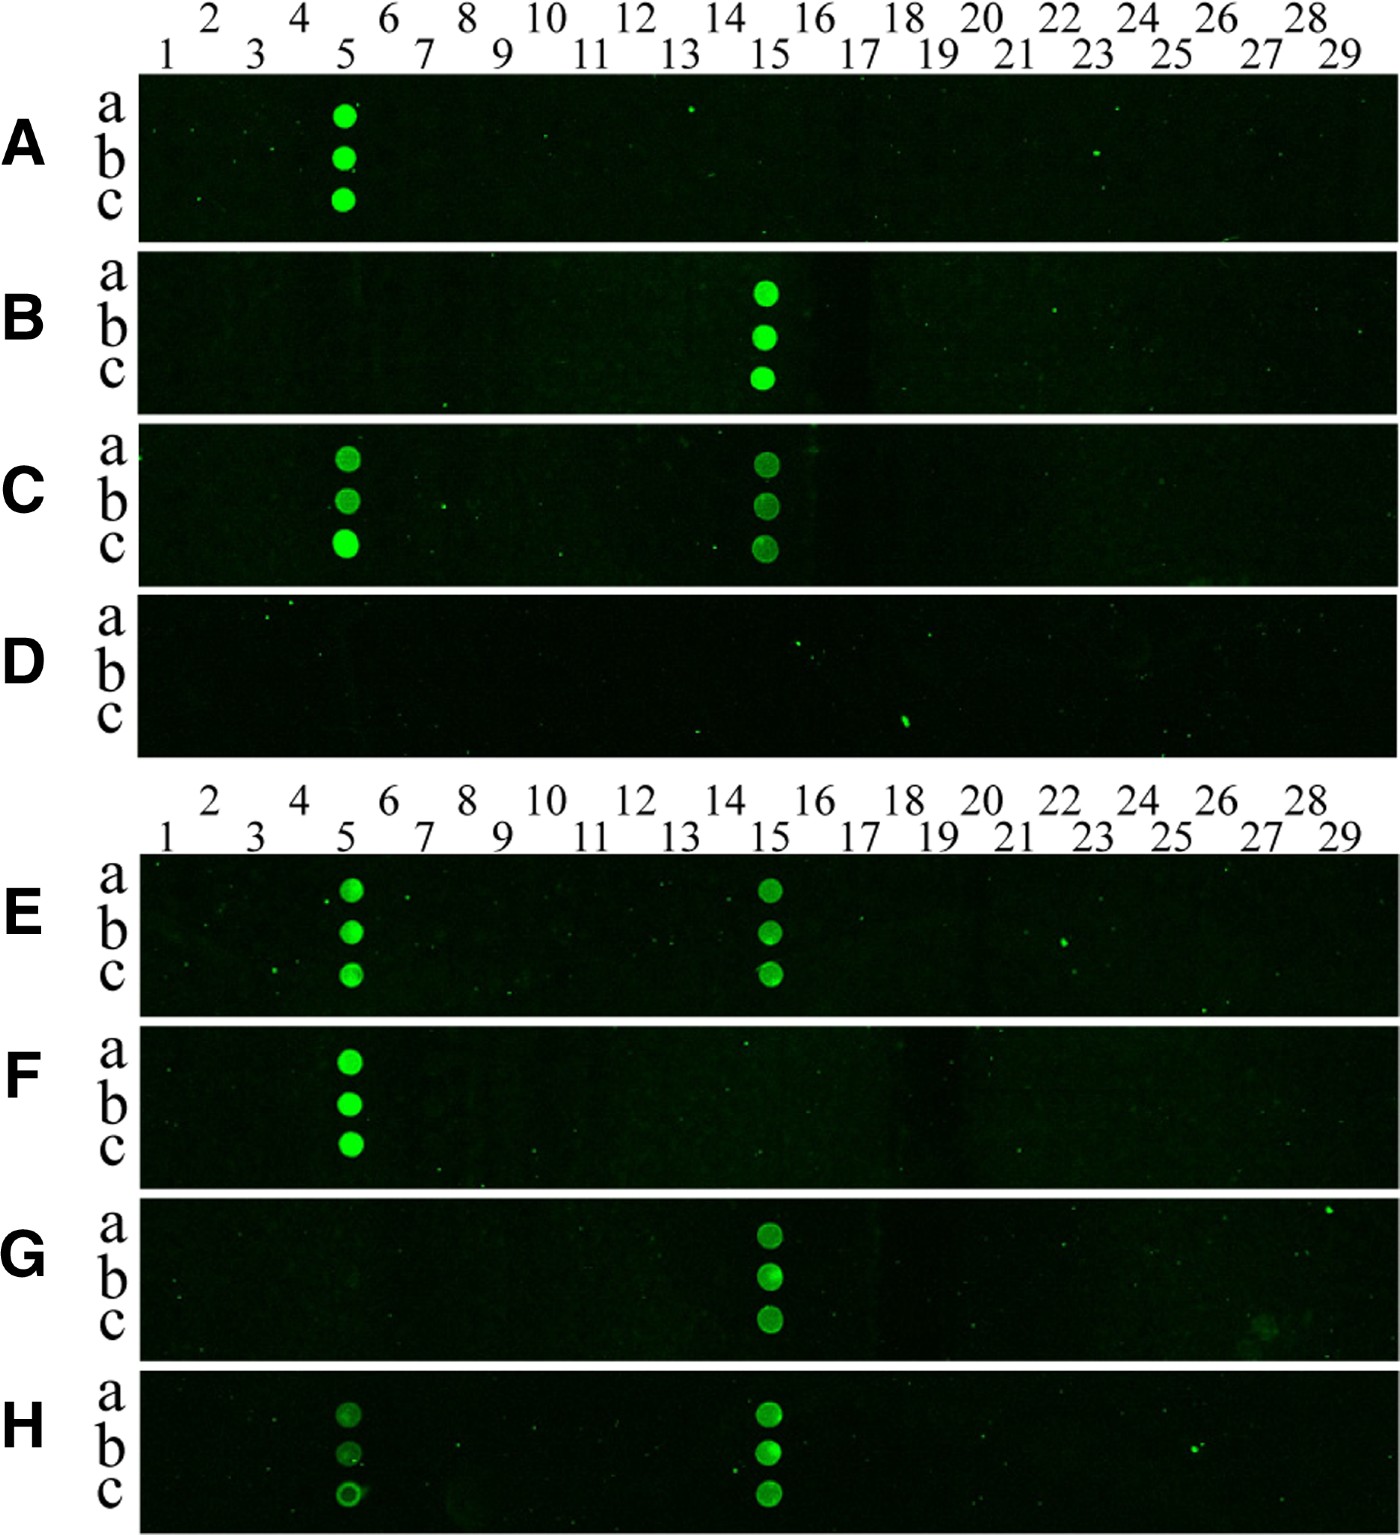
Cy3-labelled PCR products were prepared by amplification of mitochondrial COI genes from each jellyfish using the universal JF-COIF1 and Cy3-JF-COIR1 primers. The amplicons were allowed to hybridize to the oligonucleotide array on the silylated glass slide, and then the hybridization signals were analysed. Figure 3 shows the results of the hybridization of PCR produced from two jellyfish species, Aurelia sp.1 and Chrysaora sp., to the oligonucleotide array. Little cross-hybridization was observed for the different targets (see Figure 3A, B), despite the use of one set of experimental conditions and the presence of different arrayed probe sequences. In addition, there was no cross-hybridization between jellyfish probes and a copepod COI amplicon (Figure 3D, F & G). Further experiments were performed to measure the cross-reactivity of the targets. The results for cross-reactivity were negative, which is clearly shown in the hybridization images presented in Figure 3A–H.

Fig. 3. Pseudo-colour images (A–H) from hybridization of COI-PCR products to the DNA microarray. Cy3-labelled PCR products from Aurelia sp.1 (A), Chrysaora (B), a mixture of the two pre-PCR products (C) and a copepod (D) were hybridized with a capture probe-arrayed slide; (E) is the hybridization image obtained when a mixture of pre-amplified PCR products from Aurelia sp.1 and Chrysaora sp. was used as a target, and (F) shows the image obtained when using PCR products amplified from a mixture of genomic DNA from Aurelia sp.1 and a copepod as a target; (G) shows the image obtained when target PCR products were amplified from a mixture of genomic DNA from Chrysaora sp. and a copepod; (H) is the hybridization image obtained when a mixture of pre-amplified PCR products from a mixed template containing equal amounts of Aurelia sp.1 genomic DNA and Chrysaora sp. gDNA was used as a target as in (A, B). The probes for each species were printed in triplicate spots (a, b and c), representing 26 jellyfish (spot numbers 1–26) on the array, and three negative controls (spot numbers 27–29) were also included. Columns of spots on each array from left to right follow the format shown in Table 2. Spot numbers 5 and 15 represent probes of Aurelia sp.1 and Chrysaora sp., respectively.
We also prepared a mixture of two pre-amplified PCR products from Aurelia sp.1 and Chrysaora sp. in equal ratios, and then hybridized this mixture to the oligonucleotide array. We detected two positive spots corresponding to Aurelia sp.1 and Chrysaora sp. in the hybridization image (Figure 3E). In addition, we found that the genomic DNA mixture did not noticeably affect the PCR amplification and hybridization efficiency, as demonstrated in Figure 3E–H. Consistent with our findings, Ki & Han (Reference Ki and Han2006) reported that infrared dye-labelled PCR fragments hybridized specifically to their target probes.
Figure 4 shows the fluorescent intensity according to different concentrations of Cy3-labelled PCR fragments (0.1–0.4 µM). In these hybridizations, we fixed the amount (approximately 0.5 µM) of Cy3-labelled Chrysaora COI fragments (Figure 3B). The values obtained from each monochrome image were transformed to log10-scaled units and plotted in a histogram (Figure 4). The signal was correlated with the concentration of hybridizing molecules (R2 = 0.939, P < 0.01), suggesting that the DNA chip we designed can be used to determine the concentration of molecules.

Fig. 4. Fluorescence intensity plot of pseudo-colour images. Cy3-labelled PCR products from four mixtures of PCR products from Aurelia sp.1 and Chrysaora sp. were hybridized to capture probe-arrayed slides. The mixtures were prepared with 0.1, 0.2, 0.3, or 0.4 µM of moon jelly PCR products and 0.5 µM of Chrysaora sp.
Application to environmental and life-stage samples
To see if the chip could be used for environmental samples, we tested the chip using samples collected from different localities in southern (Geoje-do; 34°59.33′N 128°40.31′E), south-eastern (Busan; 35°12.58′N 129°13.41E′), and western (Incheon; 37°26.23′N 126°22.40′E) Korean coastal waters (see Ki et al., Reference Ki, Hwang, Shin, Yoon, Lim, Kang, Lee and Lee2008). We took hybridization images of the microarray hybridized with Cy3-labelled PCR amplicons from environmental genomic DNA (images not shown), and found that all the samples contained Aurelia sp.1 as judged by hybridization intensity. In a previous report (Ki et al., Reference Ki, Hwang, Shin, Yoon, Lim, Kang, Lee and Lee2008), we sequenced the mitochondrial COI gene and the nuclear internal transcribed spacer gene from the same environmental sample, and found that all specimens blooming in different areas and seasons in Korea were Aurelia sp.1 (Ki et al., Reference Ki, Hwang, Shin, Yoon, Lim, Kang, Lee and Lee2008). Thus the array appears to accurately identify the jellyfish samples present in an environmental sample.
Polymerase chain reaction amplicons from jellyfish at different life stages were also hybridized to the chip. We extracted genomic DNA from jellyfish polyp and ephyra-like stages collected from south-eastern Korean seawaters (Busan; 35°12.58′N 129°13.41′E). The PCR products were prepared in the same manner as described above, and allowed to hybridize to the oligonucleotide array. The array produced unique hybridization patterns for the two different stages of jellyfish. DNA mixtures from a number of polyp and ephyra individuals were obtained from the environmental sample. Only Aurelia sp.1 was detected based on the microarray hybridization signals.
Implication of the DNA chip for jellyfish detection
Compared to single species detection assays (e.g. PCR and DNA sequencing), the jellyfish DNA chip that we developed allows several sequences to be examined in a single hybridization step (Anthony et al., Reference Anthony, Brown and French2000; Wilson et al., Reference Wilson, Strout, DeSantis, Stilwell, Carrano and Andersen2002; Ki & Han, Reference Ki and Han2006; Kochzius et al., Reference Kochzius, Nölte, Weber, Silkenbeumer, Hjörleifsdottir, Hreggvidsson, Marteinsson, Kappel, Planes, Tinti, Magoulas, Garcia Vazquez, Turan, Hervet, Campo Falgueras, Antoniou, Landi and Blohm2008). In the present study, we used a microarray that can detect 26 jellyfish species based on the COI gene. As a test case, we evaluated whether the chip could simultaneously detect two jellyfish, Aurelia sp.1 and Chrysaora sp., because of their recent worldwide dispersals (e.g. Graham, Reference Graham2001; Ki et al., Reference Ki, Hwang, Shin, Yoon, Lim, Kang, Lee and Lee2008). These and other scyphozoan species whose COI sequences are included in the present jellyfish DNA chip may be responsible for the blooms that have a negative impact on the marine environment (Mills, Reference Mills2001). Each species-specific molecular probe on the chip was developed using a similar number of nucleotide mismatches and divergence from the target sequences as those probes used to detect Aurelia sp.1 and Chrysaora sp. Complementary target sequences of interest are expected to hybridize to the corresponding probe with little cross-hybridization to other probes. Our results suggest that the jellyfish DNA chip can detect both Aurelia sp.1 and Chrysaora sp. simultaneously. Kochzius et al. (Reference Kochzius, Nölte, Weber, Silkenbeumer, Hjörleifsdottir, Hreggvidsson, Marteinsson, Kappel, Planes, Tinti, Magoulas, Garcia Vazquez, Turan, Hervet, Campo Falgueras, Antoniou, Landi and Blohm2008) developed a fish chip for the identification of fish species from European seas based on mitochondrial 16S rDNA sequences. They demonstrated the suitability of the chip-based identification, and confirmed single target hybridization with Cy5-labelled, PCR-amplified 16S rDNA fragments from each of the 11 species on the microarray. Taking into account this and recent studies (Ki et al., 2006; Kochzius et al., Reference Kochzius, Nölte, Weber, Silkenbeumer, Hjörleifsdottir, Hreggvidsson, Marteinsson, Kappel, Planes, Tinti, Magoulas, Garcia Vazquez, Turan, Hervet, Campo Falgueras, Antoniou, Landi and Blohm2008), COI-based microarrays allow identification of marine organisms from environmental samples. In addition, the jellyfish DNA chip can be used to detect the species of jellyfish present, even when various life stages of the species are present. Our jellyfish chip can be applied to jellyfish blooming areas worldwide to identify the jellyfish species present based on polyp-, egg-, or medusa-stage samples.
ACKNOWLEDGEMENTS
We thank Dr Hans-U. Dahms for his comments on our manuscript. This work was supported by grants from the National Research Laboratory of KOSEF (2006) and an ETEP (2006) grant to Jae-Seong Lee.
Supplementary materials and methods
The Supplementary material referred to in this article can be found online at journals.cambridge.org/mbi.