INTRODUCTION
Copepods are the most important secondary producers in aquatic ecosystems as a whole, comprising 90–97% of the total mesozooplankton biomass (Bradford-Grieve et al., Reference Bradford-Grieve, Markhaseva, Rocha, Abiahy and Boltovskoy1999). Copepod communities are considered the most important link between phytoplankton and higher trophic levels and are an important determinant of the potential size of a fishery (Uye et al., Reference Uye, Shimazu, Yamamuro, Ishitobi and Kamiya2000; Berasategui et al., Reference Berasategui, Ramirez and Schiariti2005; Leandro et al., Reference Leandro, Morgado, Pereira and Queiroga2007). The distribution and abundance of copepod species are directly and indirectly influenced by environmental factors (Rahman & Verdegem, Reference Rahman, Verdegem, ven der Zijpp, Verreth, Tri, ven Mensvoort, Bosma and Beveridge2007; Rahman et al., Reference Rahman, Kadowaki, Balcombe and Wahab2010). However, copepod variability is often difficult to relate to these environmental factors because of complex multifactorial influences, particularly in estuaries (Islam et al., Reference Islam, Ueda and Tanaka2004; Rahman et al., Reference Rahman, Verdegem, Nagelkerke, Wahab and Verreth2008). Therefore, knowledge of their community structure and distribution patterns in the estuarine environment is essential, both to improve our understanding of their trophic ecology and for successful management of their fisheries (Tseng et al., Reference Tseng, Souissi, Dahms, Chen and Hwang2008).
Estuarine copepod communities are believed to be relatively stable inter-annually (David et al., Reference David, Sautour, Chardy and Leconte2005), but to show strong seasonal and spatial dynamics (Winkler et al., Reference Winkler, Dodson, Bertrand, Thivierge and Vincent2003). Spatio-temporal variations and habitat types are, therefore, among the most important factors that influence abundance, composition and size structure of estuarine copepods. So it is important to study estuarine copepods at a wide spatial and temporal scale. Temperature, salinity and food supply are among the most important factors that influence the observed spatial and seasonal patterns in demographic variations of copepods (Hassel, Reference Hassel1986), but very little is known about the magnitude of spatio-temporal variation of copepod assemblages in tropical estuarine ecosystems. This information would be very helpful in the designing ecological monitoring programmes for tropical estuarine ecosystems in particular, in order to understand their zooplankton dynamics.
We describe the seasonal variations in the structure of copepod assemblages in the Coleroon estuary, a tropical estuary in south-east India. In this part of India, the four seasons are generally known as post-monsoon (January–March), summer (April–June), pre-monsoon (July–September) and monsoon (October–December). The Coleroon estuary is influenced by intense fresh water discharge during the monsoon, when salinities are lowest (Thillai Rajasekar et al., Reference Thillai Rajasekar, Perumal and Santhanam2005). As temperature, salinity and food supply are different in different locations of an estuary, these studies were conducted at four different locations. The disastrous tsunami of 26 December 2004 (Perumal et al., Reference Perumal, Santhanam, Vijayaragavan, Rajkumar, Balasubramanian, Fernando and Ravichandran2005) hit the coast of the study area between the December and January sampling trips. The coast of Tamil Nadu was severely affected, with thousands of human deaths. Salinification of water sources occurred up to several km from the coast (Perumal et al., Reference Perumal, Santhanam, Vijayaragavan, Rajkumar, Balasubramanian, Fernando and Ravichandran2005), and the topography of the estuary was modified (Kumaraperumal et al., Reference Kumaraperumal, Natarajan, Sivasamy, Chellamuthu, Ganesh and Anandakumar2007). In a study of planktonic fish larvae in the neighbouring Vellar estuary a few days before and a few days after the tsunami, Sundaramanickam et al. (Reference Sundaramanickam, Vijayalakhsmi, Balasubramanian, Balasubramanian, Fernando and Ravichandran2005) found that fish larval distributions had moved upstream after the tsunami, perhaps having been directly carried there with the ingress of water. The objective of this study was to understand the effects of both seasonal and local geographical variations of physico-chemical parameters in relation to copepod composition and diversity.
MATERIALS AND METHODS
Study area
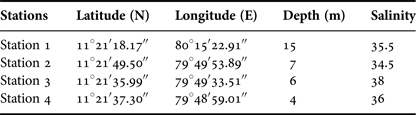
The river Coleroon, a branch of the river Cauvery, originates from Brahmagiri in the Western Ghats, and after meandering for a distance of over 760 km, forms a very fertile delta in the Nagapattinam District of Tamil Nadu before it empties into the Bay of Bengal at Pazhayaru Harbour (11°21′N 79°50’E) on the south-east coast of India (Figure 1; Table 1). Pazhayaru is one of the three major fishing harbours in Tamil Nadu, contributing a large quantity of seafood to the state. The river Coleroon flows into the Bay of Bengal about 10 km south of Parangipettai. The average width of the Coleroon estuary varies from 420 m at the mouth to 100 m in upstream areas. The average depth near the mouth during high tide is about 7 m, and 1–2 m in the tidal and freshwater zones. The Coleroon estuary includes the Pichavaram mangroves on the northern side and the Buckingham Canal and the Vettar backwaters, two small adjacent drainage channels of paddy fields near the mouth on the southern side. The mouth of the Coleroon River is open to the sea, with a semidiurnal tide. Tidal flushing extends up to a distance of about 15 km upstream.

Fig. 1. Map showing the study area.
Table 1. Station locations, depth and characteristic salinity.
The sampling stations in the present study are: Station 1, the Bay of Bengal; Station 2, the mouth of the Coleroon river; Station 3, the Coleroon estuary; Station 4, the Vettar backwaters, during one year (April 2004–March 2005). Each sampling station represents a clearly different environment from the others. Station 1 is at the 10 fathom (~18 m) line in the Bay of Bengal. Station 2 is at the mouth of the Coleroon river, which is highly influenced by freshwater inflow during the north-east monsoon season (October–December). The mean salinity was 33. The bottom is sandy. Station 3 is situated near the mouth of the estuary and opposite to the fishing harbour. The bottom is muddy. Station 4 is located about 1.5 km from Station 2 and is highly influenced by freshwater coming through the adjacent Vettar backwaters. The Vettar backwaters also connect with two channels, ‘Chinna Vettar’ and ‘Semmangadu channel’ (Figure 1; Table 1).
Sampling
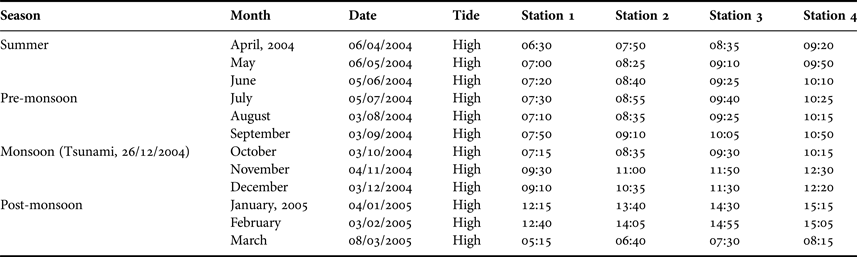
Surface water and copepod samples were collected monthly from the study area (11°21’N 79°50’E) (Figure 1), always around high water, from April 2004 to March 2005 (Table 2). Samples were taken on 3 December 2004, 23 days before the tsunami, and on 4 January 2005, nine days after. Rainfall data were obtained from the office of the Meteorological Department (Government of India) at Coleroon. Air and surface water temperatures were measured using a standard thermometer. Salinity was estimated with a hand refractometer (Atago, Japan) and the pH was measured using an Elico pH meter (Model LC-120). Dissolved oxygen (DO) was estimated by the modified Winkler's method described by Strickland & Parsons (Reference Strickland and Parsons1972). For the analysis of nutrients, surface water samples were collected in polythene bottles and kept in an icebox and transported immediately to the laboratory. The water samples were filtered using a Millipore filtering system (MFS) and the nutrients were analysed according to Strickland & Parsons (Reference Strickland and Parsons1972).
Table 2. Sampling season, date, time and state of the tide.
Copepod samples were collected in horizontal hauls from the surface water using a conical net (mouth area 0.25 m2) made up of bolting silk (mesh size 200 µm) fitted with a calibrated flow meter. Copepod samples were filtered, drained of excess water on absorbent paper and added to a known volume of water to determine the displacement volume. The collected samples were preserved in a 5% buffered formaldehyde–seawater solution, following Goswami (Reference Goswami1982). Depending on the size of the sample, aliquots of 5–10% were examined for the enumeration of copepods and their species. Copepods were computed to counts per unit volume of water filtered using the flow meter readings.
Data analyses
Copepod Dominance Index (Y) in each collection has been calculated using the following formulae:
 $$Y=\displaystyle{{n_i } \over N}f_i$$
where n i is the number of individuals of species i, f i is the frequency of species i that occurred in a sample and N is the total number of species, the Shannon–Weaver diversity index (Tramer, Reference Tramer1969),
 $$H^{\prime}=-\Sigma\semicolon \; p_{i}\ln p_{i}$$
where p i is the number of individuals in the ith species, Pielou's evenness index (Tramer, Reference Tramer1969),
 $$J^{\prime} = H^{\prime}/\ln S$$
where S is the total number of species and the Margalef species diversity index (Warwick & Clarke, Reference Warwick and Clarke1995),
 $$D_{Mg}=\lpar S - 1\rpar /\ln N$$
where N is the total number of individuals.
Correlation coefficients (r) were calculated between copepod abundance and physico-chemical variables, and one-way analysis of variance (ANOVA) tests were made for hydrological variables in relation to stations and seasons. A suite of statistical analyses carried out using the statistical packages Origin Pro (v.7.5) and SPSS (v.16 for Windows, SPSS, Chicago, IL, USA) to elucidate the variations among the physico-chemical variables.
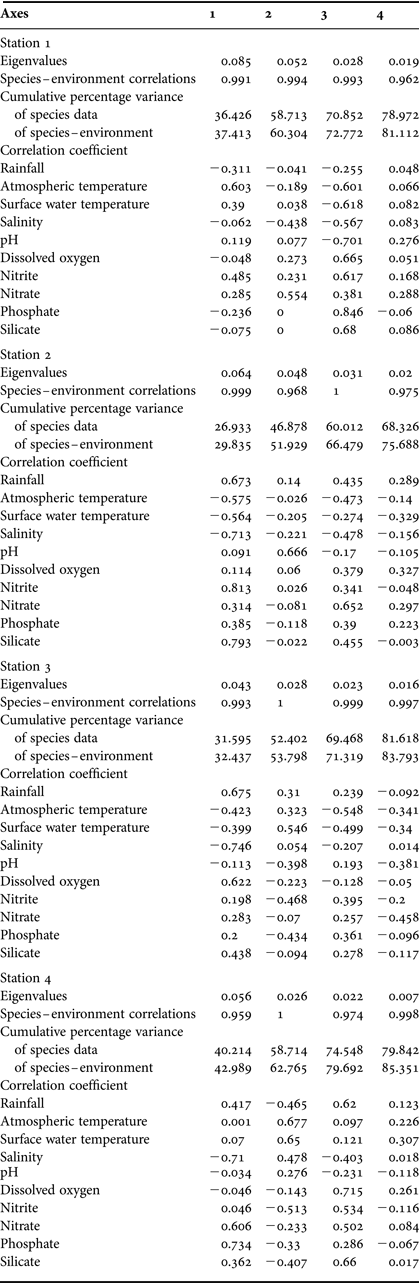
Canonical correspondence analysis (CCA) was performed to evaluate possible correlations between environmental variables, copepod species and variance by month, using stepwise regression. The CCA was performed using the multivariate statistical software CANOCO routine (v.4.53, Ter Braak, Reference Ter Braak1986; Ter Braak & Smilauer, Reference Ter Braak and Smilauer2002) implemented in CANOCO linking copepod communities with environmental variables (rainfall, air temperature, surface water temperature, salinity, pH, DO, nitrate, nitrite, phosphate and silicate). The CCA for all collections was performed on selected species, on the basis of their Dominance Index (Y) and in the light of known environmental data. A Monte Carlo permutation test (unrestricted) was used to determine the significance of species–environment relationships for all the collections at Stations 1, 2, 3 and 4 separately, and the results are given in Table 5.
In the results section below values are expressed as mean ±SD.
RESULTS
Physico-chemical variables
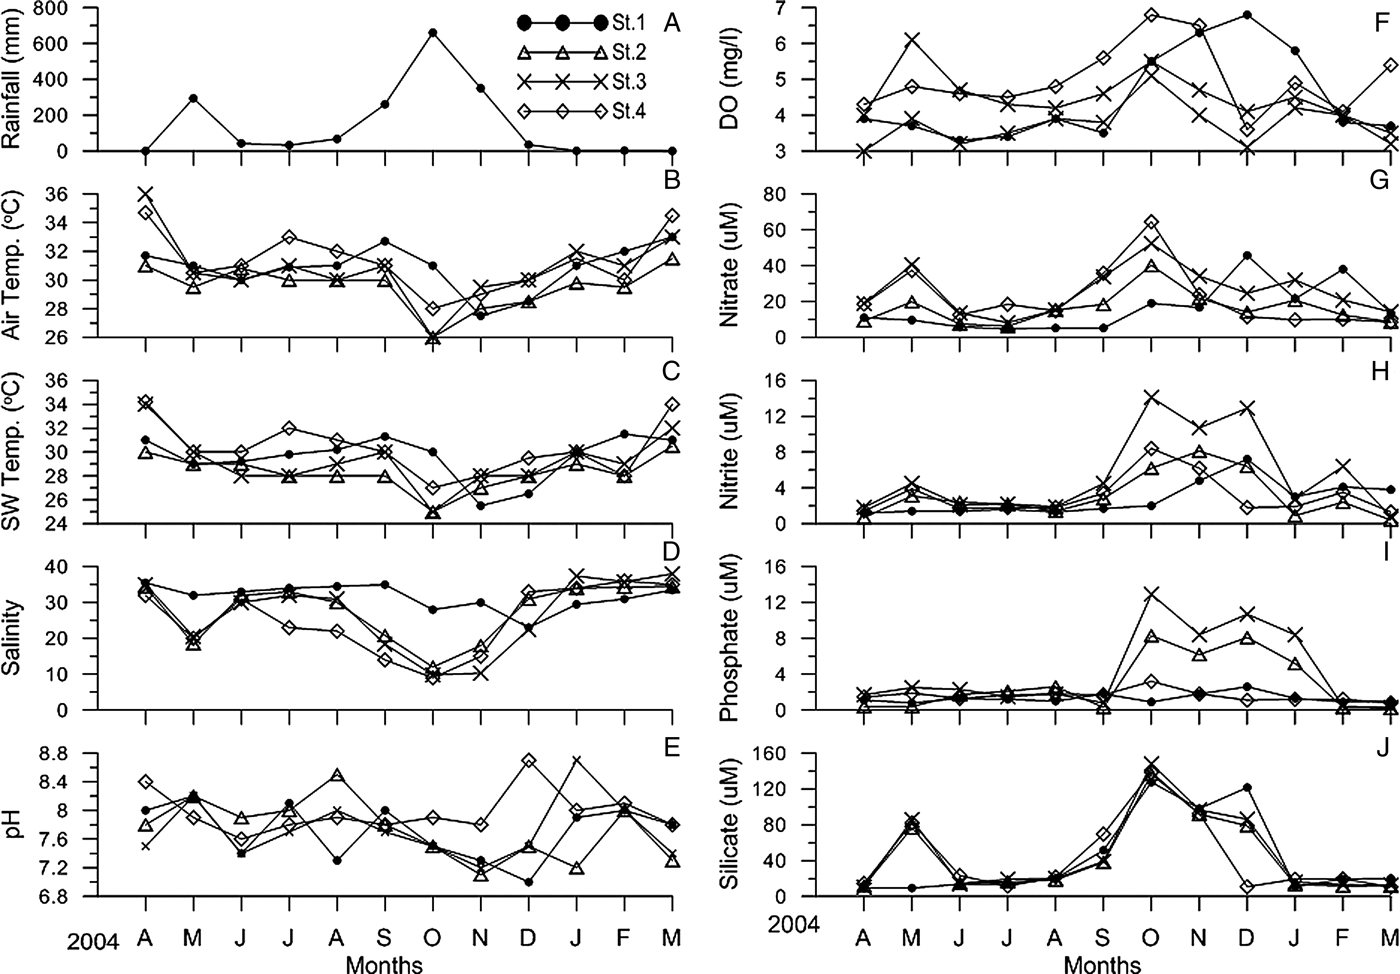
Monthly rainfall ranged between 1 mm (post-monsoon season) and 660 mm (monsoon season). No rainfall was recorded during March 2004 and April 2005 (Figure 2A). Air temperature varied from 26°C to 36°C for all the four stations, with values of 29.55 ± 1.48 (Station 2) and 31.26 ± 2.03 (Station 4) (Figure 2B). Surface water temperature varied from 25°C to 34.2°C for all the four stations, with values of 29.25 ± 2.26 (Station 3) and 30.30 ± 2.23 (Station 4) (Figure 2C). Salinity varied from 9 to 38 for all the four stations, with values of 26.72 ± 10.13 (Station 3) and 31.58 ± 3.57 (Station 1) (Figure 2D). pH in water ranged between 7.0 and 8.7 for all the four stations, with values of 7.73 ± 0.42 (Stations 2 & 3) and 7.97 ± 0.30 (Station 4) (Figure 2E). Variation in DO content was from 3.0 to 6.8 ml l−1 for all the four stations, with values of 3.74 ± 0.59 ml l−1 (Station 2) and 4.99 ± 0.94 ml l−1 (Station 4) (Figure 2F). Nitrate varied from 4.7 to 64.5 µM for all the four stations, with values of 16.17 ± 9.29 µM (Station 2) and 25.70 ± 13.05 µM (Station 3) (Figure 2G). Nitrite ranged between 0.4 and 14.1 µM for all the four stations, with values of 2.79 ± 1.86 µM (Station 1) and 5.39 ± 4.64 µM (Station 3) (Figure 2H). Phosphate varied from 0.2 to 12.93 µM for all the four stations, with values of 1.30 ± 0.52 µM (Station 1) and 4.31 ± 4.47 µM (Station 3) (Figure 2I). Silicate ranged between 9.3 and 148 µM for all the four stations, with values of 42.78 ± 42.24 µM (Station 4) and 46.75 ± 45.7 µM (Station 3) (Figure 2J). In relation to the tsunami, the differences between the December and January samples relative to the general seasonal curves showed no striking differences in physico-chemical variables, except for a marked increase in nitrite, phosphate and silicate in October, November and December, associated with lowered salinities during the monsoon.
Fig. 2. Monthly inter-station physico-chemical variables during the study period. (A) Rainfall; (B) air temperature; (C) surface water temperature;(D) salinity; (E) pH; (F) dissolved oxygen; (G) nitrate; (H) nitrite; (I) phosphate; (J) silicate.
Species composition and abundance
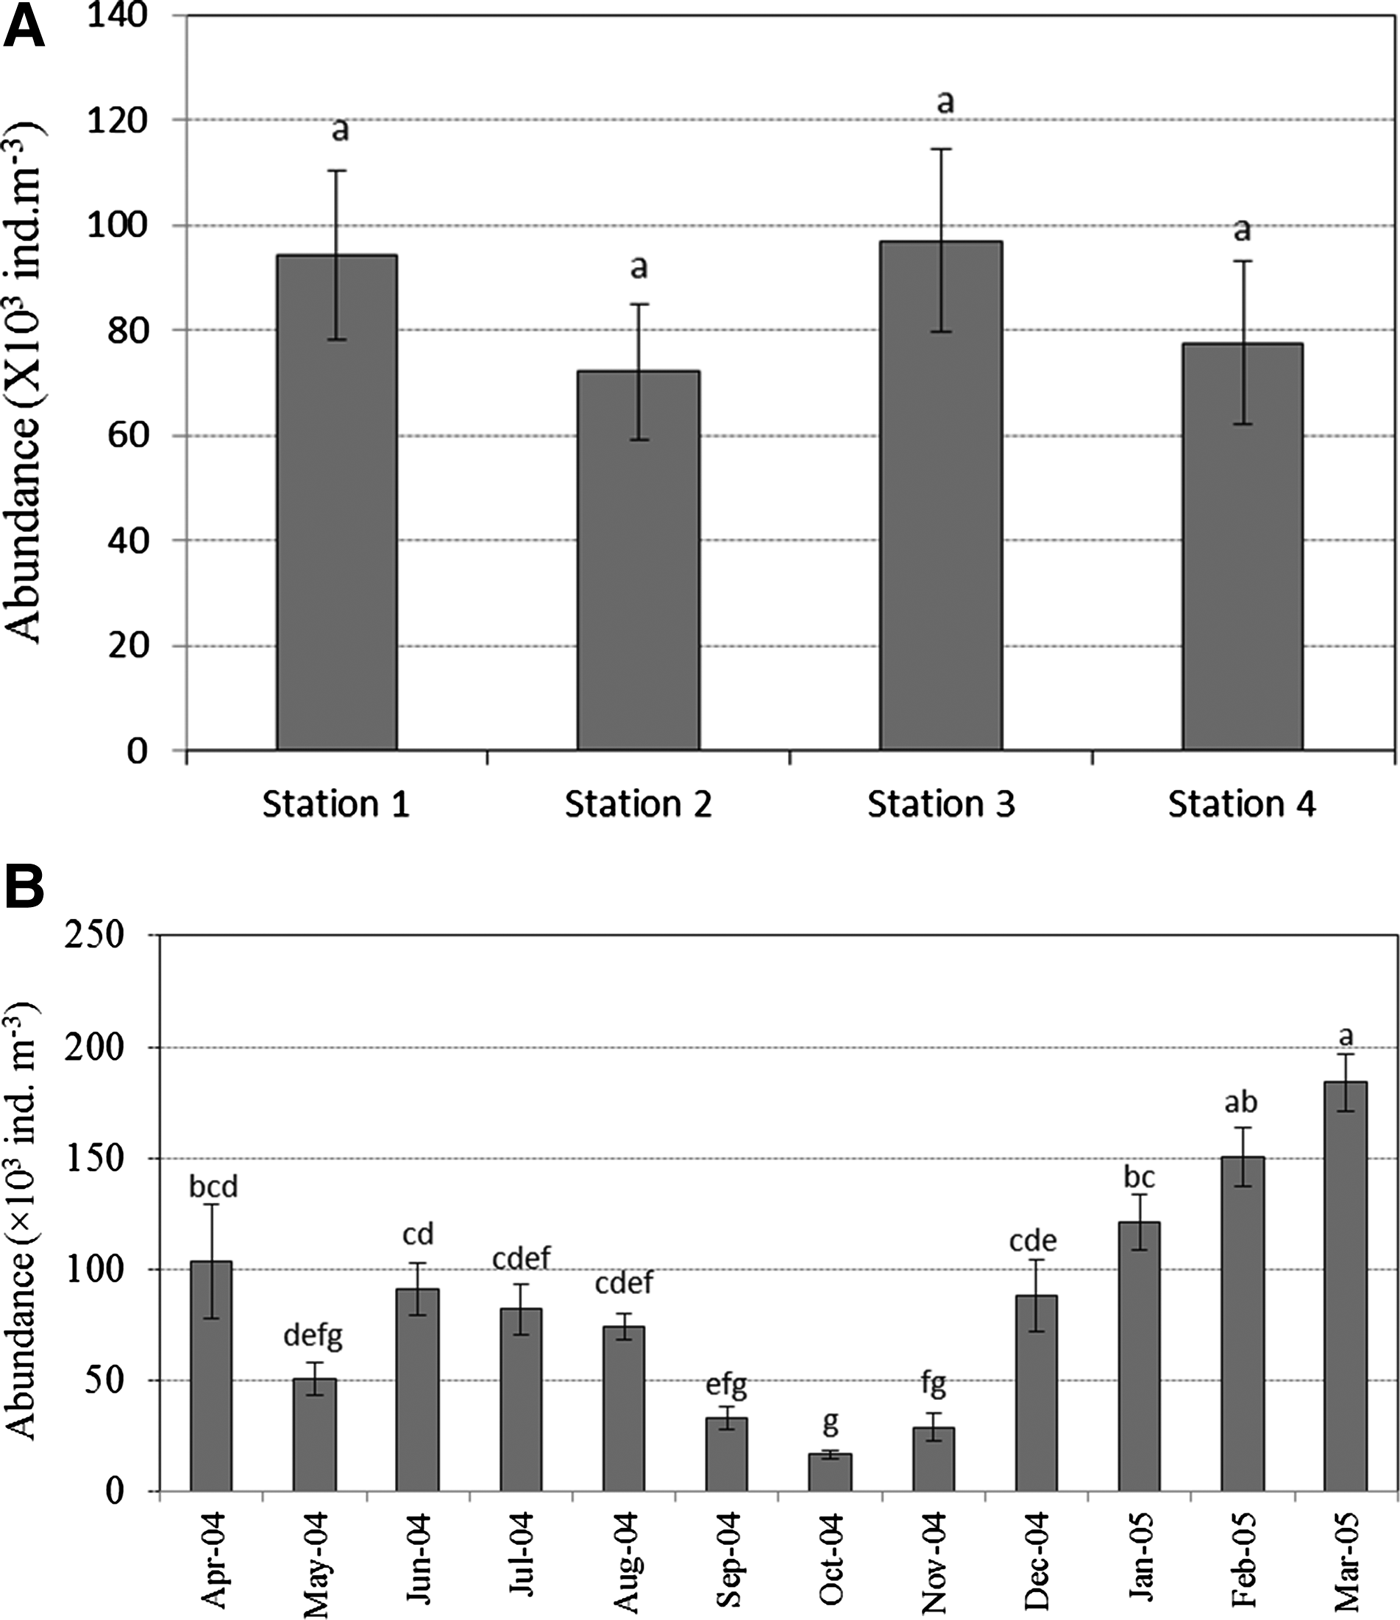
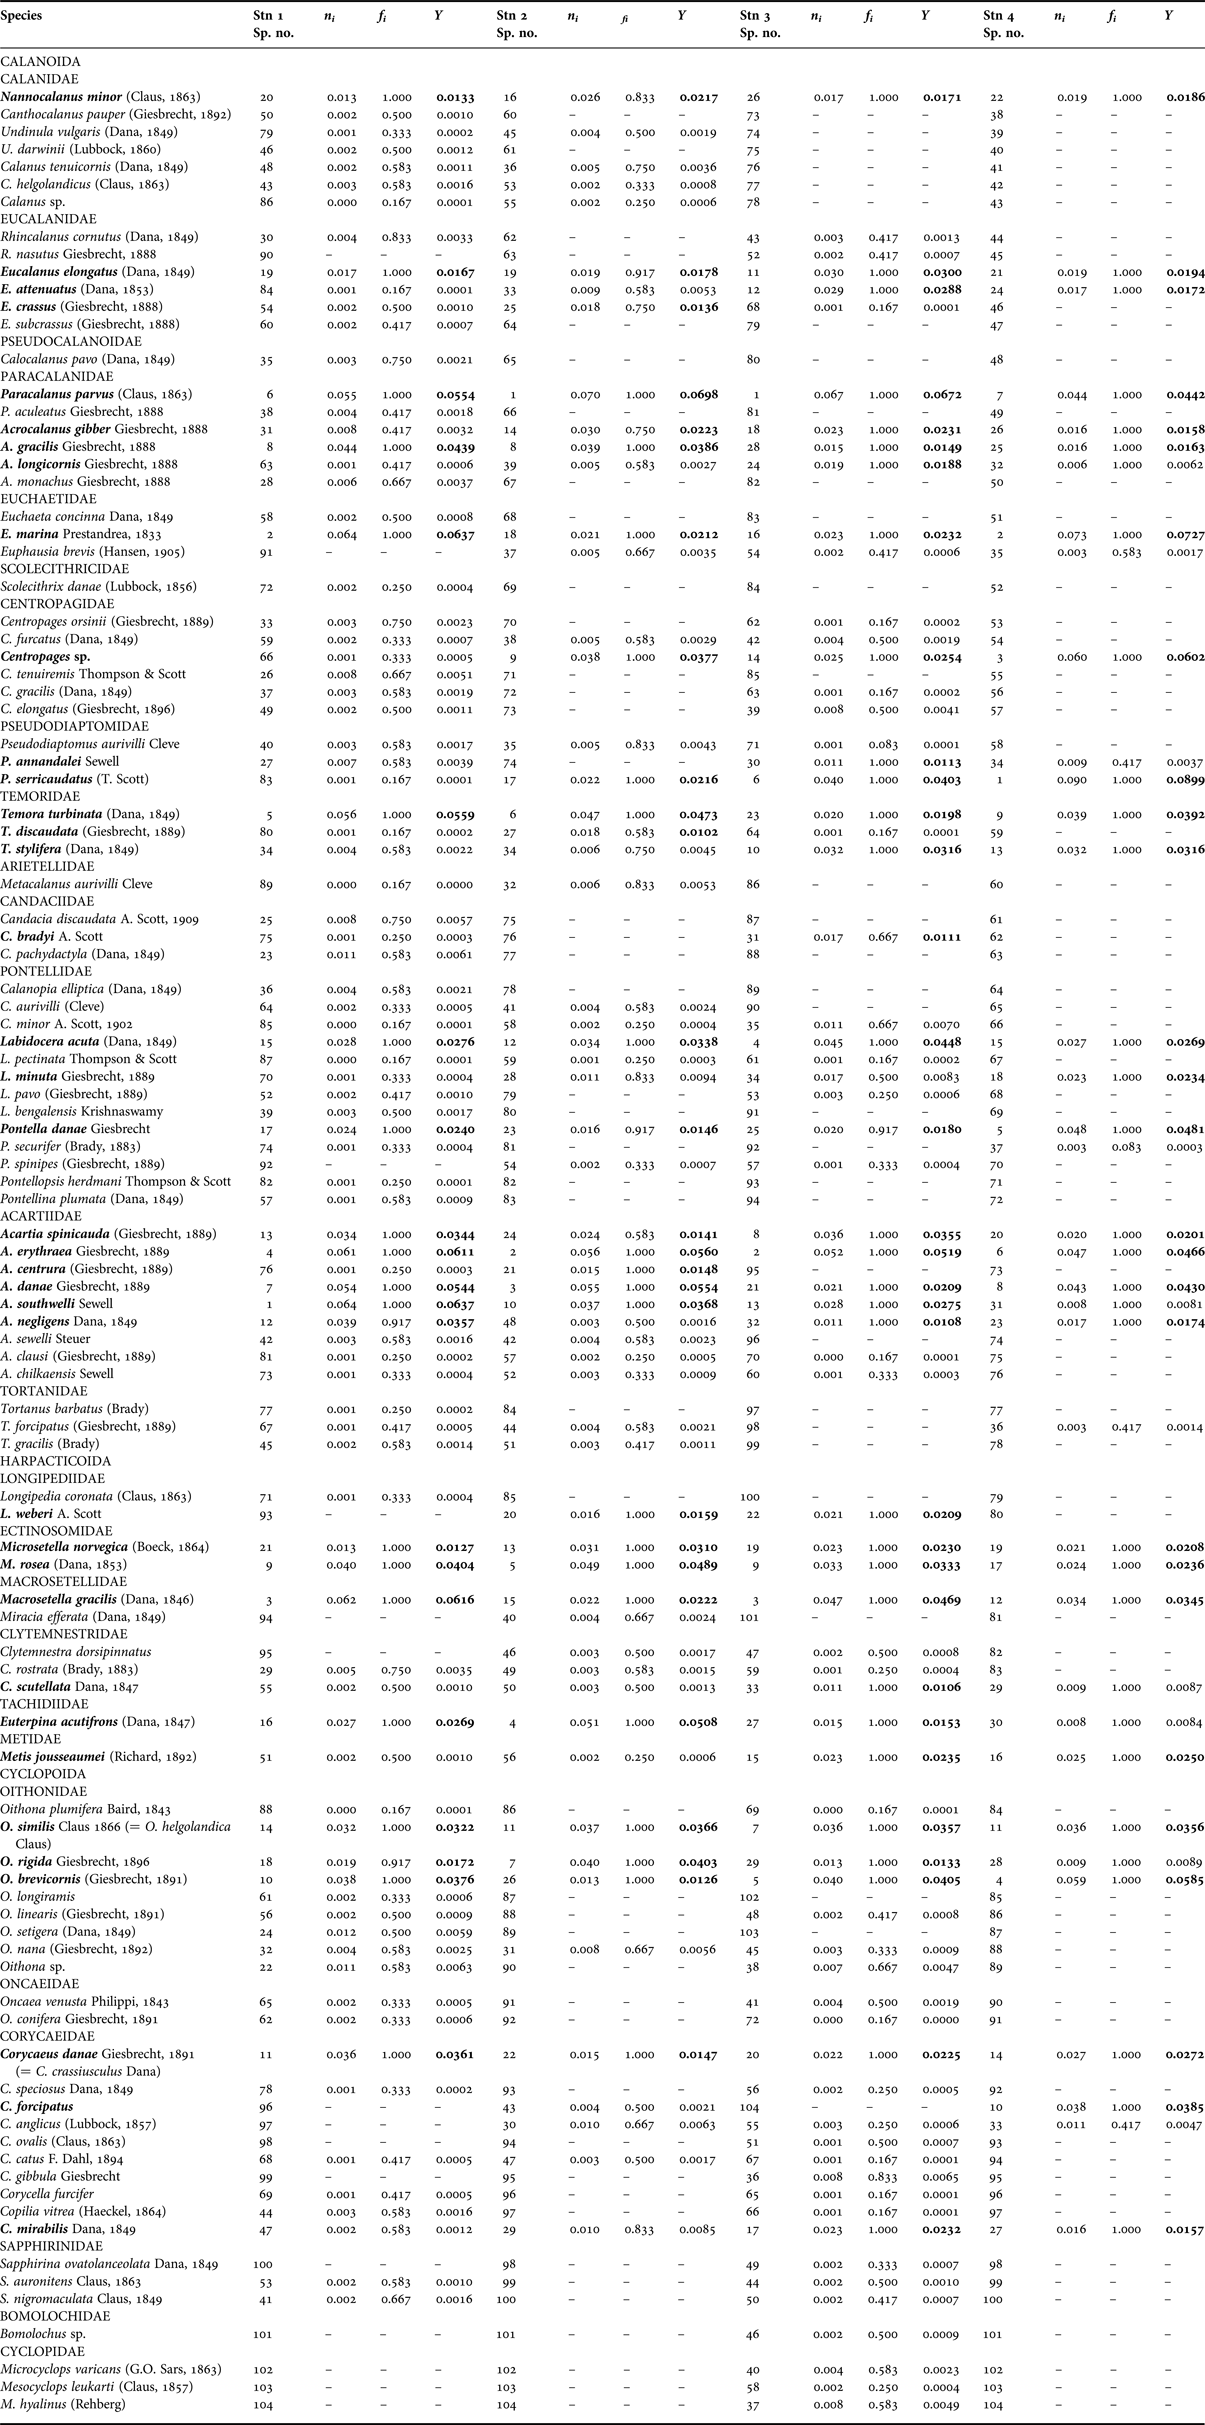
A total of 104 species of copepods belonging to 26 families and 38 genera were identified at the four stations (Table 3): 65 Calanoid species, 11 Harpacticoid species and 28 Cyclopoid species. From the samples studied, 31 species, (20 Calanoida, six Harpacticoida and five Cyclopoida) were found to be common at all four stations. Inter-station and temporal variations of dominant copepod abundance during April 2004–March 2005 are shown in Figure 3. There was no statistical difference (P > 0.05) in copepod abundance between any of the stations, while temporal variation in copepod abundance was significant (P < 0.05) (Figure 3). Highest copepod abundance was observed in March, followed by February, January, April, June, December, July, August, May, September, November and October.
Fig. 3. Inter-station (A) and temporal (B) variations of copepod abundance based on two-way ANOVA. Bars with no letter in common are significantly different based on the Tukey test (P < 0.05). Data are mean ± standard error.
Table 3. Dominant and common copepod species recorded. (Species number is used in CCA, n i is species abundance, f i is species frequency, Y is the Dominance Index). Species with a value of Y > 0.01 at any station are highlighted in bold type.
Diversity and community structure
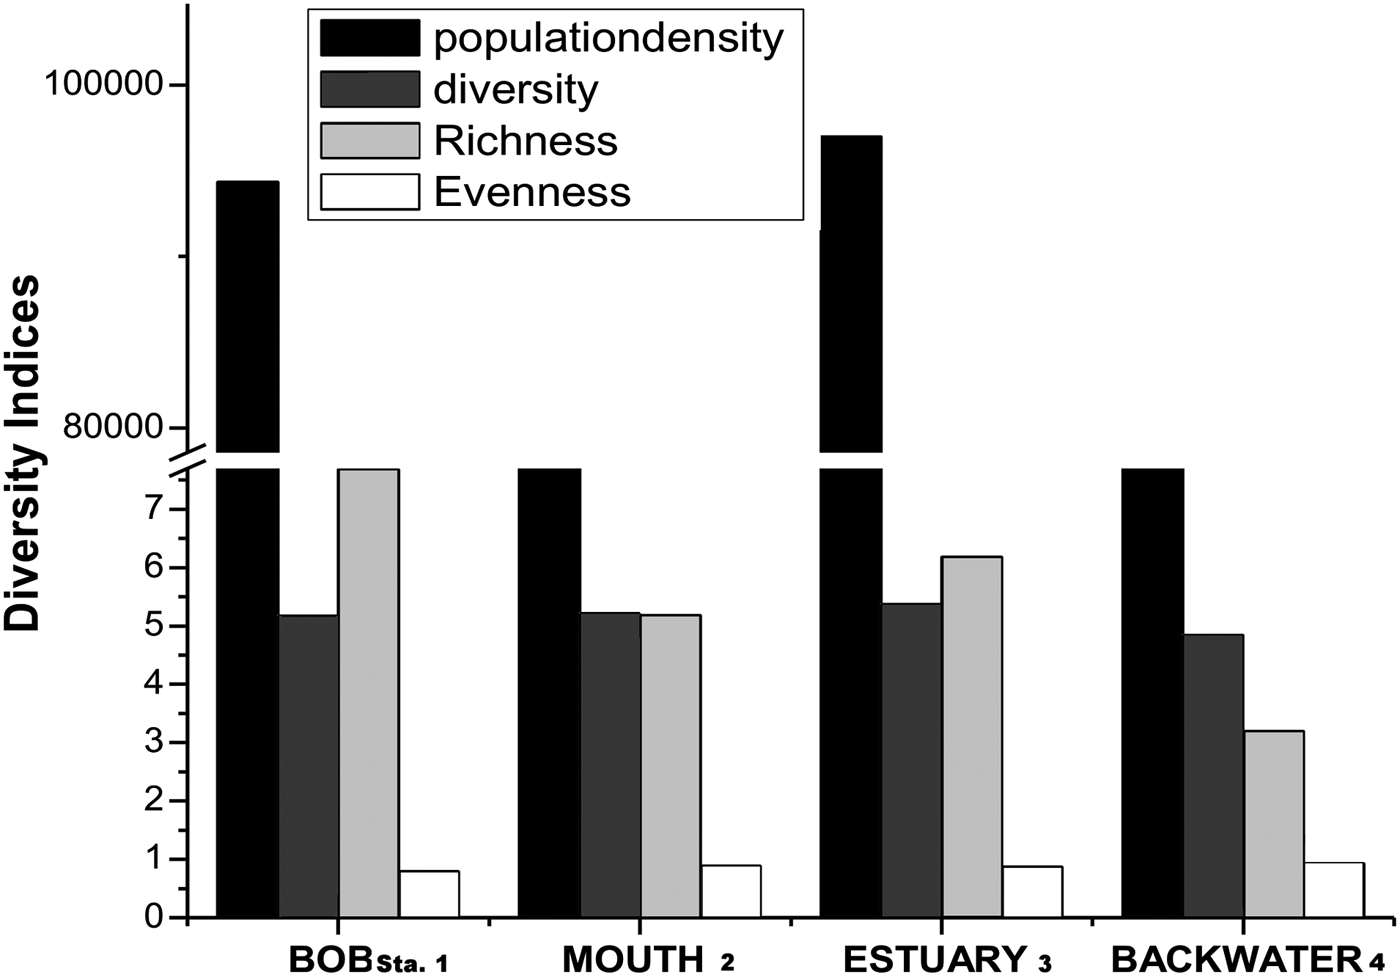
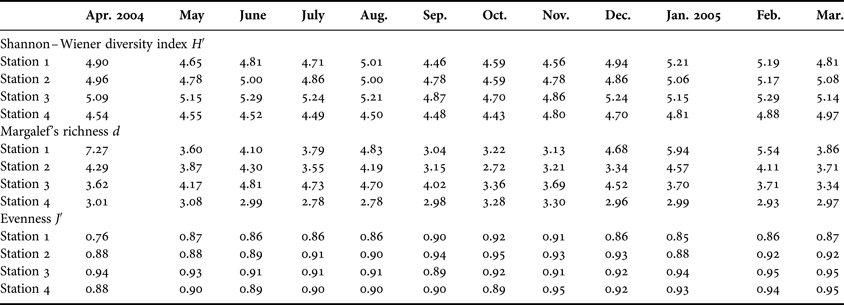
Copepod diversity ranged between 4.43 and 5.29 for all the four stations, with values of 4.63 ± 0.18 (Station 4) and 5.10 ± 0.18 (Station 3) (Figure 4). Copepod richness ranged between 2.71 and 7.27 for all the four stations, with values of 3.0 ± 0.16 (Station 4) and 4.41 ± 1.29 (Station 3). Copepod evenness ranged between 0.75 and 0.95 for all the four stations, with values of 0.86 ± 0.04 (Station 1) and 0.92 ± 0.01 (Station 3) (Table 4). Finally, overall diversity indices of copepod abundance (ind. m−3), diversity, richness and evenness were: 72 × 103–97 × 103; 4.83–5.36; 3.19–7.68 and 0.79–0.92, respectively.
Fig. 4. Station-wise copepod abundance, diversity (Shannon–Wiener diversity index), richness (Margalef's richness) and evenness. BOB, MOUTH, ESTUARY and BACKWATER indicate Station 1, Station 2, Station 3 and Station 4, respectively.
Table 4. Mean diversity measurements for copepod fauna.
The results of the multivariate analysis (CCA) for all the stations are shown in Table 5. At Station 1, the first CCA axis initially separated nitrate, pH, nitrite and surface water temperature along with two monthly sampling collections, January 2005 and February 2005 (Figure 5A). On the second CCA axis, the only environmental factor was air temperature along with a single month sampling collection, March 2005. The third CCA axis further separated phosphate, silicate, rainfall and salinity along with six loosely related monthly sampling collections, September 2004, July 2004, August 2004, May 2004, April 2004 and December 2004. The only associated environmental variable, DO, was with the fourth CCA axis, and heavily impacted in the monsoon (November 2004 and October 2004) and summer (June 2004). Most of the copepod species were concentrated on the first CCA axis (Figure 5B). Rainfall was related to Acartia southwelli, air temperature was related to Calocalanus pavo, surface water temperature was related to Acrocalanus monochus and Calanus tenuicornis, while salinity was related to A. gracilis, DO was related to Acartio danae and Oithona similis, and pH was related to Eucalanus elongatus at Station 1. Nutrients (nitrate, nitrite, phosphate and silicate) were related to E. elongatus, A. spinicauda, Temora stylifera, O. rigida, A. negligens, Microsetella norvegica, O. nana and A. southwelli at Station 1.
Fig. 5. (A) CCA showing scatter plot for 12 monthly sampling vs ten environmental variables at Station 1; (B) CCA showing scatter plot for copepod species vs environmental variables at Station 1 (species numbers refer to Table 3).
Table 5. CCA details and correlation of variables with the different axes.
At Station 2, the first CCA axis separated pH, DO, rainfall and nitrite along with four monthly sampling collections, June 2004, August 2004, July 2004 and May 2004 (Figure 6A). The second CCA axis separated silicate, nitrate and phosphate along with four monthly sampling collections, September 2004, November 2004, October 2004 and December 2004. The third CCA axis separated the temperature (air and surface water) and salinity along with three loosely related monthly sampling collections, January 2005, February 2005 and March 2005. The fourth CCA axis, in summer, was not strongly associated with any single variable, but with the April 2004 sample. Most of the copepod species were found spread equally on all axes (Figure 6B). Rainfall was related to Tortanus forcipatus, air temperature was related to A. danae, Euterpina acutifrons and E. attenuatus, while surface water temperature and salinity were related to Pseudodiaptomus aurivilli, Euphausia brevis and Miracia efferata. Dissolved oxygen was related to O. similis, pH was related to C. tenuicornis, Corycaeus forcipatus and C. anglicus at Station 2. Nutrients (nitrate, phosphate and silicate) were related to Acrocalanus gracilis, Labidocera acuta and Metacalanus aurivilli at Station 2.
Fig. 6. (A) CCA showing scatter plot for 12 monthly sampling vs ten environmental variables at Station 2; (B) CCA showing scatter plot for copepod species vs environmental variables at Station 2 (species numbers refer to Table 3).
At Station 3, only one environmental variable, rainfall, condensed on the first CCA axis, and it strongly associated six pre-monsoon and monsoon monthly sampling collections, April 2004, May 2004, August 2004, November 2004, September 2004 and October 2004 (Figure 7A). The second CCA axis separated nitrate, silicate, DO, phosphate and nitrite along with two monthly sampling collections, June 2004 and July 2004. On the third CCA axis, the only environmental factor was pH along with three monthly sampling collections, February 2005, January 2005 and December 2004. The fourth CCA axis separated the temperature (air and surface water) and salinity along with a post-monsoon month, March 2005. Most of the copepod species were found spread equally on all axes (Figure 7B). Rainfall was related to Acartia spinicauda and L. acuta, air temperature was related to Clytemnestra dorsipinnatus, E. acutifrons and E. attenuatus, surface water temperature was related to P. annandalei, Centropages elongatus, C. danae and O. brevicornis, salinity was related to Nannocalanus minor, DO was related to Paracalanus parvus, pH was related to Euchaeta marina at Station 3. Nutrients (nitrate and silicate) were related to A. erythraea and L. acuta at Station 3.
Fig. 7. (A) CCA showing scatter plot for 12 monthly sampling vs ten environmental variables at Station 3; (B) CCA showing scatter plot for copepod species vs environmental variables at Station 3 (species numbers refer to Table 3).
At Station 4, the first CCA axis separated the temperature (air and surface water) along with two monthly sampling collections, April 2004 and May 2004 (Figure 8A). The second CCA axis separated nitrite, silicate, rainfall, nitrate and phosphate along with six monthly sampling collections, November 2004, October 2004, September 2004, June 2004, July 2004 and August 2004. On the third CCA axis, the only environmental variable was DO along with two monthly sampling collections, December 2004 and February 2005. The fourth CCA axis separated pH and salinity along with two monthly sampling collections, January 2005 and March 2005. Most of the copepod species were found spread equally on all axes (Figure 8B). Rainfall was related to E. marina, temperature (air and surface water), salinity and DO were related to Acrocalanus gibber, pH was related to C. danae at Station 4. Nutrients (nitrate, nitrite, phosphate and silicate) were related to N. minor, Acartia danae, Acrocalanus gibber, A. longicornis, E. marina and Copilia mirabilis at Station 4.
Fig. 8. (A) CCA showing scatter plot for 12 monthly sampling vs ten environmental variables at Station 4; (B) CCA showing scatter plot for copepod species vs environmental variables at Station 4 (species numbers refer to Table 3).
The copepod population abundance (i.e. summed abundance of all species) showed a positive correlation with temperature and salinity and a negative correlation with rainfall, DO and pH. At Station 1, the correlation of copepod species diversity with population abundance was highly significant (r = 0.76), as was that of species richness with species diversity (r = 0.87). At Station 2, the correlation of species diversity with population abundance (r = 0.80) and species richness (r = 0.79) was significant at (P < 0.01). At Station 3, the correlation of copepod species diversity with population abundance (r = 0.63) was significant. Also, the correlation of species richness with species diversity was also highly significant (r = 0.93). At Station 4, the correlation of species diversity with population abundance (r = 0.74) and species richness (r = 0.989) was significant at P < 0.01.
DISCUSSION
Rainfall in south-eastern India is largely influenced by the north-east monsoon. In the mouth of the Coleroon, the variations in physico-chemical parameters are closely associated with the strong variation in copepod abundance and distribution. Rainfall shows a marked annual cycle and, correspondingly, so do the hydrological variables in the estuarine system. During the monsoon rainfall, the Coleroon estuary receives heavy freshwater inflow from land drainage, associated with which were the abrupt changes we found in all the analysed physico-chemical variables. Peak values of rainfall in the present study occurred during the monsoon month of October (Rajkumar et al., Reference Rajkumar, Perumal, Ganesan, Shanmuga Sundaram and Sakhare2009). Tidal rhythm, water currents and evaporation in summer produced only slight variation in those variables.
The surface water temperature showed an increasing trend from December to April, associated with high solar radiation, and low temperature recorded during the monsoon could be due to strong sea breezes, rainfall and cloudy skies (Ashok Prabu et al., Reference Ashok Prabu, Rajkumar and Perumal2008). The spatial variation in temperature could be due to the intensity of prevailing currents and consequent lateral mixing (Rajkumar et al., Reference Rajkumar, Perumal, Ganesan, Shanmuga Sundaram and Sakhare2009). This can be further explained by the correlation between air and surface water temperature. The strong positive correlations observed between air and surface water temperature at all four stations ranged between 0.923 and 0.982.
In estuaries, salinity is generally the main hydrological determinant of copepod diversity and distribution (Mouny & Dauvin, Reference Mouny and Dauvin2002; Tackx et al., Reference Tackx, Nathalie, Riet, Azémar, Hannouti, Van Damme, Fiers, Daro and Meire2004; Marques et al., Reference Marques, Azeiteiro, Marques, Neto and Pardal2006). Generally, salinity changes in estuaries, backwaters and mangroves are due to two predominant factors: firstly, the influx of freshwater from land run-off largely caused by monsoons; secondly, tidal variations. This is illustrated by the negative correlation (r = −0.23 at Station 1, r = −0.97 at Station 2, r = −0.89 at Station 3 and r = −0.88 at Station 4) obtained between salinity and rainfall. In the study area, salinity showed a significant positive correlation with temperature. The higher salinity found during post-monsoon and summer was most probably caused by the high evaporation (Rajkumar et al., Reference Rajkumar, Perumal, Ganesan, Shanmuga Sundaram and Sakhare2009).
Surface waters remained of high pH throughout the study period at all stations, with maximum values during the pre monsoon, post monsoon and summer, and minimum during the monsoon. Generally, fluctuations in pH throughout the year are attributed to factors such as the removal of CO2 by photosynthesis through bicarbonate degradation, dilution of seawater by freshwater influx, reduction of temperature and decomposition of organic matter (Ashok Prabu et al., Reference Ashok Prabu, Rajkumar and Perumal2008). The observed higher pH in summer might be caused by seawater inundation and relatively high biological activity (Rajkumar et al., Reference Rajkumar, Perumal, Ganesan, Shanmuga Sundaram and Sakhare2009), manifest in the abundance of photosynthetic organisms (Saravanakumar et al., Reference Saravanakumar, Rajkumar, Sesh Serebiah and Thivakaran2008).
Temperature and salinity both affect the dissolution of oxygen (Rajkumar et al., Reference Rajkumar, Perumal, Ganesan, Shanmuga Sundaram and Sakhare2009). The presently recorded lower summer values could be mainly due to reduced agitation and turbulence of the coastal and estuarine waters. The recorded higher DO concentration during the monsoon season might be due to the cumulative effect of higher wind velocity coupled with heavy rainfall and the resultant mixing (Ashok Prabu et al., Reference Ashok Prabu, Rajkumar and Perumal2008). Rajkumar et al. (Reference Rajkumar, Perumal, Ganesan, Shanmuga Sundaram and Sakhare2009) have attributed the seasonal variation in DO mainly to freshwater influx and terrigenous impact of sediments. Further, the presently obtained significant positive relationship between rainfall and nutrients, particularly at Stations 2–4 (Figure 2), suggests that river leaching and scouring constituted the main source of the nutrients in the estuary.
In the marine environment, nutrients are required for growth, reproduction and the metabolic activities of primary producers (Ashok Prabu et al., Reference Ashok Prabu, Rajkumar and Perumal2008). Distributions of nutrients are based mainly on the season, tidal conditions and freshwater flow from land sources. The high concentration of inorganic phosphate observed during the monsoon season might be due to the washing down of land drainage (Saravanakumar et al., Reference Saravanakumar, Rajkumar, Sesh Serebiah and Thivakaran2008). Further, regeneration and release of total phosphorus from bottom mud into the water column by turbulence and mixing could also contribute to the recorded higher monsoonal values (Ashok Prabu et al., Reference Ashok Prabu, Rajkumar and Perumal2008). The recorded highest phosphate and nitrate concentrations during the monsoon season could be attributed to the heavy rainfall, land run-off, nutrient-enriched shrimp farm discharge and autochthonous sources. In addition, anthropogenic activities like fertilizer application on agricultural fields and alkyl phosphates used in households as detergents could be other sources for the higher amounts of inorganic nitrate and phosphate (Ashok Prabu et al., Reference Ashok Prabu, Rajkumar and Perumal2008; Rajkumar et al., Reference Rajkumar, Perumal, Ganesan, Shanmuga Sundaram and Sakhare2009). The observed maximum values of nitrate during the monsoon season at all the stations may be due to anthropogenic inputs and organic matter from the catchment area during the ebb tide (Ashok Prabu et al., Reference Ashok Prabu, Rajkumar and Perumal2008). The low values recorded during non-monsoonal periods may be due to decreased run-off and to the utilization of phosphates by phytoplankton, as evidenced by high photosynthetic activity and, at Station 1, also due to the dominance of marine water having negligible amounts of nitrate (Rajkumar et al., Reference Rajkumar, Perumal, Ganesan, Shanmuga Sundaram and Sakhare2009).
The silicate content was high relative to that of the other nutrients (nitrate, nitrite and phosphate) and the recorded higher monsoonal values may be due to the heavy influx of freshwater derived from land drainage carrying silicate leached out from rocks and from the bottom sediment (Ashok Prabu et al., Reference Ashok Prabu, Rajkumar and Perumal2008). The low concentration of silicate recorded during the post-monsoon and summer seasons could be attributed to the incorporation of silicate by phytoplankton (Ashok Prabu et al., Reference Ashok Prabu, Rajkumar and Perumal2008).
During the present study, the planktonic copepods of the estuary were represented by 104 species belonging to 38 genera of 26 families. Calanoid copepods constituted the dominant group represented by 65 species. Cyclopoids and Harpacticoids were represented by 28 and 11 species, respectively. Thus, the species composition of copepods in Coleroon estuary is comparable with those of the Bahuda estuary (Mishra & Panigrahy, Reference Mishra and Panigrahy1996), the Hooghly estuary (Sarkar et al., Reference Sarkar, Sing and Choudhury1986), the Godavari estuary (Padmavathi & Satyanarayana, Reference Padmavathi and Satyanarayana1996), the Mandovi and Zuari estuaries (Dalal & Goswami, Reference Dalal and Goswami2001) and the Vellar estuary (Kumar, Reference Kumar1991), but was different from that of the Mandarmani Creek (Mitra et al., Reference Mitra, Patra and Panigrahy1990). In the Mandarmani Creek, out of the 31 species of planktonic copepods, Harpacticoida was represented by only one species (Macrosetella glacialis), as against 11 species encountered during the present study. In general, the highest numbers of species were found during the summer season followed by the post-monsoon season. The relative peak in copepods during the summer season may be attributed to the recruitment of neritic species through massive ingress of seawater into the estuary due to tidal influence. A similar pattern of species abundance of copepods has also been reported from many other Indian estuaries (Mishra & Panigrahy, Reference Mishra and Panigrahy1996; Ramaiah & Nair, Reference Ramaiah and Nair1997; Dalal & Goswami, Reference Dalal and Goswami2001).
Salinity is the main hydrological parameter controlling plankton diversity in temperate estuaries (Mouny & Dauvin, Reference Mouny and Dauvin2002; Tackx et al., Reference Tackx, Nathalie, Riet, Azémar, Hannouti, Van Damme, Fiers, Daro and Meire2004; Marques et al., Reference Marques, Azeiteiro, Marques, Neto and Pardal2006). This is reflected in the present study, where at all stations (Figures 5–8) salinity was also negatively related to rainfall and nutrients (Si, NO3, NO2 and P). Correlation between salinity and copepod abundance was lowest at Station 1, increasing upstream (r = 0.29 at Station 1; r = 0.66 at Station 2; r = 0.79 at Station 3 and r = 0.86 at Station 4). Furthermore, as in all estuaries, salinity preference is a primary way to group the species (Wooldridge, Reference Wooldridge, Allanson and Baird1999), which can be divided into three main categories (Dalal & Goswami, Reference Dalal and Goswami2001).
Category I. Perennial copepod (Euryhaline) species, which are found during most of the year. The species belonging to this group include: A. longicornis, A. monochus, A. gracilis, A. gibber, E. elongatus, E. crassus, E. subcrassus, P. parvus, P. annandalei, L. acuta, L. pavo, L. pectinata, Pontella spinipes, A. clausi, A. spinicauda, A. danae, T. discaudata, T. forcipatus, O. similis, O. brevicornis, M. gracilis, M. norvegica, M. rosea and E. acutifrons. These species contribute over 60% of the total copepod population at any given time. They can be considered as the resident species of the estuary.
Category II. Seasonal copepods (Stenohaline) occurred mainly in marine brackish water (15–30 psu) and had a limited period of existence in the estuary. They are P. aculeatus, P. aurivilli, C. danae, C. furcatus, A. erythraea, O. rigida, O. linearis, N. minor, Scolecithrix danae and Candacia bradyi. These species were abundant during the post monsoon period when the salinity was progressively increasing.
Category III. Casual migrants that were found sporadically in plankton catches. They constitute: (a) both the marine or stenohaline (>30 psu) forms and include T. turbinata, C. mirabilis, Clytemnestra scutellata, T. gracilis, C. catus and Longipedia weberi; (b) oligostenohaline or brackish freshwater (>5–15 psu) forms like Pontellopsis herdmani, Oncaea venusta, O. conifera, L. minuta, Metis jousseaumei, Sapphirina ovatolaneaolata, S. nigromaculata; and (c) limnetic (<5 psu) forms particularly Mesocyclops hyalinus. The period of existence and numerical abundance of each of these showed marked seasonal fluctuations.
Temperature is also very important in determining the seasonality in copepods species composition (David et al., Reference David, Sautour, Chardy and Leconte2005; Lionard et al., Reference Lionard, Azémar, Boulêtreau, Muylaert, Tackx and Vyverman2005; Rahman, Reference Rahman2006). During the present observation, species belonging to the families, Paracalanidae, Acartiidae, Tachidiidae, Ectinosomidae and Oithonidae dominated the copepod counts, occurring throughout the year. Seasonal variations in copepod abundance similar to those observed in the present study have been reported from the Caribbean and adjacent areas (Rios-Jara, Reference Rios-Jara1998). In contrast, studies from the Caribbean coastal coral reef environment found no evidence of seasonality (Moore & Sander, Reference Moore and Sander1976). The species, A. erythraea, A. spinicauda, A. danae, P. parvus, O. brevicornis, O. similis and E. acutifrons were dominant, and in the present study they successfully flourished year-round. The abundance of these species might be due to their ability to breed continuously (Godhantaraman, Reference Godhantaraman1994). Dwivedi et al. (Reference Dwivedi, Bhargava, Parulekar, Selvakumar, Singbal and Satyanarayanan1974) also reported similar dominance of these species in bulk to the biomass of macrozooplankton in the Mandovi and Zuari estuaries. Among the copepods observed, A. erythraea and O. brevicornis were predominant throughout the year. This may be due to their continuous breeding behaviour, quick larval development and the fact that they adapt well to the environmental conditions of the estuaries. Chandramohan (Reference Chandramohan1977) reported this type of dominance of Acartia spp. among calanoids in the Godavari estuary and by Madhupratap (Reference Madhupratap1999) in the Cochin backwaters. Most of them are neritic and abundant in coastal waters (Yoo et al., Reference Yoo, Hue and Lee1991), and the cyclopoids Oithona spp. were recorded in the Vellar estuary (Kumar, Reference Kumar1991). Acartia and Oithona species are frequently dominant in estuaries and coastal areas, for example in the inlet waters of the Sandy Hook Bay area of New Jersey (Sage & Herman, Reference Sage and Herman1972), Maizuru Bay, Japan (Ueda, Reference Ueda1987) and Malaysian waters (Chong & Chua, Reference Chong and Chua1975). These genera occur frequently in Bombay Harbour–Thana creek–Bassein creek during high salinity periods (Ramaiah & Nair, Reference Ramaiah and Nair1997). In the present study, the order of abundance of the copepod groups was Calanoida > Cyclopoida > Harpacticoida, although they show considerable spatial and temporal variations. In the present study, the copepod population abundance showed a gradual decreasing trend during monsoon season (October–December). Similar reports of monsoonal minima in copepod densities have been observed in Indian estuaries previously (Madhupradap & Rao, Reference Madhupratap and Rao1979; Goswami, Reference Goswami1982; Sarkar et al., Reference Sarkar, Sing and Choudhury1986; Madhupradap, Reference Madhupratap1999). The highest densities were found to occur in the summer and post-monsoon seasons due to increased salinity, and to be associated with peaks in phytoplankton abundance (McKinnon & Throlld, Reference McKinnon and Throlld1993; Mishra & Panigrahy, Reference Mishra and Panigrahy1996). The population densities were higher in the estuary than the adjacent sea because the estuary receives more organic enrichment from the catchment areas.
Among the Acartia genus, A. erythraea, A. danae and A. southwelli were dominant, while in the Oithona genus, O. brevicornis and O. similis were predominant throughout the study period. Among all zooplankton, copepods formed the most important group in the zooplankton community throughout the year, constituting 67.9–97% of the total zooplankton biomass. Among the copepods, the suborder, Calanoida comprised a major component with more species. A gradual decrease was discernible from October to December, and these peaks can be attributed to the favourable hydrological conditions. The bulk of the copepod population was contributed by five genera viz. Paracalanus, Acrocalanus, Acartia, Euterpina and Oithona. The common species were P. parvus, A. gracilis, A. gibber, A. erythraea, A. spinicauda, A. danae, E. acutifrons, O. brevicornis and O. rigida. An almost similar result was observed by Kumar (Reference Kumar1991). The calanoid genus, Acartia comprises over 70 species and is distributed throughout the world's oceans (Mauchline, Reference Mauchline1998). Most of them are neritic and abundant in coastal waters (Yoo et al., Reference Yoo, Hue and Lee1991). Copepods of A. erythraea in subtropical waters generally live on, or slightly above, the bottom in near-shore waters during the day and maintain their position against weak water currents (Ueda et al., Reference Ueda, Kuwahara, Tanaka and Azeta1983). They are highly concentrated in the surface layer in the afternoon (Checkley et al., Reference Checkley, Uye, Dagg, Mullin, Omori, Onbe and Zhu1992). Both A. erythraea and P. parvus are common in the productive coastal water of southern China (Chen, Reference Chen1992) and south of Java (Tranter, Reference Tranter1977).
In the present study, the minimum species diversity occurred during the monsoon season. This might be due to washing out of allochthonous and even some autochthonous species by the heavy monsoonal flood (Rajkumar et al., Reference Rajkumar, Perumal, Ganesan, Shanmuga Sundaram and Sakhare2009). The turbidity might be another reason for the lower diversity (Goswami, Reference Goswami1982).
The maximum diversity was recorded during post monsoon seasons when salinity of the water is high. Rao (Reference Rao1977) reported similar findings in Indian estuaries, Goswami (Reference Goswami1982) from Mandovi–Zuari estuaries, Haridass et al. (Reference Haridass, Gopalamenon and Madhupratap1980) from the Indian Ocean and Madhupradap et al. (Reference Madhupratap, Achuthankutty, Sreekumaran Nair and Nair1981) from the Andaman Sea. The copepod diversity due to high salinity can also be explained by the species diversity and salinity in Station 3, where salinity and copepod diversity were higher than the salinity and copepod diversity of other stations. In the present study, the species diversity showed a significant relationship with species richness (P < 0.01 at Station1; P < 0.01 at Station 2; P < 0.01 at Station. 3 and P < 0.01 at Station 4). In the present study a reverse trend was observed in evenness values. The observed very low species evenness was obtained in April due to the unequal distribution of the species in these months, and high evenness values were obtained during the monsoon and post monsoon seasons at all the stations, which indicated that the species were relatively equally distributed and thus not allowing a single species to dominate over others. Kumar (Reference Kumar1991) made similar observations from Parangipettai coastal waters.
CONCLUSION
Monthly sampling of physico-chemical variables and copepods at four stations in the Coleroon estuary showed at least 104 species to be present, reflecting its high biodiversity and high fertility. The study demonstrated a clear annual cycle in species composition, driven largely by rainfall and associated salinity and nutrient variations. The disastrous tsunami of 26 December 2004 occurred between our December and January sampling trips. However, any effect the tsunami may have had on copepod species abundance or nutrient levels is masked by the annual variation (except perhaps for nitrite).
ACKNOWLEDGEMENTS
The authors are indebted to Dr Angus Atkinson and Dr P.J.O. Bryen for their comments and for editing an earlier version of the manuscript. We also thank two anonymous referees for their thorough improvements.
FINANCIAL SUPPORT
This work was supported by the Council of Scientific and Industrial Research, (Government of India) New Delhi, with the award of a Research Associateship. It was also supported by a Chinese Academy of Sciences Research Fellowship for International Young Researchers (M.R.), and a Knowledge Innovation Project of The Chinese Academy of Sciences award (KZCX2-YW-QN205 to M.R., hosted by J.S.), by the State Key Development Programme for Basic Research of China and National Natural Science Foundation of China (40776093 to J.S., 2009CB421202 to J.S.), and by a Chinese Academy Research Fellowship for Senior International Scientists (2009S1-36 to I.R.J., also hosted by J.S.).