


INTRODUCTION
Heterotrophic bacteria are a fundamental element in the ocean carbon cycling process (Cole et al., Reference Cole, Findlay and Pace1988). They contribute to nutrient and carbon cycling through the production of new bacterial biomass (secondary production) generally transferred to higher trophic levels through the microbial food web and the remineralization of organic carbon and nutrients (bacterial respiration) (del Giorgio & Cole, Reference del Giorgio and Cole1998). It is now established that 30–60% of phytoplankton production (i.e. the amount of inorganic carbon fixed by phytoplankton photosynthesis, corrected for phytoplankton respiration) is processed by bacteria in both marine and freshwater systems (Cole et al., Reference Cole, Findlay and Pace1988; Ducklow & Carlson, Reference Ducklow and Carlson1992). While planktonic heterotrophic bacteria are responsible for the bulk of microbial respiration (Williams, Reference Williams1981; Cole et al., Reference Cole, Findlay and Pace1988; del Giorgio & Duarte, Reference del Giorgio and Duarte2002), previous studies stressed the lack of any correlation between respiratory activity and quantitative descriptors of the marine bacterial community (Pomeroy et al., Reference Pomeroy, Sheldon and Sheldon1994; Briand et al., Reference Briand, Pringault, Jacquet and Torréton2004). An improved knowledge and understanding of factors controlling respiration in marine bacteria is then critically needed to further assess the fate of carbon within aquatic ecosystems.
Bacterial communities are intrinsically made of complex assemblages of numerous species having different metabolic rates (Servais et al., Reference Servais, Agogue, Courties, Joux and Lebaron2001). The relationship between respiration rates and abundances has nevertheless previously been investigated considering the heterotrophic bacteria community as a whole. Flow cytometry allows for the differentiation of sub-populations of bacteria via the light-scattering properties (related to size) and the DNA (deoxyribonucleic acid) content of individual cells (Li et al., Reference Li, Jellett and Dickie1995; Gasol & del Giorgio, Reference Gasol and del Giorgio2000; Lebaron et al., Reference Lebaron, Servais, Baudoux, Bourrain, Courties and Parthuisot2002; Servais et al., Reference Servais, Casamayor, Courties, Catala, Parthuisot and Lebaron2003). Generally, 2 main groups, represented by cells with high (HDNA) and low deoxyribonucleic acid content (LDNA), are observed in aquatic samples (Lebaron et al., Reference Lebaron, Servais, Baudoux, Bourrain, Courties and Parthuisot2002; Servais et al., Reference Servais, Casamayor, Courties, Catala, Parthuisot and Lebaron2003; Bouvier et al., Reference Bouvier, del Giorgio and Gasol2007). Variations in DNA content have been related to single cell activity with HDNA and LDNA cells constituting respectively the active cells and the dormant or dead cells (Li et al., Reference Li, Jellett and Dickie1995; Gasol & del Giorgio, Reference Gasol and del Giorgio2000; Lebaron et al., Reference Lebaron, Servais, Baudoux, Bourrain, Courties and Parthuisot2002; Servais et al., Reference Servais, Casamayor, Courties, Catala, Parthuisot and Lebaron2003). The percentage of HDNA bacteria has widely been considered as an accurate indication of the proportion of active cells within microbial communities (Jellett et al., Reference Jellett, Li, Dickie, Boraie and Kepkay1996; Gasol et al., Reference Gasol, Zweifel, Peters, Fuhrman and Hagstrom1999). However, recent studies do not support the simple dichotomy of HDNA as active and LDNA as inactive cells (Bouvier et al., Reference Bouvier, del Giorgio and Gasol2007) as there is now evidence that low DNA cells may also be active (e.g. Zubkov et al., Reference Zubkov, Fuchs, Burkill and Amann2001; Longnecker et al., Reference Longnecker, Sherr and Sherr2005). Although these two distinct fractions of bacterioplankton have been observed in a wide range of environments (e.g. Bouvier et al., Reference Bouvier, del Giorgio and Gasol2007), little is still known concerning their metabolic and ecological role in marine ecosystems.
Respiration rates in heterotrophic bacteria are most often estimated by measuring changes of dissolved oxygen concentration during in situ or laboratory incubations, typically over 24 hours or more (e.g. Pomeroy et al., Reference Pomeroy, Sheldon and Sheldon1994, Reference Pomeroy, Sheldon, Sheldon and Peters1995). Since it has been shown that changes of bacterial community composition (Massana et al., Reference Massana, Pedrós-Alió, Casamayor and Gasol2001; Gattuso et al., Reference Gattuso, Peduzzi, Pizay and Tonolla2002) and/or exhaustion of trophic resources (Pradeep Ram et al., Reference Pradeep Ram, Nair and Chandramohan2003) are likely to occur during these long-term incubations, reducing the incubation times has become an absolute prerequisite to prevent the acquisition of results that may not be representative of the natural bacterial community. However, short-term incubations require the use of highly sensitive methods to obtain reliable data, as the rate of respiration of the microbial community is often very low. Oxygen microprobes (i.e. Clark electrode) or a type of optical electrodes, the so-called opt(r)odes, are more sensitive than the conventional method of Winkler and constitute reliable techniques to estimate the consumption of dissolved oxygen during an incubation time less than 24 hours (Briand et al., Reference Briand, Pringault, Jacquet and Torréton2004; Warkentin et al., Reference Warkentin, Freese, Karsten and Schumman2007). In addition to allowing for reliable respiration rate measurements even at low consumption rates, optodes present many advantages compared to microprobes (Warkentin et al., Reference Warkentin, Freese, Karsten and Schumman2007): (i) they are used in non-invasive systems; (ii) no oxygen is consumed by the optode itself; and (iii) no mechanical stress, i.e. constant stirring of the samples, has to be imposed on bacteria. This technology has been recently used to estimate bacterial respiration in freshwater (Warkentin et al., Reference Warkentin, Freese, Karsten and Schumman2007). However, to our knowledge, this technique has until now, never been applied for the estimation of bacterial respiration in marine ecosystems.
In this context, we combined a short-term incubation procedure based on the use of optodes coupled to flow cytometric analyses (FCM) to investigate the potential relationships between respiration rates and the abundances of flow cytometrically-defined sub-populations of heterotrophic bacteria. These experiments were carried out in 5 distinct ecosystems representative of typical coastal environments, i.e. seagrass bed, mudflat, sandflat, rocky shore and sheltered marina. These environments are likely to present qualitatively and quantitatively different communities of heterotrophic bacteria. The objective of this research was to investigate how the respiration rates in marine bacteria were related to the cytometric structure of the bacterioplankton communities and to provide new insight into the metabolic and ecological role of the cytometrically defined sub-populations of bacteria in marine ecosystems.
MATERIALS AND METHODS
Study sites and sampling
Bacterial respiration was investigated at several coastal sites, scattered along the coasts of two contrasted inlets on the southern coast of Australia, the Spencer Gulf and the Gulf Saint Vincent (Figure 1), both microtidal systems (i.e. tidal range < 2 m). Spencer Gulf extends 300 km northward from the continental margin of southern Australia. The coastal geometry affords some shelter from predominantly south-west ocean-generated swell (Fuller et al., Reference Fuller, Bone, Gostin and Von der Borch1994; Harris, Reference Harris1994; Porter-Smith et al., Reference Porter-Smith, Harris, Andersen, Coleman, Greenslade and Jenkins2004). This coastal region receives negligible terrigenous inputs as a consequence of a semiarid climate (annual rainfall < 550 mm), low relief and small riverine discharge (Fuller et al., Reference Fuller, Bone, Gostin and Von der Borch1994; Schwarz, Reference Schwarz2003). In contrast, the shallow and sheltered Gulf Saint Vincent is impacted by stormwater discharges, particularly near metropolitan Adelaide (Edyvane, Reference Edyvane, Zann and Sutton1996, Reference Edyvane1999). The study sites (Figure 1; Table 1) have thus been chosen because they are representative of the typical coastal environments found along the Spencer Gulf (i.e. seagrass beds, mudflats, sandflats and rocky shores) and the Gulf Saint Vincent (i.e. sheltered marina).
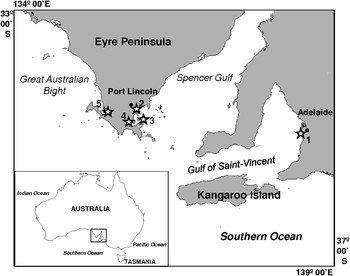
Fig. 1. Study area and location of the 5 sampling sites (⋆). (1) Sheltered marina (Adelaide area); (2) seagrass bed (Port Lincoln Jetty); (3) sandflat; (4) mudflat; (5) rocky shore (Port Lincoln area).
Table 1. Salinity (S), temperature (T; °C), ammonium (NH4+), nitrite+nitrate (NO3−+NO2−), phosphate (PO43−) concentrations (µM) and chlorophyll-a (Chl a) concentrations (µg l−1) measured at the 5 sampling sites (no replicates). DL, detection limit. Abundances of total bacteria (total), low DNA (LDNA) and high DNA (HDNA) bacteria, and percentage of HDNA bacteria (% HDNA) after flow cytometry analysis of samples from the 5 sampling sites (average±SD calculated on 3 samples). For the marina HDNA abundances represent the sum of HDNA1 and HDNA2.
* corresponding numbers on Figure 1.
Samples were collected between November and December 2006 (Table 1). At each site, temperature and salinity were recorded using a Hydrolab Data Sonde 3 (Hach®, USA). Water samples for environmental parameters (nutrients and chlorophyll-a), heterotrophic bacteria abundance and bacterial respiration were carefully collected from sub-surface (10 cm depth) in 50 cm of water, close to the shore line, using an acid-washed 1-l borosilicate bottle.
Environmental parameters
Dissolved inorganic nutrients concentrations were determined from 12 ml filtered (Whatman GF/C) water samples. Analyses were performed in the field using a portable LF 2400 photometer (Aquaspex®, Australia) according to standard colorimetric methods for NH4+ (indophenol blue), NO2− (naphtylethylene diamine), NO3− (naphtylethylene diamine after zinc reduction) and PO43− (ascorbic acid reduction). The limit of detection was 0.6 µM for ammonium, 0.2 µM for nitrite, 1.6 µM for nitrate and 1.1 µM for phosphate.
Samples (50 ml) for chlorophyll-a (Chl a) extraction were filtered through glass-fibre filters (Whatman GF/C) and immediately frozen (–20°C) until analysis. Chlorophyllous pigments were then extracted in 5 ml of methanol in the dark at 4°C during 24 hours (Herbland et al., Reference Herbland, Le Boutellier and Raimbault1985), and concentration of Chl a (µg l−1) was determined following Strickland & Parson (Reference Strickland and Parsons1972) using a Turner 450 fluorometer (Sparks®, USA) previously calibrated with a pure Chl a solution (Anacystis nidulans extract, Sigma Chemicals, St Louis).
Heterotrophic bacteria abundance
Heterotrophic bacteria were identified and enumerated using a FACScanto™ flow cytometer (Becton-Dickinson, USA). Samples (3 × 1 ml), fixed with 0.5% (final concentration) of glutaraldehyde in the dark at 0°C for 15 minutes, quick frozen in liquid nitrogen and then stored at –80°C. After being quick thawed, samples were diluted (1:10) in 0.2 µm filtered TE buffer (10 mM Tris, 1 mM EDTA, [pH 8]), stained with SYBR-I Green solution (1:5000 dilution) and incubated at 80°C in the dark for 10 minutes. Fluorescent beads of 1 µm diameter (Molecular Probes, Eugene, Oregon) were added to all samples, as size and concentration standards. Working beads concentrations were estimated after each session under epifluorescence microscopy, to ensure reliability of the beads concentration (Gasol & del Giorgio, Reference Gasol and del Giorgio2000) and all FCM parameters were normalized to bead concentration and fluorescence. For each sample, forward-angle light scatter (FSC), side-angle light scatter (SSC), green (SYBR-I) fluorescence, red (chlorophyll) fluorescence, and orange (phycoerythrin) fluorescence were acquired. Populations of heterotrophic bacteria were identified and quantified using the flow cytometry analysis software WinMDI 2.9 (©Joseph Trotter, USA). Discrete sub-populations of bacteria with high and low deoxyribonucleic acid content (HDNA and LDNA, respectively) were discriminated based on their differences in SYBR-I Green fluorescence and SSC, i.e. as non-overlapping classes of size and green fluorescence according to Lebaron et al. (Reference Lebaron, Servais, Baudoux, Bourrain, Courties and Parthuisot2002) and Servais et al. (Reference Servais, Casamayor, Courties, Catala, Parthuisot and Lebaron2003). These populations were identified as non-phototrophic bacterial populations as their size and nucleic acid content were consistent with bacterial-sized organisms, and because they lacked red or orange fluorescence (indicative of chlorophyll or photo-pigment content; Marie et al., Reference Marie, Partensky, Vaulot, Brussaard, Robingson, Darzynkiewicz, Dean, Orfao, Rabinovitch, Stewart, Tanke and Wheless1999).
Bacterial respiration
Bacterial respiration was estimated from the evolution of oxygen concentrations in biological oxygen demand (BOD) glass bottles. Oxygen concentration was measured using a fibre-optic oxygen sensor, FIBOX 3 (PreSens® GmbH, Germany), equipped with a temperature compensation system. Planar oxygen sensors (i.e. optodes), based on a polyester support and optically isolated, were glued at the bottom of each BOD bottle. This method is based on the quenching of luminescence caused by collision between molecular oxygen and luminescent dye molecules in the excited state; after excitation with a blue light (excitation wavelength: 505 nm) the oxygen sensor emitted a red luminescent light (Kautsky, Reference Kautsky1939), which was read out non-invasively through the transparent bottom of the bottle using an oxygen sensor probe. The life time of this red luminescence light depends on the ambient oxygen concentration.
Water samples were pre-screened through 250 µm mesh to remove mesozooplankton and subsequently gravity filtered through 0.6 µm pore size filters (Nucleopore), in order to remove most phytoplankton and protozoa (Williams, 1981; Briand et al., Reference Briand, Pringault, Jacquet and Torréton2004; Warkentin et al., Reference Warkentin, Freese, Karsten and Schumman2007). Samples were then carefully siphoned through a surgical-grade silicone tube in three overflowing 250 ml BOD dark bottles equipped with optodes. Sieving and filtration were performed with special care to avoid air bubbles. BOD bottles were then incubated in situ in sub-surface (10 cm depth). Incubations were carried out in the dark to avoid photosynthesis processes by potential remaining photoautotroph organisms. Oxygen concentration was measured every second in each BOD bottle during 1 minute and the concentration at a given incubation time was estimated by the mean value calculated from the resulting 60 measurements. Measurements were consistently performed 30 minutes after sampling and filtration, and every 30–60 minutes afterward over a 5 to 6 hours period.
Data analysis
The significance of the regression analyses was determined using Pearson's test calculated on 13 data points (3 bottles per site; 2 bottles were not considered because air bubbles were observed inside the bottles during the incubation). Multiple comparisons between sampling sites were conducted using the Kruskal–Wallis test (KW test), and a subsequent multiple comparison procedure based on the Tukey test was used to identify distinct groups of measurements (Zar, Reference Zar1996).
RESULTS
Environmental parameters
Temperature and salinity varied from 20.5 to 25.6°C and from 36 to 41 (Table 1). Sampling sites were characterized by relatively high (NH4+) concentrations with values ranging from 5.4 to 11.9 µM (Table 1). With 11.9 µM for ammonium, 4.7 µM for nitrate+nitrite and 3.2 µM for phosphate, the mudflat site exhibited substantially higher nutrient concentration than those observed in the 4 others sites (≤9 µM for NH4+; ≤1.6 µM for (NO3−+NO2−); ≤2.1 for PO43−). Chl a concentrations were low in the 5 sampling sites, with values typically smaller than 0.3 µg l−1 (Table 1).
Abundances of heterotrophic bacteria
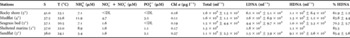
No significant differences were observed in the abundances of total heterotrophic bacteria between sampling sites (KW test, P > 0.05) with values ranging from 1.1 × 10⁶ to 1.6 × 10⁶ ml−1 at the sandflat and mudflat/rocky shore sites, respectively (Table 1). The bacterial communities were consistently characterized by a clear separation between HDNA and LDNA sub-populations (Figure 2). More specifically, the bacterial communities were characterized by one LDNA sub-population and one HDNA sub-population, except in the sheltered marina where 2 distinct HDNA sub-populations were identified (Figure 2). LDNA and HDNA abundances ranged from 1.5 × 10⁵ to 6.2 × 10⁵ ml−1 and from 9.1 × 10⁵ to 1.3 × 10⁶ ml−1, respectively (Table 1). At each sampling site the percentage of HDNA sub-populations was always greater than 50% and varied significantly between sampling locations (KW test, P < 0.05; Table 1). The fraction of HDNA cells was significantly higher at the sheltered marina, sandflat and mudflat sites with respectively 85.5, 85.4 and 83.8% of HDNA cells, than at the rocky shore site and over the seagrass bed where the percentage of HDNA cells remained below 71% (P < 0.05).
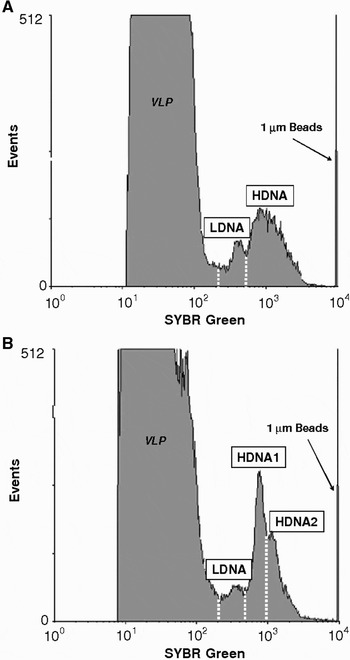
Fig. 2. Cytometric differentiation of heterotrophic bacterial populations in (A) the sandflat site (as a representative of all other sampling sites) and (B) in the sheltered marina. Histogram plots of green-fluorescence (SYBR Green) show peak related to LDNA (low DNA) observed in all sampling sites (A and B), and 1 (A) population or 2 (B) populations of increasing DNA content (HDNA1 and HDNA2). VLP, virus-like particles.
Respiration rates in heterotrophic bacteria
Two different trends of oxygen concentrations over time were identified (Figure 3), as previously observed and described in Briand et al. (Reference Briand, Pringault, Jacquet and Torréton2004). In two sites (marina and rocky shore), the slope was maximal at the beginning of the incubation and decreased thereafter (Figure 3A), whereas a decrease in oxygen concentration was only observed after a time lag of 150 to 250 minutes in the sandflat, mudflat and seagrass bed (Figure 3B). Consequently, an exponential decay was fitted to the part of the trend of oxygen concentration data versus time exhibiting the greatest slope (Figure 3) and respiration rates were then calculated from the first derivative of the fitted equation (Briand et al., Reference Briand, Pringault, Jacquet and Torréton2004).
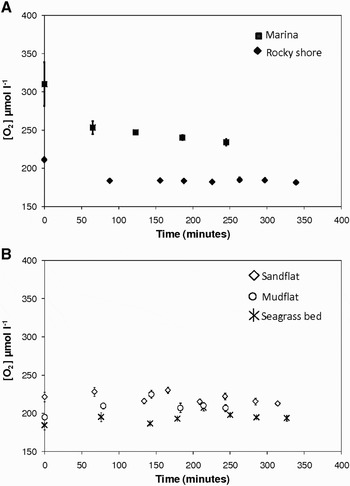
Fig. 3. Two different temporal trends of oxygen concentrations ([O2]; µmol l−1) observed during in situ incubations. (A) In the marina and the rocky shore sites, the slope was maximal at the beginning of the incubation and exponentially decreased thereafter. An exponential model was therefore fitted on the entire data set; (B) in the sandflat, mudflat and seagrass bed sites, oxygen decrease was only observed after a time lag, and the exponential decay was then fitted on the last part of the curve. The symbols are the mean values and the error bars are the standard errors calculated from the oxygen concentrations measured in the 3 BOD bottles for each incubation time.
Respiration rates exhibit significant variations between sampling sites (KW test, P < 0.05), with values ranging from 0.04 µmol O2 l−1 h−1 over the rocky shore, to 0.14 µmol O2 l−1 h−1 at the sheltered marina (Figure 4). The respiration rates obtained at the sheltered marina, at the mudflat and at the sandflat sites were significantly higher than those observed on the two other stations (P < 0.05). The respiration rates were not significantly correlated with total abundances of heterotrophic bacteria (N = 13; r = 0.33; P > 0.05) and HDNA abundances (N = 13; r = 0.37; P > 0.05). In contrast, the respiration rates were negatively correlated with LDNA abundances (N = 13; r = 0.70; P < 0.05) and positively correlated with % HDNA (N = 13; r = 0.72; P > 0.05; Figure 4). No significant correlations were observed between respiration rates and temperature and salinity (P > 0.05).
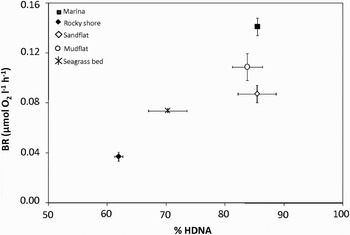
Fig. 4. Bacterial respiration rates (BR, µmol O2 l−1 h−1) shown as a function of the percentages of HDNA cells (% HDNA) at the 5 sampling sites; mudflat, rocky shore, sheltered marina and seagrass bed and sandflat.
DISCUSSION
Long-term bottle incubations (i.e. more than 24 hours) have been widely used to estimate bacterial respiration in planktonic systems. However this technique presents a number of disadvantages that are now well documented, including changes in bacterial physiology (Malone et al., Reference Malone, Ducklow, Peele and Pike1991), abundance and activity (del Giorgio & Cole, Reference del Giorgio and Cole1998), and community composition (Massana et al., Reference Massana, Pedrós-Alió, Casamayor and Gasol2001; Gattuso et al., Reference Gattuso, Peduzzi, Pizay and Tonolla2002). It therefore appears fundamental to reduce the incubation duration to minimize the so-called ‘bottle effect’ and the concomitant community changes (Pomeroy et al., Reference Pomeroy, Sheldon and Sheldon1994; Gattuso et al., Reference Gattuso, Peduzzi, Pizay and Tonolla2002; Briand et al., Reference Briand, Pringault, Jacquet and Torréton2004). Nevertheless, the choice of incubation time relies on the adequate compromise between the limitation of the ‘bottle effect’ and the minimum time required to detect significant changes in oxygen concentrations. In the present study, incubations (5 to 6 hours) provided estimate of respiration rates of heterotrophic bacteria under conditions that remained as close as possible to the original in situ conditions. However, while pre-filtration procedures have been widely used to assess respiration rates in heterotrophic bacteria (see Table 2), this procedure could have consequences on the respiration rates observed. More particularly some bacteria attached to particles could have been retained on the filter, resulting in an under-estimation of the respiration rates observed in this study. However, given the lack of any procedure for blocking the metabolism of different sectors of the plankton with selective inhibitor size-fraction filtration procedure is a reliable technique to assess respiration rates in heterotrophic bacteria (e.g. Robinson & Williams, Reference Robinson, Williams, del Giorgio and Williams2005).
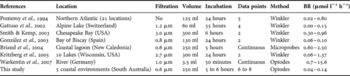
Table 2. Literature review of (i) methods applied, i.e. filtration mesh size (µm), incubation time (incubation), volume, data points and method used to estimate oxygen consumption and (ii) respiration rates (BR; µmol l−1 h−1) estimated in different natural environments and in this study.
Respiration rates in heterotrophic bacteria have mainly been estimated from the difference between initial and final oxygen concentrations, assuming a linear decrease of oxygen during incubation. Previous studies have nevertheless shown that decreases in oxygen concentration were not always linear during long-term (Biddanda et al., Reference Biddanda, Opsahl and Benner1994; Pomeroy et al., Reference Pomeroy, Sheldon and Sheldon1994) and short-term incubations (Briand et al., Reference Briand, Pringault, Jacquet and Torréton2004). In this study, two different trends of oxygen concentrations over time were identified (Figure 3). In two sites (marina and rocky shore), the slope was maximal at the beginning of the incubation and decreased thereafter (Figure 3A). This kinetic has been previously observed in rather eutrophic sites and could be explained by the exhaustion of trophic resources and subsequent decrease in bacterial activity (Briand et al., Reference Briand, Pringault, Jacquet and Torréton2004). In contrast, the existence of a time lag before the observation of a significant decrease in oxygen, as observed in the sandflat, mudflat and seagrass bed (Figure 3B), was assigned to more oligotrophic sites where low net bacteria production was recorded (Briand et al., Reference Briand, Pringault, Jacquet and Torréton2004). Even if in their study, Briand et al. (Reference Briand, Pringault, Jacquet and Torréton2004) were able to assign the different model to water of different trophic status, they have also underlined the difficulty to assign one model to any characteristic site. Future works are thus needed to link the different trend of oxygen consumption in heterotrophic bacteria to different trophic status.
The diversity of approaches (i.e. filtration, incubation time, number of data points and oxygen measurement techniques) used to estimate respiration rates in heterotrophic bacteria, through oxygen consumption, makes it difficult to compare the values observed in different ecosystems (Table 2). However, the respiration rates observed in the five coastal environments considered here are in the range of values reported previously for continental and oceanic waters (Table 2) and were significantly different between environments (Figure 4).
Bacterioplankton abundance and respiration rates
Sampling and incubations were conducted under different conditions of temperature, ranging from 20.5 to 25.6°C. Temperature is known to profoundly and directly influence heterotrophic processes and metabolic activities in planktonic communities (Fenchel, Reference Fenchel, del Giorgio and le B Williams2005). However, we did not observe any correlation between temperature and respiration rates (P > 0.05), suggesting that temperature was not the main factor driving the spatial heterogeneity of respiration rates between our distinct sampling environments.
In a broad range of aquatic systems, bacterial production and respiration and bacterioplankton abundances have been shown to covary over a large range of temporal and spatial scales within a given system (Tuttle et al., Reference Tuttle, Jonas, Malone, Majumdar, Hall and Austin1987; del Giorgio et al., Reference del Giorgio, Cole and Cimbleris1997; Bouvier et al., Reference Bouvier, del Giorgio and Gasol2007). However, in our study respiration rates strongly fluctuated between sites (Figure 4) despite similar heterotrophic bacteria abundances and no significant correlation was observed between total bacterial abundances and respiration rates. Total bacteria abundances ranged from 1.1 × 10⁶ to 1.6 × 10⁶ ml−1 between sampling sites. These values are within the range of those previously described for eutrophic systems (i.e. 1 to 10 × 106 ml−1; Cotner & Biddanda, Reference Cotner and Biddanda2002). This lack of significant correlation between total bacteria abundances and respiration rates could be related to the small differences in total bacterial counts observed between the different marine ecosystems investigated here. This could have masked the relationships between abundance and respiration rates.
While bacterioplankton abundance did not strongly vary, the structure of the community expressed by the percentage of HDNA cells was significantly different between sampling sites (Table 1). These values ranging between 61% and 85% are within the range of values observed in highly productive coastal marshes (Bouvier et al., Reference Bouvier, del Giorgio and Gasol2007). This variability was primarily driven by the variability in LDNA cells abundances. Such shifts in bacterioplankton communities are mainly influenced by variability in nutrients and DOC (e.g. del Giorgio et al., Reference del Giorgio, Cole and Cimbleris1997). In particular phosphate limitation of heterotrophic bacteria activity has been reported in coastal environments (e.g. Servais et al., Reference Servais, Casamayor, Courties, Catala, Parthuisot and Lebaron2003). The two sampling sites exhibiting the lowest percentage of active cells (rocky shore and seagrass bed) were characterized by low phosphate concentrations (Table 1). Assuming that LDNA bacteria are inactive or starved (Lebaron et al., Reference Lebaron, Servais, Baudoux, Bourrain, Courties and Parthuisot2002), then nutrient availability, and more particularly phosphate, could be a factor responsible for the variability in the LDNA sub-populations between sampling sites. However, results obtained across a wide range of aquatic ecosystems, have recently shown that the relative abundance of HDNA and LDNA cells within bacterioplankton communities was not only related to the overall system productivity and that other factors could influence the proportion of HDNA cells within bacterioplankton communities (Bouvier et al., Reference Bouvier, del Giorgio and Gasol2007). A variety of bottom up and top down control factors not investigated here could have triggered the differences observed between our five sampling sites, e.g. variability in DOC concentration and composition (e.g. del Giorgio et al., Reference del Giorgio, Cole and Cimbleris1997), grazing by protozoans and viral infection (Fuhrman, Reference Fuhrman1999; Gasol et al., Reference Gasol, Zweifel, Peters, Fuhrman and Hagstrom1999; Pedrós-Alió et al., Reference Pedrós-Alió, Calderón and Gasol2000; Bouvier et al., Reference Bouvier, del Giorgio and Gasol2007).
Relative abundance of HDNA cells and respiration rates
Our results highlighted a significant increase in respiration rates with the percentage of HDNA cells observed within the bacterioplankton communities (Figure 4). The cluster of bacterioplankton communities into HDNA and LDNA sub-populations has been observed over a wide range of aquatic ecosystems and appears to be a general character of bacterioplankton communities (e.g. Gasol & del Giorgio, Reference Gasol and del Giorgio2000; Bouvier et al., Reference Bouvier, del Giorgio and Gasol2007). Differences in metabolic activity between these two sub-populations have been suggested from field and laboratory work, with the HDNA cells representing the more active cells and LDNA corresponding with less active or dormant (Gasol et al., Reference Gasol, Zweifel, Peters, Fuhrman and Hagstrom1999; Lebaron et al., Reference Lebaron, Servais, Baudoux, Bourrain, Courties and Parthuisot2002). The positive correlation between respiration rates and the fraction of HDNA cells within the bacterioplankton community, tend to confirm this hypothesis. In addition, while the sheltered marina and the mudflat exhibited similar percentages of HDNA cells (respectively 85.5% and 83.8%; Table 1), respiration rates were significantly higher in the marina. This result suggests that the second HDNA population observed at the marina, exhibiting higher DNA content (Figure 2), may have higher metabolic rates that lead to the measurements of higher respiration rates. However, there is now evidence that low DNA cells may also be active (e.g. Zubkov et al., Reference Zubkov, Fuchs, Burkill and Amann2001; Longnecker et al., Reference Longnecker, Sherr and Sherr2005). In addition there are conflicting results concerning the phylogenetic composition of these different fractions. Whilst some studies conclude that these fractions are phylogenetically different (e.g. Longnecker et al., Reference Longnecker, Sherr and Sherr2005), others suggest that the composition varies between different fractions (e.g. Zubkov et al., Reference Zubkov, Fuchs, Burkill and Amann2001). Considering that HDNA and LDNA cells may correspond to two distinct and independent communities, as recent studies have shown a significant degree of phylogenetic dissimilarity between the groups (Zubkov et al., Reference Zubkov, Fuchs, Burkill and Amann2001; Mary et al., Reference Mary, Heywood, Fuchs, Amann, Tarran, Burkill and Zubkov2006), it is also realistic that different phylogenetic groups could exhibit divergent respiration rates. Recent evidence does not support the simple dichotomous view of HDNA ‘active’ and LDNA ‘inactive’ cells or the more extreme hypothesis of two distinct and independent communities, but rather suggests an intermediate scenario in which there are components intrinsic to both fractions, but also other components that switch between active and inactive (Bouvier et al., Reference Bouvier, del Giorgio and Gasol2007).
The composition of bacterial communities was only defined here through their flow cytometric signature. Whilst our results suggest that the relative abundances of HDNA cells within the bacterioplankton, as well as the heterogeneity of HDNA sub-populations, should be taken into account when assessing the relation between bacterial community composition and its respiratory losses, future work is needed to conclude on the physiological and metabolic properties of the different bacterial sub-populations identified through flow cytometry.
Concluding remarks
Our study shows a strong connection between the fraction of HDNA cells within bacterioplankton communities and respiration rates. More specifically, our results stress the need to relate bacterial respiration rates to the relative abundance of the different sub-populations found in bacterial assemblages. Assuming that only a fraction of bacterial cells contribute to bacterial respiration, the relative composition of bacterioplankton communities may have critical implications for calculations of bulk bacterial respiration and the related biogeochemical fluxes. However, the ecological role of the different cytometrically defined sub-populations within bacteria communities remained enigmatic and future work is needed to fully assess their role on biogeochemical processes.
ACKNOWLEDGEMENTS
The authors gratefully acknowledge Dr T. Bolton (Lincoln Marine Science Centre, Port Lincoln, South Australia) who provided laboratory facilities and part of the equipment necessary for conducting the experiments in Eyre Peninsula. We thank Dr S. Bailey from the Flow Cytometry Unit of the Flinders Medical Centre, for providing technical support during the flow cytometry work. Funding was provided by the Australian Research Council and Flinders University.


