INTRODUCTION
Species introduction in coastal ecosystems is a major concern in marine ecology (Boudouresque & Verlaque, Reference Boudouresque and Verlaque2002; Grosholz, Reference Grosholz2002). Among the introduced species that succeed in colonizing marine areas, the term ‘invasive species’ corresponds to the introduced species that have an impact on the ecosystems. Following Simberloff (Reference Simberloff2011) the term ‘ecosystem impact’ has often been limited to refer to alterations to trophic pathways or nutrient cycling processes, but many impacts, such as habitat modification and communities modification, have not always been adequately considered as ‘ecosystem impact’ (Moulin et al., Reference Moulin, Guizen, Thouzeau, Chapalain, Mülleners and Bourg2007; Simberloff, Reference Simberloff2011). Besides, the debate is ongoing among scientists whether the presence of non-indigenous species represents a threat to ecosystems (Molnar et al., Reference Molnar, Gamboa, Revenga and Spalding2008), or whether there exist trade-offs between positive effects of new resources and potential damage to native species and communities (Chauvaud et al., Reference Chauvaud, Jean, Ragueneau and Thouzeau2000; Ragueneau et al., Reference Ragueneau, Chauvaud, Leynaert, Thouzeau, Paulet, Bonnet, Lorrain, Grall, Corvaisier, Le Hir, Jean and Clavier2002; Gurewitch & Padilla, Reference Gurewitch and Padilla2004; Thieltges et al., Reference Thieltges, Strasser and Reise2006). In all cases, the arrival and naturalization of an exotic species causes changes in the native community structure and diversity. The minimal impact is a ‘+1 species’ addition to the species list. When the exotic species is an ecosystem engineer (Jones et al., Reference Jones, Lawton and Shachak1994), cascade effects on the whole ecosystem are expected (Sousa et al., Reference Sousa, Gutiérrez and Aldridge2009). An invasive species may also colonize an undisturbed community and be recognized as one of the major threats to marine biodiversity (Molnar et al., Reference Molnar, Gamboa, Revenga and Spalding2008), or colonize habitats that were previously perturbed by other means which made them suitable for invasion (Gurewitch & Padilla, Reference Gurewitch and Padilla2004).
The disagreement among studies in ecology and their conclusions in terms of the role of drivers is often related to differences in spatial scaling (Wiens, Reference Wiens1989), i.e. community structure is driven by different factors when analysed at small or large scales. Thus, we can argue that the impact of exotic species on native communities will depend on observation scale. For instance, diversity encompasses three components, namely α, β and γ which describe different scales and patterns of diversity (Magurran, Reference Magurran2004). Alpha-diversity is the diversity at the scale of one sample (point diversity) or of a collection of samples from one habitat (Gray, Reference Gray2000). Gamma-diversity is the total number of species in a larger area which includes several habitats (e.g. a whole estuary, a coastal lagoon) (Ellingsen, Reference Ellingsen2001; Magurran, Reference Magurran2004). Beta-diversity encompasses the variation in the identities of species among samples, habitats, regions or among samples in time, the latter being designed as ‘turn-over’ diversity (Whittaker, Reference Whittaker1972). These different aspects of diversity, especially β–diversity, must be considered when assessing the impact of invasive species on biodiversity. Homogenization of biological communities (i.e. global decrease of β-diversity) is increasing worldwide as a response to species extirpation and introduction of species (Rahel, Reference Rahel2010). There is, however, a very limited number of studies that take into account these different aspects of biodiversity; most studies still focus on alpha-diversity, especially in the marine environment (see however, Chauvaud, Reference Chauvaud1998; Guérin, Reference Guérin2004).
Aquatic molluscs rank among the main categories of invasive species due to (1) their ability to disperse (planktonic larvae), (2) the fact that many of them are exploited and traded, and (3), for some species, their tolerance to stressors such as pollutants, predators or diseases (Carlton, Reference Carlton1999; Gofas & Zenetos, Reference Gofas and Zenetos2003; Sousa et al., Reference Sousa, Gutiérrez and Aldridge2009; Nunes et al., Reference Nunes, Katsanevakis, Zenetos and Cardoso2014). Besides, most mollusc species are conspicuous which makes them easier to detect (and report) in cases of introduction. The slipper limpet Crepidula fornicata (L.) is one of the most invasive molluscs of Atlantic European coasts (Stiger-Pouvreau & Thouzeau, Reference Stiger-Pouvreau and Thouzeau2015). It was unintentionally introduced in the UK from the American east coast in the 19th century and it progressively colonized (semi-)sheltered bays, estuaries and lagoons where there were shellfish farming activities (Blanchard, Reference Blanchard1997). It is now distributed from Norway to Spain, but the French coast is one of the most impacted (Blanchard, Reference Blanchard1997; Thieltges et al., Reference Thieltges, Strasser and Reise2003). Since its colonization in Europe, the population dynamics of C. fornicata have been highly variable among sites, e.g. the living stock was multiplied by 7.5 in Bay of Mont Saint-Michel in 24 years (Blanchard, Reference Blanchard2009) while it remained quite stable in the Sylt-Rømø basin during 70 years (Thieltges et al., Reference Thieltges, Strasser and Reise2003). In the southern range of its exotic distribution area, in Arcachon Bay (South-western Atlantic coast of France), the C. fornicata stock was estimated in 1999 at 155 t fresh weight (95% confidence limit: 72 t) (de Montaudouin et al., Reference de Montaudouin, Labarraque, Giraud and Bachelet2001). The population was scattered over only 5% of the potential (subtidal) settling habitat. Thus, the living stock in Arcachon Bay remains very low compared with other sites such as Bay of Brest (85,000 t dry weight, i.e. ~2.6 × 10⁶ t fresh weight) (Guérin, Reference Guérin2004) or in Bay of Mont Saint-Michel (150,000 t fresh weight) (Blanchard, Reference Blanchard2009).
The main objective of the present study was to provide new insights on the effect of C. fornicata presence on the benthic fauna, by evaluating its relationship with the structure of the benthic megafauna (here, epifauna and infauna of the ~5 first cm of sediment sampled by the dredge with a 1 cm mesh net) and the different components of its diversity. Previous studies have been performed either in in situ cages with controlled abundance of C. fornicata (de Montaudouin et al., Reference de Montaudouin, Audemard and Labourg1999) or were based on sample comparison between soft-bottom habitats with and without C. fornicata (de Montaudouin & Sauriau, Reference de Montaudouin and Sauriau1999). Results were similar and highlighted higher numbers of macrozoobenthos species (sieved through a 1 mm mesh) in the presence of C. fornicata. As in many case studies reported in the literature, these authors worked at the α-diversity scale (i.e. sample unit or cage scale) and mainly focused on small infaunal organisms. We instead focus on benthic megafauna (collected in a dredge with a 1 cm mesh net) which includes both epi- and infauna which were not well sampled by previous studies, and we analyse these data considering the different components of diversity. The main questions were: (1) What is the composition of the subtidal megafauna in Arcachon Bay? (2) How does C. fornicata modify the composition of the benthic megafauna in a sub-invasion situation (i.e. in the context of a low living stock)? (3) Does the presence of C. fornicata at relatively low density affect diversity of the benthic megafauna considering the α, β and γ components of diversity? In addition, this study was designed to evaluate possible spread of this species 12 years after our first estimation through the update of C. fornicata stock, using the same sampling strategy (de Montaudouin et al., Reference de Montaudouin, Labarraque, Giraud and Bachelet2001).
MATERIALS AND METHODS
Study area
Arcachon Bay (44°40′N 01°10′W) is a 180 km2 semi-enclosed coastal lagoon on the south-west coast of France (Figure 1). Sixty-four per cent of the area (115 km2) is composed of intertidal flats that are mainly covered by Zostera noltei Hornemann seagrass. This seagrass bed is the largest in Europe (Auby, Reference Auby1991), although a severe decline has recently been observed (Plus et al., Reference Plus, Dalloyau, Trut, Auby, de Montaudouin, Emery, Claire and Viala2010). The subtidal area comprises 65 km2 of tidal channels, 68% (44 km2) of which are located in the inner part of the lagoon. The maximum water depth in these inner channels is 20 m at low tide, but most channels are 5–10 m deep. Based on former studies (Bouchet, Reference Bouchet1995; Auby & Labourg, Reference Auby and Labourg1996; de Montaudouin et al., Reference de Montaudouin, Labarraque, Giraud and Bachelet2001), Blanchet et al. (Reference Blanchet, de Montaudouin, Chardy and Bachelet2005) defined 15 subtidal strata based on sedimentary and biogenic structures (oyster reefs, seagrass beds, etc.), reduced to nine main biotopes based on macrozoobenthic assemblages. Muddy sediments represent less than 7% of the channels' surface area and are mainly located on the edges of the most sheltered channels. These edges can be colonized by Z. marina (L.) or covered by empty oyster shells as a result of the close proximity to oyster parks. Based on a comparison with previous work conducted in 1988 by Bachelet et al. (Reference Bachelet, de Montaudouin and Dauvin1996), the study of Blanchet et al. (Reference Blanchet, de Montaudouin, Chardy and Bachelet2005) on macrobenthos in 2002 suggested a general increase of silt and clay content in the sediment, inducing modifications of benthic assemblages at a 14-year scale.

Fig. 1. Sampling sites in Arcachon Bay in 1999 (modified from de Montaudouin et al., Reference de Montaudouin, Labarraque, Giraud and Bachelet2001) and in 2011 (present study) with biomass of Crepidula fornicata in fresh weight (gFW m−2). ‘Stations sampled for megafauna only (2011)’ were free of C. fornicata.
Arcachon Bay is connected to the Atlantic Ocean by two narrow channels with water exchanges between 130 × 106 and 370 × 106 m3 at each tide. The tidal range fluctuates between 1.1 and 4.9 m (Gassiat, Reference Gassiat1989). Freshwater inputs, mainly from the Eyre River in the south-east, have been estimated at 2.5–3.7 × 10⁶ m3 day−1 (Auby, Reference Auby1991).
Sampling
The sampling campaign took place during January and February 2011 (against February–March in 1999). Sampling was conducted following the sampling strategy of de Montaudouin et al. (Reference de Montaudouin, Labarraque, Giraud and Bachelet2001), who assessed the stock of C. fornicata in Arcachon Bay, in 1999. A systematic sampling strategy was applied within the area ranging from 0 (level of lower astronomical tide) to 2 m depth. Crepidula fornicata is absent from both intertidal flats (Bachelet & Dauvin, Reference Bachelet and Dauvin1993; Blanchet et al., Reference Blanchet, de Montaudouin, Lucas and Chardy2004; Do et al., Reference Do, Blanchet, de Montaudouin and Lavesque2013) and deeper areas (Blanchet et al., Reference Blanchet, de Montaudouin, Chardy and Bachelet2005). More recent reports confirmed this extreme scarcity of C. fornicata in deeper areas (de Montaudouin et al., Reference de Montaudouin, Vébret and Lavesque2011, Reference de Montaudouin, Occelli, Gouillieux and Lavesque2012; de Montaudouin & Gouillieux, Reference de Montaudouin and Gouillieux2012). These reports covered ~30 km2 of deeper channels with only four out of 33 dredged stations with C. fornicata, and a biomass of less than 0.5 g fresh weight m−2 in these four stations. Thus, these subtidal areas were considered as not significant in terms of C. fornicata occurrence and supported our decision to discard them in the present survey. A total of 221 stations were sampled between 13 January and 2 March 2011 to investigate the benthic megafauna community: 202 stations located in the inner part of the lagoon (the same as in 1999 for C. fornicata stock assessment), plus 19 stations in the outer channels of Arcachon Bay which were not sampled in 1999. Sampling was performed using a dredge similar to the Charcot model (Collignon, Reference Collignon1991) with a 90 cm width opening and a 1 cm mesh net. The size of the sample (~9 m2), controlled by GPS was a compromise between the patchy distribution of C. fornicata and the necessity for the dredge not to brim over. GPS accuracy (Garmin GPS 60) was controlled prior to sampling: at a velocity of 1 km s−1, with a minimum of seven detected satellites, mean value recorded by the GPS along an exact distance of 9 was 9.2 m (standard deviation = 0.4 m, N = 10 trials). Each sampling unit consisted of two cumulated replicates (total 18 m2). Individuals were identified at the species level when possible and weighed (ash-free dry weight) per species.
Benthic megafauna structure
EFFECT OF C. FORNICATA ON THE STRUCTURE AND COMPOSITION OF BENTHIC MEGAFAUNA
A community analysis was carried out to evaluate the effect of C. fornicata presence on the structure of associated megafauna. The loge(x + 1)-transformed biomass (gAFDW) of each species per station was considered the independent factor. A Bray–Curtis similarity matrix was then computed. Stations were classified into groups by cluster analysis using the group average method. Homogeneity of station groups obtained by this method was assessed by SIMPROF test. An ordination of stations was obtained using principal coordinates analysis based on the Bray–Curtis similarity matrix (Anderson et al., Reference Anderson, Gorley and Clarke2008). Data were analysed using PRIMER (Clarke & Gorley, Reference Clarke and Gorley2006).
RELATIONS BETWEEN C. FORNICATA AND BENTHIC MEGAFAUNA DIVERSITY
The diversity of benthic megafauna in stations with C. fornicata was compared with those without C. fornicata at the scale of the sampling station (α-diversity) and at the scale of the whole lagoon (γ-diversity, γ). Whittaker's β-diversity (βw) was deduced from α- and γ-diversity (Whittaker, Reference Whittaker1972).
 $${\rm \beta} _{\rm w} = {\rm \gamma} / \bar {\rm \alpha} $$
where ( $\bar{\rm \alpha} $): mean number of species per station, hereafter referred as species density (Gotelli & Colwell, Reference Gotelli and Colwell2001).
These diversity indices were calculated separately for sampled stations with C. fornicata vs without C. fornicata. Differences in βw were assessed by non-parametric Mann–Whitney U-test.
In addition, multivariate dispersion was used as an additional measure of β-diversity (Anderson et al., Reference Anderson, Crist, Chase, Vellend, Inouye, Freestone, Sanders, Cornell, Comita, Davies, Harrison, Fraft, Stegen and Swenson2011). Because different multivariate indices highlight different aspects of the variability in benthic community diversity, four different indices were used in this study. The Jaccard index measures the proportion of species that are shared by two samples, but it is based on presence/absence of species only, and does not account for joint absence. The simple-matching index is similar to the Jaccard index except that it takes into account joint-absence as a criterion of similarity among samples. The Chi-squared distance emphasizes the rare species (Anderson et al., Reference Anderson, Crist, Chase, Vellend, Inouye, Freestone, Sanders, Cornell, Comita, Davies, Harrison, Fraft, Stegen and Swenson2011). Finally, the Bray–Curtis similarity index provides a measure of the similarity among samples based on species-identity and takes into account variations of abundance (or biomass, in our case) among species. For the latter four multivariate indices, the measure of β-diversity was obtained by computing the distance of each individual station to the centroid of their group (differentiating two groups, with C. fornicata vs without C. fornicata). These distances are measures of the dispersion of stations compared with their centroid within the multivariate dimensions. They were compared between groups of stations where C. fornicata was present and where this species was absent using a permutational test of homogeneity of dispersions (PERMDISP; Anderson et al., Reference Anderson, Gorley and Clarke2008). In addition, non-parametric correlations between these diversity indices and biomass of C. fornicata (when present) (as loge(x + 1)) were assessed by calculating Spearman rank-correlation coefficient. Finally, difference of diversity between stations where C. fornicata was present and stations where it was absent was visualized as a species accumulation curve obtained by permutation of stations (N = 999).
Crepidula fornicata stock assessment
To compare the state of C. fornicata populations between 1999 and 2011 (this study), stock assessments were carried out on the basis of the 202 stations located in the inner part of the lagoon (as in 1999) (see section on ‘Sampling’ for sampling strategy). Those stations correspond to a 6 km2 stratum where C. fornicata is potentially present.
At each station, C. fornicata individuals were counted and the straight length of the shell was measured with a calliper to the nearest millimetre. Individual biomass was calculated from shell length using the following formula (de Montaudouin & Sauriau, Reference de Montaudouin and Sauriau1999):
 $${\rm lo}{\rm g}_{{\rm 1}0}\,{\rm DW = 2}.{\rm 15}\,{\rm lo}{\rm g}_{{\rm 1}0}\,L - {\rm 4}.{\rm 17}$$
 $${\rm lo}{\rm g}_{{\rm 1}0}\,{\rm FW = 3}0.{\rm 74}\,{\rm lo}{\rm g}_{{\rm 1}0}\,{\rm DW} - 0.0{\rm 4}$$
where DW = dry weight (g), FW = fresh weight (g), including the shell, L = length in mm.
Stock biomass (B) was calculated using Cochran (Reference Cochran1977):
 $$B = N\displaystyle{{\sum {B_i}} \over n}$$
where B = Total biomass (g), N = Number of 18 m2-plots in the whole stratum (stratum surface/sample unit, i.e. 6 km2/18 m2), B i = C. fornicata biomass in sample i (g), n = number of sample units (202 samples).
The 95% confidence limit is:
 $$B \pm t\displaystyle{s \over {\sqrt n}} \sqrt {1 - f} $$
where s = standard deviation, f = fraction unit (n/N), t = Student parameter (1.96 when n tends toward ∞).
Differences in C. fornicata stock and straight shell length between 1999 and 2011 evaluations were tested using Student's t-test. Difference of percentage of area colonized by C. fornicata, between 1999 and 2011, was tested using a chi-square test.
RESULTS
Structure and composition of benthic megafauna in Arcachon Bay and relation with C. fornicata presence
A total of 99 taxa (excluding C. fornicata) was retrieved from the subtidal bottom samples investigated. Among these taxa, the gastropod Nassarius reticulatus and the crustaceans Crangon crangon and Carcinus maenas were the most common species (i.e. present at more than half of the stations). The ascidian Ascidiella aspersa and the crustaceans Clibanarius erythropus and Liocarcinus arcuatus were present in more than one third of the stations (Appendix 1). Crepidula fornicata was identified in 128 out of 221 stations. In addition, seven stations contained no megafauna and at one station only C. fornicata was present. These stations were discarded for SIMPROF analysis.
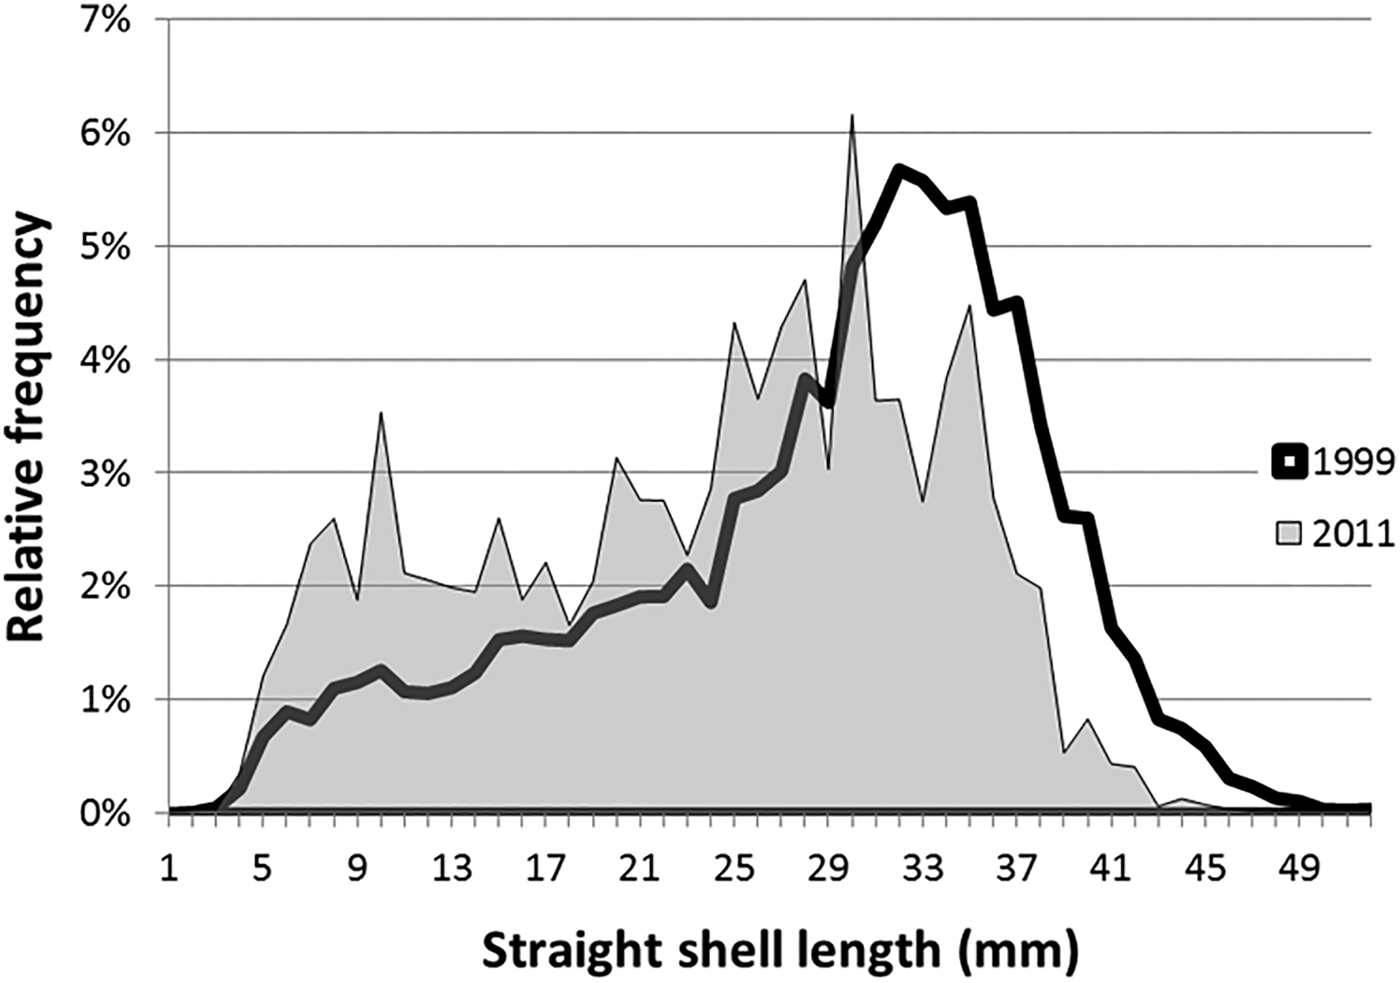
According to cluster analysis and SIMPROF procedure, 13 groups of stations could be identified, of which five comprised more than 10 stations, namely station groups A, M, I, L and K. Among these main groups, the first main separation isolated station group A from all other groups (Figure 2). This group A comprised 16 stations located along the main channel connecting the bay to the ocean where highest current velocities occur (Figure 1). Here, the benthic fauna was very different from all other stations and was mainly characterized by the bivalve Mactra glauca and the decapod Atelecyclus undecimdentatus. The mean total biomass was very low (<1 gAFDW per sample) (Figure 3). The second main separation isolated station group M (Figure 2). This group of 42 stations was mainly characterized by C. crangon, N. reticulatus and C. maenas but the mean total biomass was low compared with the other station groups (<5 gAFDW per sample, on average) (Table 1, Figure 3). The third main separation isolated station groups G, H, I and J from station groups K and L. This was observed on PCO axis 3 (not shown). The former group was characterized by the presence of the mussel Mytilus edulis with different levels of abundance according to station groups. Station group I (24 stations) was characterized by very high biomass of M. edulis and high biomass of N. reticulatus and C. maenas (Table 1). The mean total biomass was very high (>150 gAFDW, on average) mainly due to M. edulis which accounted for more than 80% of the total biomass (Table 1, Figure 3). Smaller station groups differed from the latter group mainly according to lower M. edulis biomass levels and difference in the occurrence and biomass levels of several taxa such as the starfish Asterias rubens (group J) or the Demospongia Cliona celata (group H) (Table 1). In all these smaller groups, the mean total biomass was medium (>5 gAFDW per sample; group G) to high or very high (>50 gAFDW per sample) but dominated by different species (e.g. C. celata in group H) (Table 1, Figure 3). Station groups J and K were both characterized by the high biomass and occurrence of the seasquirt Ascidiella aspersa together with species that were also common in most assemblages such as C. maenas, C. crangon and N. reticulatus (Table 1). Both station groups displayed high mean level of biomass (Figure 3). Station group K differed from station group L by displaying higher levels of biomass for most species except N. reticulatus, C. maenas and C. crangon that were more abundant in group L (Table 1). Other small station groups corresponded to Z. marina eelgrass bed (group C, 1 station), bottoms with varying levels of biomass of oysters Crassostrea gigas (groups F and E), with high biomass of porifera species C. celata and D. fragilis (group E) or bottoms without sessile epifauna (group D) (Table 1).
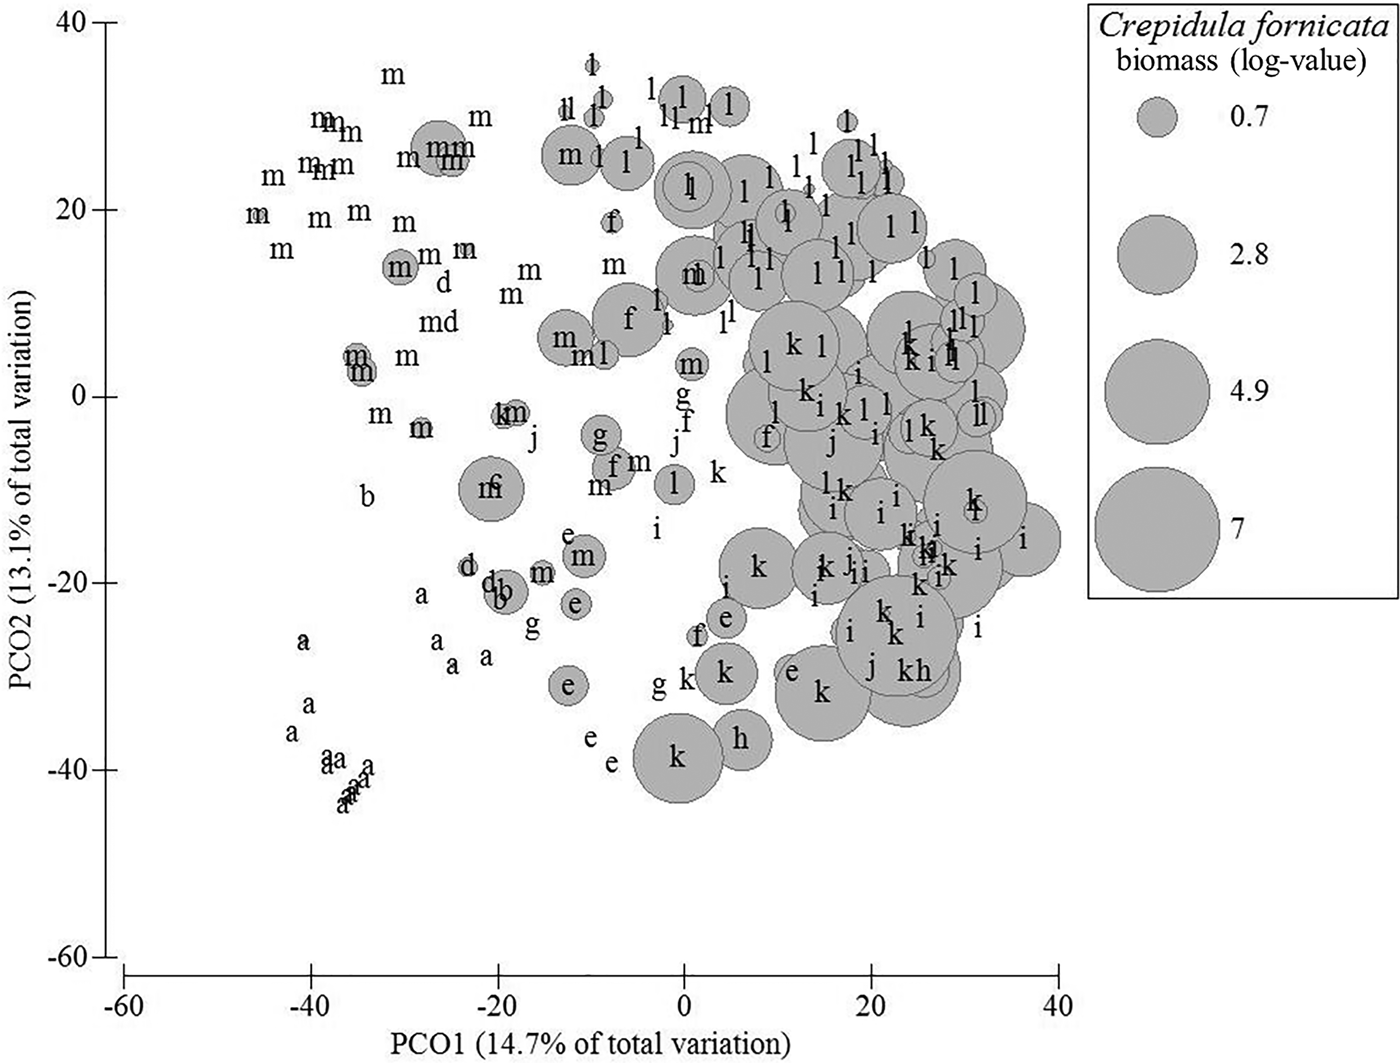
Fig. 2. Ordination of stations showing the groups of stations corresponding to the different assemblages of fauna (letters correspond to the different assemblages put in evidence by the SIMPROF procedure). The size of circles is proportional to the biomass of slipper limpet (in gFW m−2, with log-transformation). The principal coordinates ordination (PCO) is based on Bray–Curtis similarity. Only the first two axes are represented.

Fig. 3. Mean total biomass of the megafauna (g AFDW per station 18 m2) + standard error (SE) without Crepidula fornicata (in white) and mean biomass of C. fornicata (in black).
Table 1. Average biomass (g AFDW per station, left value) and level of occurrence (proportion of station where the species was present) of the main species contributing to within-group similarity as identified by the SIMPER analysis.

Level of occurrence of each species in each station group is indicated by ccc, 75% of stations or more; cc, comprised between 50 and 75% of stations; c, comprised between 25 and 50% of stations; – : indicates that the species was present in fewer than 25% of stations. Average biomass is only given where species at least occurred in 25% of stations or more. Main species characterizing each group are underlined. The number of stations of each group is indicated in parentheses. The average biomass of Crepidula fornicata and its level of occurrence are also given.
The distribution of C. fornicata was not random among station groups (Kruskal–Wallis non-parametric ANOVA, factor ‘station groups’, P < 0.001) (Table 1). Station groups I, J, K and L were characterized by a significantly higher C. fornicata biomass (>4 gAFDW per group) (Figure 2).
Relations between Crepidula fornicata and benthic diversity
ALPHA DIVERSITY
This was measured as number of species per station (i.e. 18 m2). There was significantly higher alpha diversity in sampling locations containing C. fornicata (11 species, on average) compared to stations where it was absent (six species, on average; Mann–Whitney U test, P < 0.001) (Table 2). In addition, there was a significantly positive correlation between number of species per station and the biomass of C. fornicata when they were present (Spearman R = 0.42, P < 0.001) (Figure 4).

Fig. 4. Relations between Crepidula fornicata biomass in stations where the species was present Loge(x + 1) and indices of α and β-diversity (computed excluding C. fornicata). Spearman rank-correlation coefficient is given (with P-level). For visualization purposes, the lines drawn illustrate the slope of the relationship. *P < 0.05; **P < 0.01 and ***P < 0.001.
Table 2. Comparisons of β-diversity indices between stations where C. fornicata was present (‘with’) and stations where C. fornicata was absent (‘without’).

SE, standard error.
BETA DIVERSITY
Values of Whittaker βw index were significantly lower where C. fornicata was present (βw = 10.9, on average) than where it was absent (βw = 17.4, on average) (Table 2). In the same way, Jaccard, Bray–Curtis and chi-squared indices indicated significantly lower β-diversity among stations with C. fornicata than among stations where this species was absent (Table 2). There were also significant negative correlations between these indices of β-diversity and the biomass of slipper limpet (Figure 4). Use of the simple matching index indicated the reverse situation with higher β-diversity on bottoms with slipper limpet than on bottoms without slipper limpet (Table 2) and positive correlation between slipper limpet biomass and distance to centroid (Figure 4). All these indices were computed excluding C. fornicata from the species list.
GAMMA DIVERSITY
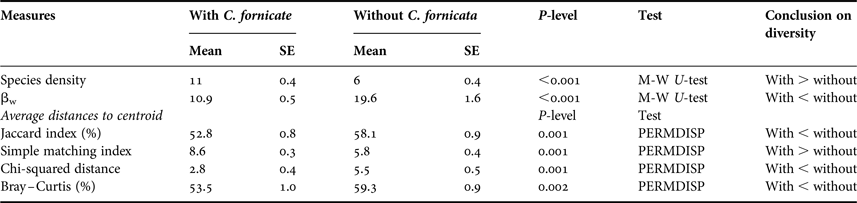
The total number of species identified across all samples was 99 (excluding C. fornicata). In the 93 stations where C. fornicata was absent only 72 species were recorded whereas 90 species were retrieved from the 128 stations with C. fornicata. The nine taxa that were exclusively found in stations where C. fornicata was absent were rare in the bay (i.e. they were retrieved in fewer than three stations out of 221 (Appendix 1)). Over the 27 taxa that were exclusively found in stations with C. fornicata, only four were found in more than three stations (Appendix 1). Comparison of the species-accumulation curves showed that the two curves were rather similar (Figure 5). When comparing the number of species that would on average be retrieved from a similar number of stations (93 stations), species-accumulation curves indicated 76 species for stations without C. fornicata and 82 to 83 species in stations with C. fornicata (Figure 5).

Fig. 5. Species-accumulation plots for stations with (black dots) and without (white dots) Crepidula fornicata.
Stock assessment
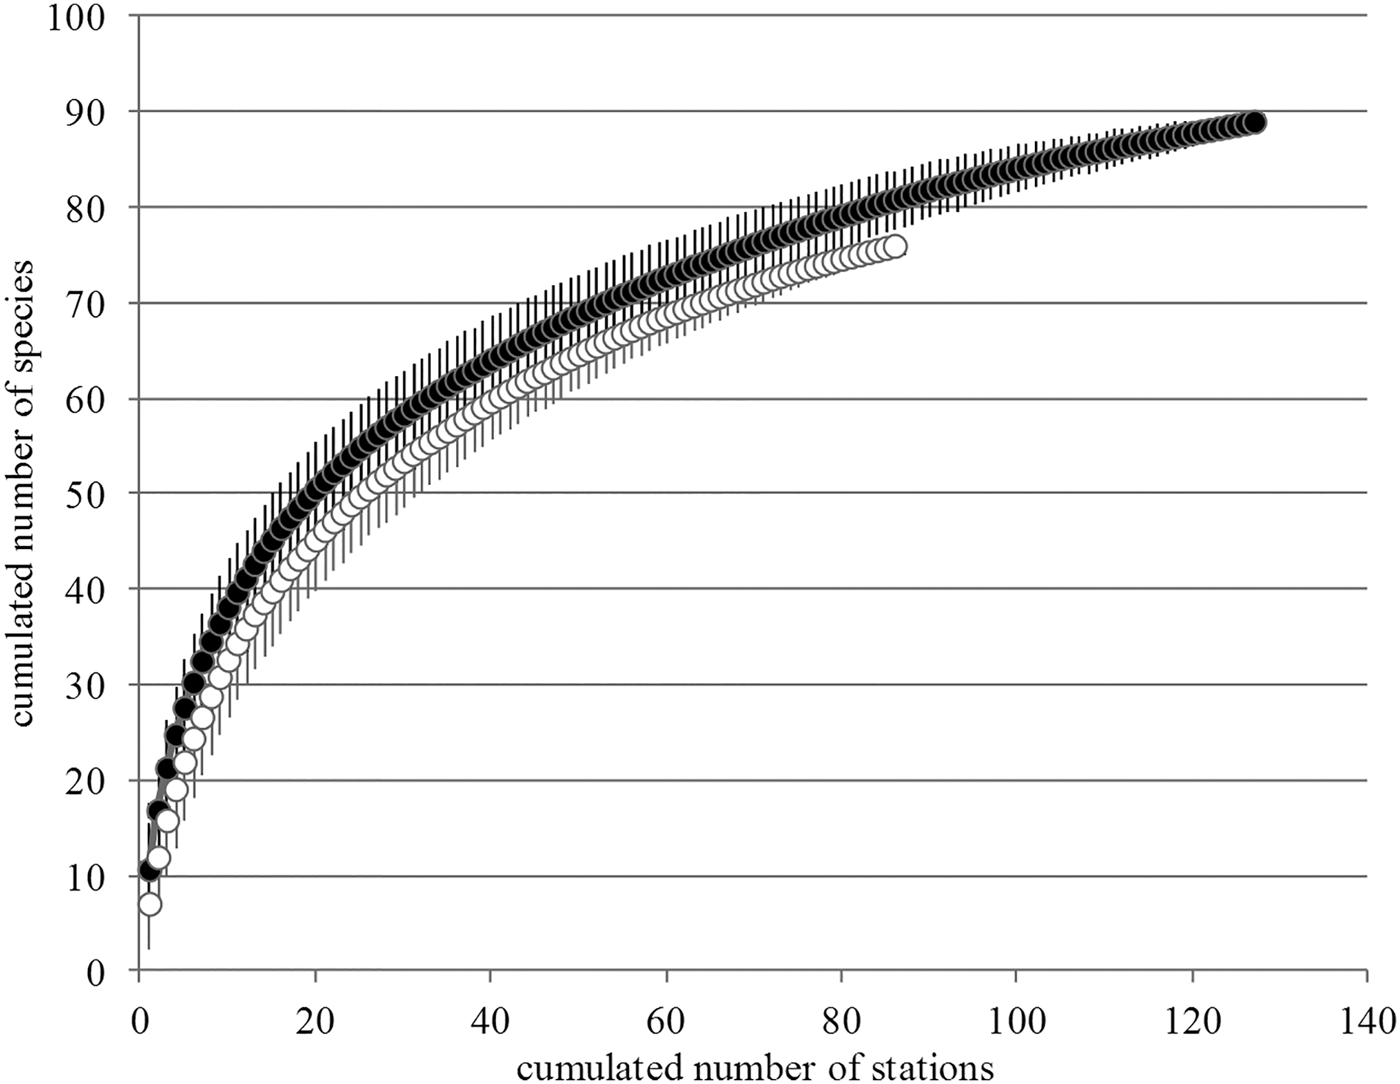
Crepidula fornicata was found in 57% of all stations, but only 28 stations displayed slipper limpet biomass higher than 50 gFW. The total live biomass in Arcachon Bay is estimated at 318 t (±confidence interval = 187 t) spread over 3.11 km2, i.e. 7.1% of the subtidal area of the bay which was not significantly different from 1999 with 5.4% (P = 0.40). The difference of C. fornicata stock in Arcachon Bay between 1999 and 2011 was not significant (P = 0.11). The length distribution based on the totality of samples revealed a higher percentage of individuals smaller than 31 mm in 2011 compared with 1999 (72% vs 49%) and a deficit of individuals larger than 31 mm in 2011 (Figure 6). The average mean shell length in 1999 was 28.5 mm vs 23.8 mm in 2011 (P < 0.001). Crepidula fornicata density in 2011 was 17 ind m−2 (vs 12 ind m−2 in 1999).

Fig. 6. Size frequency (%) according to shell length (mm) of Crepidula fornicata sampled in 1999 and in 2011 (Arcachon Bay).
DISCUSSION
Crepidula fornicata and megabenthic fauna
Three motile species, namely C. maenas, C. crangon and N. reticulatus constituted the core of the megabenthic assemblages encountered in the sheltered sandy and muddy bottoms occurring throughout the inner bay. In the entrance channel, the fauna was different (station group A) related to strong tidal currents and bare sandy bottoms without any fine particles deposit (Bachelet et al., Reference Bachelet, de Montaudouin and Dauvin1996; Blanchet et al., Reference Blanchet, de Montaudouin, Chardy and Bachelet2005). Within the inner part of the bay, the core assemblage was enriched in sessile species (seasquirts, sponges, sessile bivalves) using hard substrates provided by the presence of hard-shelled species such as oysters (C. gigas, another marine invasive species, group F), mussels (M. edulis, groups G and H), C. fornicata (groups K and L) or a combination of the latter species (group J). Although a close association between C. fornicata and the seasquirt Ascidiella aspersa could be suspected since both species characterized both groups K and L (Table 1), these species were not restricted to these groups of stations and also occurred independently. Finally, the benthic megafauna associated with C. fornicata did not display dramatic differences in composition compared with other biogenic reef-forming mollusc species (mainly oysters) found in the bay. This suggests some common pattern in the way these engineer species create new, hard-substrate bottoms in a benthic landscape largely dominated by soft-substratum such as in Arcachon Bay. A similar pattern has been described when comparing native mussel beds and invasive oyster beds to bare sediments (Kochmann et al., Reference Kochmann, Buschbaum, Volkenborn and Reise2008; Markert et al., Reference Markert, Wehrmann and Kroncke2010).
Invasive species are reported as important drivers of species extinction (Molnar et al., Reference Molnar, Gamboa, Revenga and Spalding2008), however there are discussions on this issue (Gurewitch & Padilla, Reference Gurewitch and Padilla2004). In Bay of Brest, for example, the Queen Scallop Aequipecten opercularis is absent when C. fornicata is present and 70 species were considered endangered (Chauvaud, Reference Chauvaud1998). In our case, with low C. fornicata density, there is no evidence of possible species loss in relation to the presence of C. fornicata: (1) species that were exclusively found in stations where C. fornicata was absent were rare; (2) there were very few species displaying lower biomass level in stations where C. fornicata was present (Table 1); and (3) γ-diversity and species accumulation curves were very similar.
There are however indications of benthic composition change as a result of C. fornicata presence. Biomass and species density were ‘stimulated’ in the presence of C. fornicata as previously described in experimental studies (de Montaudouin et al., Reference de Montaudouin, Audemard and Labourg1999) or field monitoring (Guérin, Reference Guérin1970; Chauvaud, Reference Chauvaud1998; de Montaudouin & Sauriau, Reference de Montaudouin and Sauriau1999). When considering the number of species, our results suggest a decrease of β-diversity when C. fornicata was present. Our results indeed showed that stations where C. fornicata was present displayed a higher level of fauna similarity (lower dispersion to centroid, lower βw) than stations where this species was absent. In addition, the level of fauna similarity tended to increase (lower dispersion to centroid, lower βw) as C. fornicata biomass increased. When using the simple-matching coefficient as a measure of faunal similarity among stations, the reverse pattern was observed with a lower level of fauna similarity (higher dispersion) among stations with C. fornicata. Since this index only differed from Jaccard index by taking into account joint-absence as a criterion of similarity and since the Jaccard index indicated higher level of fauna similarity among stations with C. fornicata based on proportion of the number of shared species, these results indicate that stations with C. fornicata displayed lower numbers of joint-absence. As a consequence, this result obtained using the simple-matching coefficient did not mean higher β-diversity when C. fornicata abundance increases. This result confirms that this coefficient is not a good indicator of fauna similarity among samples (Clarke & Gorley, Reference Clarke and Gorley2006; Anderson et al., Reference Anderson, Crist, Chase, Vellend, Inouye, Freestone, Sanders, Cornell, Comita, Davies, Harrison, Fraft, Stegen and Swenson2011).
This lower β-diversity is mainly explained by the fact that there was a higher species density (higher number of species per station) in stations where C. fornicata was present. In the same way, higher β-diversity associated with C. fornicata was revealed by the simple matching coefficient. We showed that this difference was due to a lower level of joint-absence (i.e. there were fewer numbers of species that were absent from each pair of stations). All other β-diversity coefficients (i.e. those focusing on co-occurrence of common (Bray–Curtis, Jaccard) or rare (chi-square) species indicate lower dispersion hence lower β-diversity associated to the increasing biomass of slipper limpets. These results indicate that Crepidula fornicata occurrence negatively impacts β-diversity as mentioned in Bay of Brest with much higher biomass (Chauvaud, Reference Chauvaud1998; Guérin, Reference Guérin2004).
An alternative, but difficult to test, hypothesis would be that C. fornicata may preferentially settle in areas with naturally high α-diversity. However the nature of the fauna associated with C. fornicata and its relative similarity with fauna associated with oysters or mussels compared with bare sediments suggest that there was no pre-existing high α-diversity of megabenthic fauna. In addition, the synthesis provided by Fridley et al. (Reference Fridley, Stachowicz, Naeem, Sax, Seabloom, Smith, Stohlgren, Tilman and Von Holle2007) on relation between number of invasive species and total number of species suggests that invasive species may not be favoured in places with high α-diversity. In apparent contrast, landscapes presenting high γ-diversity would be favourable places for invasive species settlement, leading to an apparent ‘invasion paradox’ in the pattern of relation between invasive species and native species numbers (Fridley et al., Reference Fridley, Stachowicz, Naeem, Sax, Seabloom, Smith, Stohlgren, Tilman and Von Holle2007). Our results suggest, in Arcachon Bay, that the effect of C. fornicata on megafauna diversity did not modify γ-diversity and led to (or is attracted by) high α-diversity and reduced β-diversity.
As a consequence, the relation between C. fornicata and benthic megafauna seems to be a ‘concentration effect’: as C. fornicata appears, it creates a hard substratum attracting fixed epifauna and mobile epifauna that are present in low biomass elsewhere in the bay (e.g. on scattered shell debris) and which concentrate in this new, complex habitat (Chauvaud, Reference Chauvaud1998). The balance among species is changed by the presence and increasing biomass of C. fornicata, however, resulting in an homogenization of benthic megafauna communities with no evidence of modification of species presence (=no species loss). Guérin (Reference Guérin2004), in the context of a strong C. fornicata invasion, also underlined no effect on global megafauna diversity but a modification of species composition. In a former study, Chauvaud (Reference Chauvaud1998) suggested that bottom homogenization (i.e. decrease of β-diversity) started at a threshold of 20–50 C. fornicata m−2. In Arcachon Bay, only 23% and 12% of sampled stations displayed a density >20 or 50 ind m−2, respectively (not illustrated).
This ‘concentration effect’ is not restricted to Crepidula fornicata: it is probably common to other biogenic reef-forming species such as mussels or oysters (Markert et al., Reference Markert, Wehrmann and Kroncke2010). But our results suggest that this phenomenon could become a potential threat to local benthic fauna diversity if the reef-forming species (here, C. fornicata) becomes invasive.
Stock assessment
Forty-two years after its first identification in Arcachon Bay (Bachelet et al., Reference Bachelet, Cazaux, Gantès and Labourg1980), the total living stock of the slipper limpet Crepidula fornicata in 2011 is only 318 t (±CI = 187 t) and did not significantly increase since the last survey in 1999 (155 t ± CI = 72 t) (de Montaudouin et al., Reference de Montaudouin, Labarraque, Giraud and Bachelet2001). Compared with Bay of Mont Saint-Michel (1160 t km−2), Bay of Brest (820 t km−2) or Bay of Saint-Brieuc (288 t km−2) (Blanchard, Reference Blanchard2009), the biomass in Arcachon Bay calculated on the basis of 44 km2 of infralittoral suitable habitat is low (7 t km−2). In other terms, C. fornicata is not invasive at Arcachon Bay's scale. The reasons for this stagnation have already been discussed in a previous paper (de Montaudouin et al., Reference de Montaudouin, Labarraque, Giraud and Bachelet2001) and are certainly still valid: hydrosedimentary features, presence of Zostera marina beds (although they are declining (Plus et al., Reference Plus, Dalloyau, Trut, Auby, de Montaudouin, Emery, Claire and Viala2010)) and the prohibition of trawling gears in the bay which facilitate spreading by bottom dispersal or by on-board sorting operations. The colonizing process by C. fornicata in Arcachon Bay is not active: in 1999, 2.36 km2 were colonized (de Montaudouin et al., Reference de Montaudouin, Labarraque, Giraud and Bachelet2001) against 3.11 km2 in 2011 (P = 0.40). However, our results showed a smaller average shell length (28.5 mm in 1999 vs 23.8 mm in 2011). We cannot fully explain this trend but it indicates that the total living stock (in tons) of C. fornicata has not significantly changed during the period between investigations. The smaller average shell length in 2011 is related to a higher percentage of small individuals, particularly of the 6–21 mm range. According to growth parameters calculated in a previous study (de Montaudouin et al., Reference de Montaudouin, Labarraque, Giraud and Bachelet2001), we can estimate that these individuals belong to the previous recruitment (0+, 2010) which was presumably of higher intensity than in 1998. The deficit of larger individuals in 2011 may be related to higher mortality of older (larger) individuals. However, in comparison with de Montaudouin et al. (Reference de Montaudouin, Labarraque, Giraud and Bachelet2001) and for the same geographic sectors, the number of individuals per chain was the same in 1999 and 2008, i.e. between 3.8 and 5.0 following sectors (not illustrated). Another explanation is that growth rate was lower in 2011. Stunted growth in Arcachon Bay was reported for other suspension-feeders such as Manila clams Ruditapes philippinarum (de Montaudouin et al., Reference de Montaudouin, Lucia, Binias, Lassudrie, Baudrimont, Legeay, Raymond, Jude-Lemeilleur, Lambert, Le Goïc, Garabétian, Gonzalez, Hégaret, Lassus, Mehdioub, Bourasseau, Daffe, Paul-Pont, Plus, Do, Meisterhans, Mesmer-Dudons, Caill-Milly, Sanchez and Soudant2016) but it is not possible to discriminate whether it is a long-term characteristic of this lagoon or a trend along years. However the first hypothesis seems more plausible. Indeed, there is no clear pattern of trophic resource change in Arcachon Bay during the investigated period: a phytoplankton survey (1993–2010) revealed no significant change of species composition (David et al., Reference David, Ryckaert, Karpytchev, Bacher, Arnaudeau, Vidal, Maurer and Niquil2012) while Chl-a biomass remained constant in the 1987–2012 period (ARCHYD data, in David, Reference David2016).
CONCLUSION
The ecological impact of C. fornicata occurrence in Arcachon Bay appears to be limited since this species represents for instance only 0.4% of another suspension feeder biomass in the bay, the oyster C. gigas (Scourzic et al., Reference Scourzic, Loyen, Fabre, Tessier, Dalias, Trut, Maurer and Simonnet2011), and did not show signs of increasing biomass at a 12-year scale. This species has probably had an impact on benthic megafauna by acting as an ecosystem engineer. Its presence leads to the creation of a new hard substratum habitat that attracts and concentrates the existing mobile and fixed megafauna with no sign of species loss at the scale of the bay. In terms of ecology, at its current population size, C. fornicata appears ecologically neutral in Arcachon Bay where it concentrates megafauna species, leading to locally increased diversity (α-diversity) but with a potential for homogenization of the benthic landscape which decreased β-diversity (Chauvaud, Reference Chauvaud1998; Guérin, Reference Guérin2004). Conversely, the geographic range of C. fornicata is present in a wider area than 12 years before (×1.3) and has recently appeared as a threat to the mussel fishery industry because it fouls shells and reduces the market value of the production.
In a wider concern, our results are consistent with most other works dealing with the effect of marine engineer-species on diversity at different scales. For example, the exotic macroalga Caulerpa racemosa invaded soft-bottoms in the Mediterranean Sea, increasing α-diversity, with no impact on overall diversity but a decrease of β-diversity (Pacciardi et al., Reference Pacciardi, De Biasi and Piazzi2011). As well, in the case of the Pacific oyster C. gigas, which is an important exotic and invasive bivalve along Atlantic European coasts, an increase of α-diversity is also observed (Troost, Reference Troost2010). However, at a larger scale, the species composition and richness of associated communities may vary according to the variability of the local set of species, and β-diversity may not be affected when a reef develops (e.g. with oysters; Lejart & Hily, Reference Lejart and Hily2011).
Homogenization of communities (=global decrease of β-diversity) is occurring worldwide and is a major concern in ecology. Together with species extirpation, introduction of species are the two causes of this phenomenon documented for many different communities (Olden, Reference Olden2006; Olden & Rooney, Reference Olden and Rooney2006, and references therein). In this general context of loss of biotic differentiation, the spatial homogenization of benthic megafauna communities at the scale of a marine bay by C. fornicata as suggested by this study underlines the importance of addressing β-diversity when assessing the impact of (potentially) invasive species on ecosystems.
SUPPLEMENTARY MATERIAL
The supplementary material for this article can be found at https://doi.org/10.1017/S0025315417001655.
ACKNOWLEDGEMENTS
We are grateful to Anne Littaye and Romain Hubert (Agence des Aires Marines Protégées) for motivating this work. The sailors of the ship ‘Planula IV’ (INSU), Francis Prince, Nicolas Lavesque and Laurent Letort are warmly acknowledged for their help during sampling. We would also like to thank Paul Renaud for his advice on a prior version of this work as well as Sabine Cochrane for their comments and improvement of English. We would also like to thank two anonymous referees for providing helpful comments that contributed to improve this manuscript.
FINANCIAL SUPPORT
This study was partly financed by Agence des Aires Marines Protégées (B.H. grant) and Syndicat Intercommunal du Bassin d'Arcachon.