


INTRODUCTION
Research on intertidal communities is a reliable path to investigate complex and at the same time delicate equilibria upholding intertidal habitats and their organisms. Understanding the processes working at the organism-habitat level in coastal ecosystems has the potential to shed some light on anthropogenic challenges facing those ecosystems, e.g. sea level rising, ocean acidification and urbanization of coastal areas (Brierley & Kingsford, Reference Brierley and Kingsford2009; Perkins et al., Reference Perkins, Ng, Dudgeon, Bonebrake and Leung2015). They are also important in establishing patterns of energy flow and their pathways (Vinagre et al., Reference Vinagre, Leal, Mendonça, Madeira, Narciso, Diniz and Flores2015) and also can help conservation biologists in the identification of coastal habitats to be protected (Ellis, Reference Ellis2003; Magurran, Reference Magurran2004). Of the different types of intertidal habitats, rocky shores are best suited for ecological studies due to their characteristics, such as higher biodiversity, physical stability, relatively shorter recovery time, easy access, open nature and steep environmental gradients (Knox, Reference Knox2000; Thompson et al., Reference Thompson, Crowe and Hawkins2002).
The Gulf of Oman (also known as the Oman Sea) is a marine eco-region north-west of the Indian Ocean that harbours exclusive biota in particular climatic and hydrological regimes (Schils & Wilson, Reference Schils and Wilson2006; Spalding et al., Reference Spalding, Fox, Allen, Davidson, Ferdaña, Finlayson, Halpern, Jorge, Lombana and Lourie2007; Piontkovski & Chiffings, Reference Piontkovski and Chiffings2014) (Figure 1A, B). The Iranian shores at the Gulf of Oman are generally rocky and are dominated by sandy plains or sand dunes in their upper sections (Figure 1D, E), while most parts of the subtidal zones are made up of hard reefs and corals (Chiffings, Reference Chiffings, Bleakley, Kelleher and Wells1995; Naderloo et al., Reference Naderloo, Ebrahimnezhad and Sari2015). This gulf is situated in the subtropics and is characterized by the largest periodic wind reversals and near-surface currents in the world, i.e. the Indian Ocean's monsoonal circulation system (Wang et al., Reference Wang, Clemens, Beaufort, Braconnot, Ganssen, Jian, Kershaw and Sarnthein2005). Broadly speaking, the Gulf of Oman experiences two distinct monsoonal seasons: summer or south-west monsoon (SWM) from May to September, and winter or north-east monsoon (NEM) from November to March (Prasad et al., Reference Prasad, Ikeda and Kumar2001; Piontkovski et al., Reference Piontkovski, Al-Azri and Al-Hashmi2011). October and April are considered as inter-monsoonal seasons, i.e. the autumn inter-monsoonal season (FIM) and spring inter-monsoonal season (SIM), respectively. It has been shown that the monsoon influence can play an important role in stimulation of a series of changes in non-biological (Piontkovski et al., Reference Piontkovski, Al-Gheilani, Jupp, Al-Azri and Al-Hashmi2012; Saket & Etemad-Shahidi, Reference Saket and Etemad-Shahidi2012; Piontkovski & Chiffings, Reference Piontkovski and Chiffings2014) and biological (Brink et al., Reference Brink, Arnone, Coble, Flagg, Jones, Kindle, Lee, Phinney, Wood and Yentsch1998; Taheri & Foshtomi, Reference Taheri and Foshtomi2009; Fazeli & Zare, Reference Fazeli and Zare2011; Piontkovski et al., Reference Piontkovski, Al-Azri and Al-Hashmi2011; Hamzehei et al., Reference Hamzehei, Bidokhi, Mortazavi and Gheiby2013; Pourvali et al., Reference Pourvali, Pour Fatemeh, Arash and Hamid2014; Rabbaniha et al., Reference Rabbaniha, Mousavi Golsefid and Owfi2014) settings in the Gulf of Oman. Moreover, some researchers (Reynolds, Reference Reynolds1993; Johns et al., Reference Johns, Jacobs, Kindle, Murray and Carron1999; Piontkovski et al., Reference Piontkovski, Al-Gheilani, Jupp, Al-Azri and Al-Hashmi2012) have suggested that localized upwellings (with a peak in February–March), in association with NEM, taking place along the Iranian Gulf of Oman coast, possibly have great biological consequences.

Fig. 1. Detailed map of the sampling site: (A and B) Location of the Gulf of Oman with its maritime boundaries (in accordance with the International Hydrographic Organization) at the north-western part of the Indian Ocean and Arabian Sea; (B) Djod Village's location in the northern coast of the Gulf of Oman and south-west of the Sistan and Balouchestan Province of Iran; (C) Schematic drawing (not scaled) of three permanent perpendicular transects (T1, T2 and T3) along the village's coast with the length of each transect (140, 180 and 230 m) and distances among them (880 and 860 m), letters H, M and L refer to the high-, mid- and low-intertidal zones, respectively. In T3, a schematic view of square placement along the transect in this study is shown; (D) The sandy part of the first transect with many dome-shaped burrow openings, belonging to O. rotundata and the sand dunes in the higher parts of the shore; (E) A view from the start-point of the rocky part in a transect when the seawater is starting to rise again.
Decapod crustaceans are one of the most diverse groups of animals contributing to intertidal communities (Ng et al., Reference Ng, Guinot and Davie2008; De Grave et al., Reference De Grave, Pentcheff, Ahyong, Chan, Crandall and Dworschak2009; Pohle et al., Reference Pohle, Iken, Clarke, Trott, Konar, Cruz-Motta, Wong, Benedetti-Cecchi, Mead and Miloslavich2011; Negromonte et al., Reference Negromonte, Araújo and Coelho2012). They have been labelled as ‘ecological indicators’ (Neves & Bemvenuti, Reference Neves and Bemvenuti2006) and ‘ecosystem engineers’ (Berkenbusch & Rowden, Reference Berkenbusch and Rowden2003). Hence, they play significant roles in the structure, dynamics, trophic webs and nutrient cycles of marine benthic habitats and communities (Jones & Shulman, Reference Jones and Shulman2008; Nagelkerken, Reference Nagelkerken2009; Boudreau & Worm, Reference Boudreau and Worm2012; Pacheco et al., Reference Pacheco, Thiel, Uribe, Campos and Riascos2013). Numerous studies have shown that the distribution patterns of decapods in different marine habitats, including mangroves (Macintosh, Reference Macintosh1988; Arruda Bezerra et al., Reference Arruda Bezerra, Braga Dias, Ximenes Santana and Matthews-Cascon2006), mudflats (Jones & Clayton, Reference Jones and Clayton1983; Apel, Reference Apel1994; Naderloo et al., Reference Naderloo, Türkay and Sari2013), rocky shores (Pohle et al., Reference Pohle, Iken, Clarke, Trott, Konar, Cruz-Motta, Wong, Benedetti-Cecchi, Mead and Miloslavich2011), sandy shores (McLachlan & Brown, Reference McLachlan and Brown2006), deep seas (Cartes & Sardà, Reference Cartes and Sardà1993) and river basins (Freitag, Reference Freitag2005) reflect a form of zonation. The literature on the decapod fauna of the Gulf of Oman is mainly taxonomic (Naderloo & Türkay, Reference Naderloo and Türkay2012; Naderloo et al., Reference Naderloo, Ebrahimnezhad and Sari2015), and basic information on ecological aspects of decapods is missing.
The main goals of this study were to quantitatively characterize the composition, assemblage structure and zonation patterns of the decapod communities at a rocky intertidal shore at the northern coast of the Gulf of Oman, describing their temporal fluctuations. Moreover, we were able to confirm the presence of previously reported species but are also reporting new geographic records. The data provided here have the potential to become a baseline for further comparative studies. Furthermore, this study marks the starting point for a 10-year monitoring project in order to assess the influence of global warming on intertidal communities of the northern Indian Ocean.
MATERIALS AND METHODS
Study area
The study (2014–2015) was carried out at a wave-exposed shore on the northern Gulf of Oman coast (Figure 1B, D, E; Table A1). The study area is subject to a subtropical hot and dry coastal climate with a mean annual temperature of 26.8°C, a relative humidity of 61% and rainfall of 110.5 mm (Iran Meteorological Organization), characterized by monsoonal seasons (Taheri & Foshtomi, Reference Taheri and Foshtomi2009). The tide typically shows a mixed dominant semi-diurnal pattern with maximum and minimum heights between 0 and 2.9 m, respectively (Akbari et al., Reference Akbari, Sadrinasab, Chegini and Siadatmousavi2016). The gently sloped shore in the area is clearly divided perpendicularly in two main parts: a steeper sandy part at the uppermost limit of high tides, extending upwards as sand dunes; and the low, sloping and rocky part which appears immediately after the sandy part, extending to the sub-tidal zone, where it is mostly composed of calcareous and limestone rocks (Figure 1D, E; Table A1). During the high tides, the rocky part is completely covered by seawater.
Sampling
The sampling was carried out during the four different seasons described above. In each season, samples were collected quantitatively and qualitatively, a few days before and after the new and full moons. All quantitative sampling (by squares) was conducted only during daytime, whereas qualitative sampling was carried out during both day and night. Three permanent perpendicular transects (Table A1), running from the upper limit of ghost crab burrow openings at the sandy part (Figure 1D) to the lowest low tide level in the rocky part (Figure 1E), were chosen. The species Ocypode rotundata (Miers, 1882), Coenobita scaevola (Forskål, 1775), Scopimera crabricauda (Alcock, 1900) and Austruca iranica (Pretzmann, 1971) were only found in the sandy parts, so hereafter we call these sand-dwelling species. In the case of O. rotundata (a ghost crab), the number of burrow openings in each 5 × 5 m2 square was counted; in the case of C. scaevola (a semi-terrestrial hermit crab), their track per cent on sand in each 0.25 × 0.25 m2 square was used for an estimation of their presence; for finding S. crabricauda (soldier crab) and A. iranica (fiddler crab), sand in each 0.25 × 0.25 m2 square (10–15 spades of sand, ~20 cm deep) was sieved through a standard 2 mm sieve and the remains quickly inspected for living specimens.
We divided the rocky part of each transect into three separate parts, high-, mid- and low-intertidal zones, based on two general physical and biological features (Stephenson & Stephenson, Reference Stephenson and Stephenson1972; Underwood, Reference Underwood1984; Raffaelli & Hawkins, Reference Raffaelli and Hawkins1999; Ellis, Reference Ellis2003). The physical sign was the distance from the starting point of the rocky part, and for the biological sign, the presence or absence of algal communities were taken into account. The high-intertidal zone was determined by higher abundance of the barnacle Amphibalanus amphitrite (Darwin, 1854), the bivalve Saccostrea sp., the chiton Acanthopleura sp. and the gastropods Nerita sp. and Cellana sp., as well as by the absence of algae. The starting point of the upper fringe and the total length of the mid-intertidal zone were defined by presence of two dominant green algae (Chaetomorpha sp. and Enteromorpha sp.). In the low-intertidal zone, dense presence of several species of sponges, cnidarians, the sea urchin Echinometra sp., as well as green (Caulerpa sp., Halimeda sp., Ulva sp., Valoniopsis sp.), brown (Dasya sp., Dictyota spp., Padina spp., Rosenvingea sp.) and red algae (Celidium sp., Champia sp., Cottoniella sp., Jania sp., Laurencia spp., Liagora sp.) have revealed many complex microhabitats. In each defined zone, we used a 0.5 × 0.5 m2 square with three replicates, so in each transect we had nine squares in the rocky part (Figure 1C). In each square, specimens were collected mainly by hand and a small scoop net. For smaller species, rocks were smashed by a hammer and specimens were collected using forceps. In each square, after collecting all specimens visible to the naked eye, all the remaining rubble and sediment was sieved through a 2 mm sieve and the tailings were quickly inspected for other possible living specimens. For a better coverage and to avoid bias in the description of decapod communities, especially those outside the transects, the study area was sampled qualitatively. In this sampling, specimens were collected mainly from exposed reefs, tidal pools, beneath the rocks, at small pores and among sponges, algae and corals. Specimens were fixed in 75% ethanol and deposited in the Zoological Museum, University of Tehran (ZUTC) after identification.
Environmental factors
Six environmental factors were measured including air and water temperatures, dissolved oxygen (DO) and oxygen saturation per cent (OSP), with OxyGuard®, Handy Gamma model; salinity was recorded with a hand refractometer, Milwaukee®, MR100ATC model; and pH was measured with the MARTINI® pH 56 model. During each sampling, we measured the factors twice a day: (1) once before sampling started (when water covered most of intertidal region) at the high-intertidal zone and (2) when the sea level was at its lowest point on the shore. Furthermore, the geographic position and the length of transects were recorded using a hand-held GPS (Garmin). The sight method adopted from Bakus (Reference Bakus2007) was applied for the measurement of the transects slope.
Statistical analyses
Squares with no samples (‘zero' squares, three of 108 total) were not excluded from the analyses. The four sand-dwelling species, in addition to the species found in qualitative samplings (15 species, Table 1), were excluded from quantitative analyses because the four sand species had different habitats (sand part of transects) and were measured with different square sizes, and in the case of qualitative species we did not apply any square. Consequently, the main analyses were performed on 56 species (~75% of total species) that were present in quantitative samplings in the rocky parts of transects. Prior to analysis, data were tested for normality (using Shapiro–Wilk Test), with significance at P ≥ 0.05. When the data were not normally distributed, we used logarithm transformation (for environmental data) and square root transformation (for abundance data) for normalization. Then, one-way ANOVA (SPSS ver. 23) was applied to test significant differences (P < 0.05). Common ecological indices that were calculated in PRIMER Ver. 6.1.6 (Clarke & Gorley, Reference Clarke and Gorley2006) were: (1) Margalef index for species richness (d = S − 1/Log N) (Margalef, Reference Margalef1953); (2) Shannon index for species diversity (H = −SUM (Pi × Log2 (Pi)) (Shannon & Weaver, Reference Shannon and Weaver1998); and (3) Pielou index of evenness  $J = H/{\rm Log}(S) = {\rm \;} \displaystyle{H / {H\; {\rm max}}}$ (Pielou, Reference Pielou1969), where in all cases S = total number of species, Pi is the proportion (n/N) of individuals of one particular species found (n) divided by the total number of individuals found (N). The similarity/dissimilarity analysis amongst the sampling periods and intertidal zones were carried out by PRIMER. The SIMPER routine in PRIMER was used to detect the species which contribute most to the dissimilarity of the assemblages amongst the samplings, intertidal zones and transects (Table A3). Principal correspondence analysis (PCA) in CANOCO 5 (Microcomputer Power, Inc., USA) was applied to test the correlation between decapod communities and environmental variables. The frequency of occurrence (FO) for each species was obtained from the equation FO = q100/Q (where q = number of squares containing the species, and Q = the total number of squares in the transects (=108)). FO was classified arbitrarily into four groups as follows: very frequent (VF) (≥70%), frequent (F) (40 to <70%), low frequent (LF) (10 to <40%) and infrequent (IF) (<10%). The Relative Abundance (RA) for each species was obtained from the equation RA = n100/N (where n = the number of individuals of a species and N = total number of individuals in each square where that species was found). They were also classified as following: dominant (D) (≥70%); abundant (A) (40 to >70%); low abundant (LA) (10 to >40%); and rare (R) (≤10%). Chao2 algorithm (incorporated in PRIMER) was used for calculating the expected number of species in the total samples and separately for high-, mid- and low-intertidal zones to indicate the sufficiency of sampling effort. For visualizing the differences among the samplings and also among transects, MDS analysis (in PRIMER) was applied after the square root transformation and calculation of similarities.
Table 1. All families (27 families) and speciesa (75 species) of decapod crustaceans found in the Djod Village shore, north of the Gulf of Oman, Iran.

The indices of FO (Frequency of Occurrence) and RA (Relative Abundance) of each species and the classifications thereof are presented. The species with * were only found in qualitative samplings (15 species), ** found only in sandy part of transects and supralittoral zone during both quantitative and qualitative samplings (4 species) and *** found only in rocky part of transects during both quantitative (and also qualitative) samplings (56 species). The species (20 species) with $ symbol are recorded for the first time from the Gulf of Oman, and the species (13 species) with # symbol are recorded for the first time from the Iranian coast of the Gulf of Oman (see the text for more information).
a The families and the species are presented in evolutionary (based on De Grave et al. 2009) and alphabetical orders, respectively.
RESULTS
Diversity of decapods
Seventy-five species of decapods were identified which belonged to 48 genera, 27 families and four infraorders (Brachyura, 48 species; Anomura, 20 species; Caridea, five species and Axiidea, two species) (Table 1). Porcellanidae (11 species, ~15%), Xanthidae (11 species, ~15%), Portunidae (seven species, 9%) and Pilumnidae (six species, 8%) were the top four most species-rich families, and more than 50% of the families (15 families) had just one species (Table 1). Petrolisthes (seven species, ~10%) was the most dominant genus, followed by Thalamita (five species, ~7%), Menaethiops (three species, 4%) and Pilumnus (three species, 4%). The remaining 44 genera were presented with either two (13 genera) or one (31 genera) species (Table 1). Fifteen of 75 total species (20%) were only found in qualitative samplings (Table 1).
Fluctuations in abundance and diversity
The four sand-dwelling species comprise nearly 5% of total identified species (Table 1). The species of C. scaevola and A. iranica did not show any significant difference (P > 0.05) between samplings. However, the abundance of S. crabricauda and O. rotundata between samplings showed significant differences (P < 0.05) (Figure 2). The total mean abundance and diversity (±SE) of decapods were 100.55 ± 10.48 and 25.92 ± 1.68 m−2, respectively. The highest and lowest values of total mean abundance and diversity were obtained in the third and first sampling, respectively (Figure 3A). Concerning abundance, only the difference between the first and third sampling was significant (P = 0.007) and the difference between the second and third sampling was just marginally significant (P = 0.049; Figure 3A). There were no significant differences (P = 0.486) in mean diversity among samplings (Figure 3A). Mid-intertidal in comparison with other zones showed higher abundance and diversity; high-intertidal zones with both mid- and low-intertidal zones showed significant differences in mean abundances and diversity (P < 0.05, see Figure 3B for details); there was no significant difference between mid- and low-intertidal zones in mean abundance (P = 0.566) and diversity (P = 0.662). The values of mean abundance and diversity among three transects were greater in the third transect, but these values statistically showed no significant differences (P = 0.570 for abundance, and P = 0.969 for diversity; Figure 3C).

Fig. 2. The mean (logarithmic) abundance of the four sand-dwelling species in different sampling periods, S. crabidauda and A. iranica individuals in one square metre of sand with a depth of 20 cm (see Sampling), burrow numbers of O. rotundata in a 5 × 5 m2 square and track per cent of C. scaevola in a 0.25 × 0.25 m2 square. The significant difference statistics are presented for each species.

Fig. 3. The mean abundance and diversity of decapod crustaceans in different (A) sampling periods, (B) intertidal zones and (C) transects. The total individuals and species (in parentheses) in quantitative sampling of rocky part in each sampling are presented (A).
Frequency of occurrence (FO) and relative abundance (RA), total individuals
Based on the classification of FO index, 1.7% of all species (1 of 56 species) were very frequent, 3.5% (2 of 56 species) were frequent, 23.2% (13 of 56 species) were less frequent, and 71.6% of species were infrequent (Figure 4, Table 1). The classification based on the RA index classified all 56 species in two categories of less abundant (33.9%, 19 species) and rare (66.1%, 37 species) (Figure 4, Table 1). The number of total individuals for some species, for example Petrolisthes leptocheles (Heller, 1861), Alpheus lobidens (De Haan, 1850) and Clibanarius signatus (Heller, 1861) were greater than the those for other species (Figure A1). On the other hand, species such as Hyastenus inermis (Rathbun, 1911), Thalamita loppenthini (Herbst, 1803) and Pilumnus vespertilio (Fabricius, 1793) each with only one specimen had the least number of total individuals (Figure A1).

Fig. 4. Scatter plot classification of 56 species of decapod crustaceans based on the Frequency of Occurrence (FO, %) on x-axis and the mean of Relative Abundance (RA, %) on y-axis. Species with higher FO and/or RA values are labelled.
Changes in the ecological indices
The Margalef index (MI) did not show any significant difference between samplings (Figure 5A) and transects (Figure 5C), while only the difference between high- and mid-intertidal zones was significant (Figure 5B). The Shannon index (SI), similar to the Evenness index (EI) did not show significant differences among samplings and transects (Figure 5A, C). The mid-intertidal zone showed a higher value in SI than other zones, and the high-intertidal zone showed a significant difference in SI with those in the mid- and low-intertidal zones, but there was no significant difference between the mid- and low-intertidal zones (Figure 5B). Evenness index did not show any significant differences amongst samplings (Figure 5A), intertidal zones (Figure 5B) and transects (Figure 5C).

Fig. 5. The changes in values of ecological indices over (A) sampling periods, (B) intertidal zones and (C) transects.
Fluctuations in the environmental factors
Water temperature (total mean of 28.6°C; Table A2) at the first sampling showed significant differences with other samplings (Figure A2). The differences of air temperature (total mean of 29.5°C; Table A2) between all samplings were significant, except between the first and fourth, and between the second and fourth samplings. The mean of pH (total mean of 7.51; Table A2) between all samplings showed significant differences, except those between the second and third samplings. The mean of DO (total mean of 6.68 Mg l−1; Table A2) in the SWM showed significant differences with the FIM and SIM. The mean of OSP (total mean of 109%; Table A2) in SWM showed significant difference with other samplings. The salinity (total mean of 37; Table A2) of the first sampling showed significant difference with the second, third and fourth samplings.
Cluster, SIMPER and PCA analyses
Cluster analysis showed the intertidal zones to be classified into two main parts (upper and lower intertidal) while the mid intertidal zone is equally nested in these two main groups (Figure 6). The SIMPER analysis showed that dissimilarities between samplings were greatest between the first and third sampling (total average dissimilarity = 36.02%) (Table A3). Some species, i.e. Macromedaeus voeltzkowi (Lenz, 1905), P. leptocheles and Pachycheles natalensis (Krauss, 1843) were the most contributing species to this dissimilarity. Total average dissimilarity between the high- and low-intertidal zone (40.48%) was greater than those between the high- and mid-intertidal (35.37%), and the mid- and low-intertidal zone (28.63%) (Table A3). Some species, i.e. A. lobidens, Zozymodes xanthoides (Krauss, 1843) and P. natalensis were among the major contributors to the dissimilarities between the three intertidal zones. Furthermore, this analysis showed that the average dissimilarity between the first and third transects (27.36%) was greater than those between the second and third (26.83%), as well as the first and second transects (22.84%). The PCA analysis in CANOCO of 56 species occurring on rocky substrate showed that most decapod species have tendencies to inhabit the mid- and low-intertidal zones (Figure 7A, B), and some species were found only in one zone: 1, 5 and 16 species were found only in high-, mid- and low-intertidal zones, respectively (Figure 7B). The high- and mid-intertidal zones have a greater overlap in species composition compared with the high- and low-intertidal zones (Figure 8). The third sampling (with highest species diversity) showed high correlation with salinity, while decapod community, in general, showed highest correlation with air and water temperatures (Figure 9). The Chao2 algorithm indicated sufficiency of sampling effort in general and separately for mid- and low-intertidal zones, while at the high-intertidal zone sampling effort may have been nearly sufficient (Figure A3). The MDS analysis showed that the first sampling (in SWM) has greatest difference with the third sampling (in NEM), and also there are distinctions among transects (Figure A4).

Fig. 6. Similarity dendrogram of the intertidal zones based on 56 species of decapods. The mid-intertidal zone has been nested equally between two major parts (upper and lower intertidal).
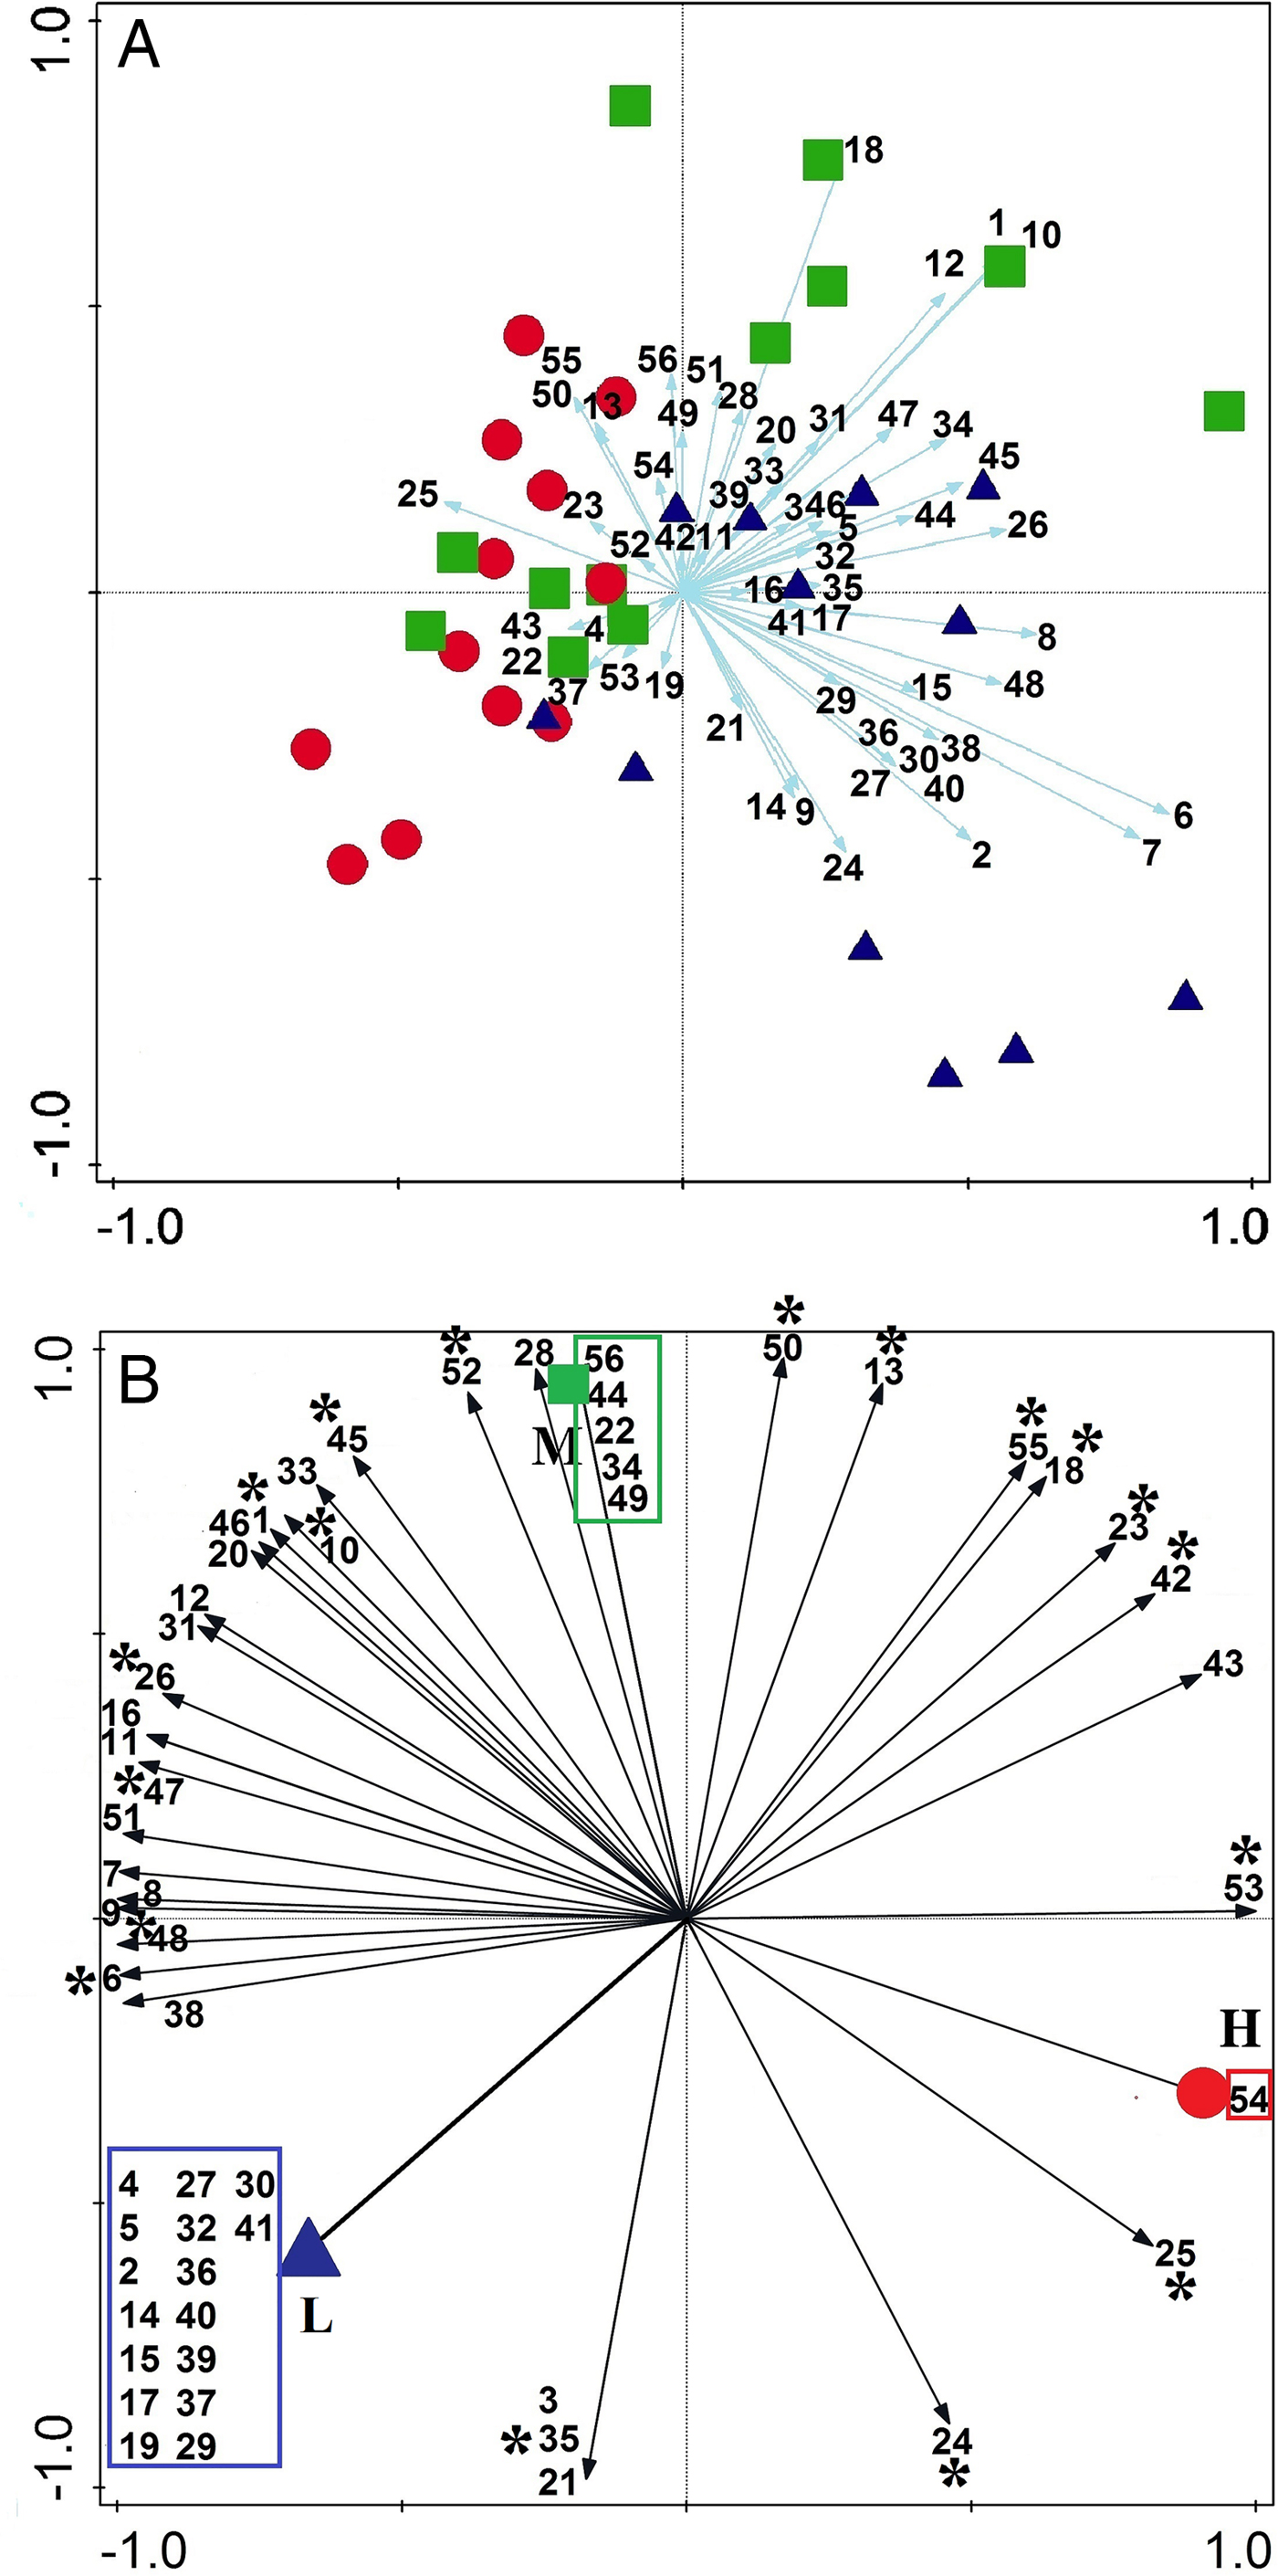
Fig. 7. Principal component analysis results, showing the correlations of decapod species to each intertidal zone (mid = green squares, low- = blue triangles and high-intertidal zones = red circles). (A) Most species have stronger correlation with mid- and low-intertidal than high-intertidal zones. (B) The numbers in the boxes refer to specific species of each zone. Species with asterisk were present in all three defined zones, while the species without asterisk outside boxes were present in two of three zones. See Figure 9 for the species list based on the numbers.

Fig. 8. The PCA showed degree of disparity and overlap among three defined intertidal zones high (red/dashed line), mid (green/dotted line) and low intertidal (blue/straight line) in this study based on intertidal decapod species. S4T3L for example refers to low-intertidal zone at transect 3 at sampling 4.

Fig. 9. PCA diagram, showing the relation between 56 species of decapod crustaceans, environmental variables and sampling periods (with species diversity). The vector lines represent the relationship of significant environmental variables to the ordination axes and their length is proportional to their relative significance. The species are labelled by the first three letters of the generic and specific names. S, sampling; OSP, oxygen saturation per cent; WT, water temperature; AT, air temperature; DO, dissolved oxygen; Sal, salinity.
DISCUSSION
Diversity of decapod crustaceans
Documentation of marine biodiversity patterns and understanding the processes driving those patterns are clearly necessary for the detection of any changes in coastal ecosystems. This study is the first quantitative study on species composition, community assemblage and vertical zonation patterns of a rocky intertidal decapod community, in relation to environmental factors in the northern Indian Ocean and Gulf of Oman. The Gulf of Oman, due to its relative openness and experiencing monsoonal seasons, is characterized by a mild climate when compared with its adjacent body of water, the Persian Gulf (Coles, Reference Coles2003). For instance, while the water temperature range at the Gulf of Oman is 25–32°C with a mean salinity of about 37 ppt, the same parameters in the Persian Gulf are 32–35°C and >35–40 ppt (Reynolds, Reference Reynolds1993; Schils & Wilson, Reference Schils and Wilson2006; Foster et al., Reference Foster, Foster, Al-Cibahy, Al-Harthi, Purkis, Riegl, Riegl and Purkis2012). Rocky intertidal shores along the Gulf of Oman coasts, in comparison with the same coasts at the Persian Gulf, are experiencing less heat and salinity stresses and consequently are expected to be more productive and host more diverse biota (Basson et al., Reference Basson, Burchard, Hardy and Price1977; Wei et al., Reference Wei, Rowe, Al-Ansi, Al-Maslamani, Soliman, El-Din, Al-Ansari, Al-Shaikh, Quigg and Nunnally2016).
The Gulf of Oman is home to nearly 1.7% of world decapod diversity (De Grave et al., Reference De Grave, Pentcheff, Ahyong, Chan, Crandall and Dworschak2009), and its northern (Iranian) coast harbours more diversity than the southern and south-western coasts (Oman and UAE) (Naderloo et al., Reference Naderloo, Ebrahimnezhad and Sari2015). Among 75 identified species during the present study, 33 species are new records for the Iranian coasts of the Gulf of Oman, of which 20 species are new records for the whole Gulf of Oman (Table 1). The total number of identified species in this study is nearly 30% of all recorded decapods from the Gulf of Oman and 25% of all recorded decapods from the Iranian side of the Persian Gulf (Naderloo & Türkay, Reference Naderloo and Türkay2012; Naderloo et al., Reference Naderloo, Ebrahimnezhad and Sari2015). In addition, the identified species in this study constitute nearly 40% of all recorded decapod species from the Iranian coast of the Gulf of Oman. Simões et al. (Reference Simões, Apel and Jones2001) recorded 112 species of decapods from different intertidal habitats (e.g. rocky, sandy and muddy) of Socotra Island, Indian Ocean by a general sampling, while in this study 75 species were collected from only a small area of the intertidal rocky habitat. It should be noted that our sampling was very intensive and accurate, demonstrating that when sampling is performed with more focus the results will be better. This also shows that rocky intertidal shores have a great potential to provide and support many suitable niches for decapods compared with other intertidal habitats. Dense assemblages of primary producers (algae) bring together many types of decapods in rocky intertidal shores. The total number of the identified Brachyura in this study constitutes nearly 28% of all the recorded brachyurans from the Gulf of Oman (177 species) and 21% of all the recorded brachyurans from the Persian Gulf (223 species). The Anomura diversity in this study is 47% of the total diversity of this infraorder in the Gulf of Oman (42 species) and 33% of the total diversity of this infraorder in the Persian Gulf (59 species). The infraorder Caridea (caridean shrimps) at the Iranian coast is represented by just 17 species in the Gulf of Oman, but by 27 species in the Persian Gulf (Naderloo & Türkay, Reference Naderloo and Türkay2012; Naderloo et al., Reference Naderloo, Ebrahimnezhad and Sari2015). In this study, five species of Caridea are identified (Table 1). Two species of ghost shrimps were the only representatives of Axiidea, representing the least species-rich infraorder in this study. The diversity of Caridea and Axiidea in both the Persian Gulf and the Gulf of Oman are underestimated, mainly because of insufficient sampling. The species diversity among the infraorders is congruent with worldwide results (Simões et al., Reference Simões, Apel and Jones2001; Ng et al., Reference Ng, Guinot and Davie2008; De Grave et al., Reference De Grave, Pentcheff, Ahyong, Chan, Crandall and Dworschak2009) and regional (Naderloo & Türkay, Reference Naderloo and Türkay2012; Naderloo et al., Reference Naderloo, Türkay and Sari2013, Reference Naderloo, Ebrahimnezhad and Sari2015) studies. The four genera Petrolisthes, Thalamita, Menaethiops and Pilumnus are the most species-rich genera, covering nearly 25% (18 species) of the total identified species. The ratio of the number of genera to the number of species (G/S: the greater this ratio the higher the taxonomic diversity) in this study is 0.64, while these ratios in the Gulf of Oman and the Persian Gulf are 0.51 and 0.61, respectively. Among families that had more than five species in this study, the highest value of G/S goes to Xanthidae (8/11), followed by Pilumnidae (2/3), Portunidae (2/7) and Porcellanidae (3/11). Based on both the total species number and G/S, Xanthidae was the most diverse family in this study – 87% of total identified species (65 of 75) had been reported from the Persian Gulf. This high percentage of similarity in decapod assemblage confirms the finding of Sheppard & Sheppard (Reference Sheppard, Sheppard, Buttiker and Krupp1991) and Sheppard et al. (Reference Sheppard, Price and Roberts1992) that ‘despite environmental and coastal ecosystem composition differences, there are broad similarities in benthic community structure between the Persian Gulf and Gulf of Oman’. Compared with the Persian Gulf, some groups of decapods such as Stenopodidea (shrimp-like decapods) and Upogebiidae (mud shrimps) have not been previously recorded from the Gulf of Oman, probably because of insufficient sampling at the Gulf of Oman, which warrants more careful sampling.
Zonation of decapod crustaceans
Intertidal organisms continuously interact with abiotic and biotic factors (Whitlatch, Reference Whitlatch1981; Jones & Shulman, Reference Jones and Shulman2008; Robles et al., Reference Robles, Desharnais, Garza, Donahue and Martinez2009; Tapia et al., Reference Tapia, DiBacco, Jarrett and Pineda2010; Fly et al., Reference Fly, Monaco, Pincebourde and Tullis2012). These factors play important roles in pre- and post-settlement events in intertidal environments for most organisms, consequently determining their cross-shore distributions (zonation) and community structures. Generally, the species' ability to overcome non-biological hindrance (e.g. desiccation) determines their upper limit, whereas the lower limit is set by biological factors such as competition and predation (Connell, Reference Connell1961; Underwood & Jernakoff, Reference Underwood and Jernakoff1981; Raffaelli & Hawkins, Reference Raffaelli and Hawkins1999; Chavanich & Wilson, Reference Chavanich and Wilson2000). This is particularly true for sessile organisms (e.g. barnacles, algae, mussels) (Reichert et al., Reference Reichert, Buchholz and Giménez2008; Taheri & Foshtomi, Reference Taheri and Foshtomi2009; Tapia et al., Reference Tapia, DiBacco, Jarrett and Pineda2010), and only a few (especially quantitative) studies have been performed on motile organisms, such as decapod crustaceans (Jensen & Armstrong, Reference Jensen and Armstrong1991; Pohle et al., Reference Pohle, Iken, Clarke, Trott, Konar, Cruz-Motta, Wong, Benedetti-Cecchi, Mead and Miloslavich2011; Naderloo et al., Reference Naderloo, Türkay and Sari2013). On shores with a low slope, similar to this study, zonation is not clearly seen and is not apparent at first glance, but our quantitative sampling proves that there are nearly clear-cut zones forming the community of decapod crustaceans. Coenobita scaevola, as a semi-terrestrial hermit crab and an active nocturnal scavenger, is a transient inhabitant of the supralittoral. It is a species resistant/well-adapted to dehydration that can travel far and wide (50 m or even a few kilometres from the high water mark) (Achituv & Ziskind, Reference Achituv and Ziskind1985; Moradmand & Sari, Reference Moradmand and Sari2007; personal observation). The changes in abundance of S. crabricauda can be linked to the life cycle of this small deposit-feeding species. The lowest abundance for S. crabricauda was obtained during NEM, concurrent with the algal bloom in the intertidal. The ghost crab Ocypode rotundata occurred frequently near the lower fringe of the supralittoral zone, but occasionally we observed it entering the rocky part of transects, mainly for feeding. The higher number of ghost crab burrow openings during the first sampling possibly was related to their main breeding season happening during summer, which was reflected by conical towers constructed by adult males.
Most intertidal animals are basically marine (Raffaelli & Hawkins, Reference Raffaelli and Hawkins1999; Knox, Reference Knox2000), thus it is rational to assume that species diversity and abundance increases from high- to low-intertidal zones. Decapod crustaceans were most diverse and abundant in the mid-intertidal zone (Figure 3B). The low-intertidal zone can act as a biological and physical buffering structure against the waves coming from the sea, so the wave action in the mid-intertidal zone is diminished when compared with the low-intertidal. Large biological elements such as algae, corals and sponges can be considered as main contributors of the habitat structure in the low-intertidal. On the other hand, the mid-intertidal in comparison to the high-intertidal exerts less desiccation stress on its decapod community. Hence we assume that high predation in the low-intertidal (herein showing the lowest value in evenness) forced some decapods to migrate towards the mid-intertidal or the shallow subtidal.
On the basis of the similarity dendrogram, it can be concluded that decapods segregate into two main parts, the upper and lower intertidal. The mid-intertidal zones in this dendrogram have been nested equally between these two major zones (Figure 6), but based on SIMPER, the mid-intertidal zone has more dissimilarity (%) with the high-intertidal (35.37) than the low-intertidal (28.63) (Table A3). It is worth mentioning because the high-intertidal zone is under more physical stress, its communities are generally more spaced apart (Raffaelli & Hawkins, Reference Raffaelli and Hawkins1999), so, compared with mid- and low-intertidal zones it needs more sampling effort in order to achieve sufficient samples representing its community (Figure A3B). Higher abundance of Alpheus lobidens (Caridea), Petrolisthes leptocheles and Petrolisthes ornatus (Paul'son, 1875) (Porcellanidae) is the main difference between high- and mid-intertidal zones (Table A3). Two other species of porcelain crabs Pachycheles natalensis, Pachycheles tomentosus (Henderson, 1893) and one true crab Zozymodes xanthoides were more numerous in the low-intertidal than the mid-intertidal zone. The PCA analysis was conclusive in identifying three almost distinct decapod communities corresponding with the high-, mid- and low-intertidal zones, and the mid-intertidal zone has more overlap with the high-intertidal than with the low-intertidal zone (Figures 6A). Some species showed no overlap, while others showed an overlapping vertical distribution. In a non-overlapping distribution, the respective species are only found in one of three zones, presumably due to specific biological and non-biological factors limiting their spreading to other zones. Sixteen species (Figure 7B) are only found in the low-intertidal zone. It seems that these species are extremely sensitive to thermal stress during aerial exposure, as decreased periods of submergence at higher shore level can have deleterious physiological effects on them (Turra & Denadai, Reference Turra and Denadai2001). Five species are exclusively found in the mid-intertidal zone (Figure 7B) and it seems they show higher heat tolerance than some species of the low-intertidal zone. One brachyuran crab Grapsus granulosus (H. Milne Edwards, 1853) has the highest correlation with the high-intertidal zone (Figure 7B). Desiccation is one of the most important factors in the distribution of intertidal organisms but much less of a risk to mobile organisms that can quickly change locations and seek out water if necessary. Four species of brachyurans, namely G. granulosus, Metopograpsus messor (Forskål, 1775), Epixanthus frontalis (H. Milne Edwards, 1834) and Menippe rumphii (Fabricius, 1798) better correlate with the high-intertidal zone than other species (Figure 7B). Grant & McDonald (Reference Grant and McDonald1979) showed that desiccation tolerance has an exponential relationship with body size, shown by the example of the brachyuran crab Eurypanopeus depressus Smith, 1869, which restricts its distribution to the intertidal region. Eighteen species were found in all three defined zones (Figure 7B). These species are among the most abundant species of Caridea and Anomura; they are less mobile, but mostly live beneath stones and rocks, easily tackling the stresses in the whole intertidal zone. The remaining 16 species were found in two of the three defined zones (Figure 7B) and have second rank in overlapping distribution pattern in comparison with 18 species that were present in all three zones.
Seasonal fluctuations
Generally, in marine ecosystems experiencing low level of environmental stresses the macrofaunal community structures are related to biotic factors such as reproduction activities, predator pressure, food availability, competition and biological habitat modifications (Mistri et al., Reference Mistri, Fano, Ghion and Rossi2002; Kevrekidis, Reference Kevrekidis2005). However, in the northern Indian Ocean, communities are also related to the monsoon seasons (Nybakken & Bertness, Reference Nybakken and Bertness2004). The communities of the rocky intertidal habitat face different kinds of stresses, which may be abiotic (Gregory et al., Reference Gregory, Campbell, Primo and Hewitt2012), biotic (Hidalgo et al., Reference Hidalgo, Silliman, Bazterrica and Bertness2007) or a combination of these (Thompson et al., Reference Thompson, Crowe and Hawkins2002). Rocky intertidal habitats are less vulnerable than many other intertidal habitats due to their hard substratum and open nature as well as their scarcity of large biogenic structures. They are also remarkably resilient and recovery can occur rapidly due to recruitment from unaffected areas (Thompson et al., Reference Thompson, Crowe and Hawkins2002). The monsoon as an eminent hydrological feature in the western Indian Ocean can determine distribution of some intertidal and shallow subtidal animals, as shown in barnacles and lobsters (Ardalan et al., Reference Ardalan, Sari, Rezvani-Gilkolaei and Pourkazemi2010; Tsang et al., Reference Tsang, Achituv, Chu and Chan2012). In a smaller, local scale, some researchers found that the lowest species diversity and abundance of the intertidal fauna in the northern coast of the Arabian Sea and Gulf of Oman occurred during the SWM (Harkantra & Parulekar, Reference Harkantra and Parulekar1985; Nikouyan & Savari, Reference Nikouyan and Savari1999; Ibrahim et al., Reference Ibrahim, Hussin, Kassim, Joni, Zakaria and Hajisamae2006; Taheri & Foshtomi, Reference Taheri and Foshtomi2009).
In our study, the total individuals, mean species diversity (also Shannon index) and abundance of decapods in SWM were the lowest among the sampling (Figures 3A, A2A). During SWM, strong winds over the sea bring rough, smashing waves into intertidal habitats (wave stress or shock). Also, offshore surface waters mix with near-shore and result in more uniformity of seawater properties, lower salinity, higher values in DO and OSP (Table A2). Interaction between wave exposure and particle size is possibly the main process in shaping the biological characteristics of the rocky shores (Raffaelli & Hawkins, Reference Raffaelli and Hawkins1999). Harsh wave action during SWM increases the amount of coastal erosion, uplift sediments mostly resulting from erosion of subtidal limestone and dead corals and shells. The suspended sediment can smother rocky shores, functioning as a short-lived stress (sediment stress). The sedimentation in rocky coasts has a direct or indirect deleterious effects on feeding, breathing, settlement and recruitment and other vital behaviours of intertidal organisms (Chapman et al., Reference Chapman, Albrecht and Fletcher2002; Airoldi, Reference Airoldi, Atkinson and Gibson2003; Shives & Dunbar, Reference Shives and Dunbar2010). Furthermore, strong wave action in rocky shores will lead to increasing dislodgement of intertidal algae and stuck animals (e.g. limpets and other gastropods). It seems that wave and sediment stresses are major causes of lower abundance and diversity of decapods in SWM. In contrast, the highest total individuals, abundance, species richness (Margalef index) and diversity (Shannon index) of decapod crustaceans were obtained during NEM. The NEM occurs in the winter season, which is more favourable for intertidal organisms than SWM at least in two aspects: (1) lower water and air temperatures (Table A2; Figure A2) stimulate different algal growth in the intertidal and can provide a great shelter and food source (primary and secondary) for decapod crustaceans and (2) less harsh conditions of the sea in NEM, meaning lower wave and sediment stress on intertidal communities. It was shown herein, that higher diversity of decapods and greater abundance of some species in NEM led to the lowest value of evenness (Figure 5A). In this situation, decapod species’ abundances were not close together and the community experienced less homogeneity but more diversity in assemblage. The community structure of decapods in FIM was in a recovery or transitional status to reach its highest value in diversity and abundance in NEM.
The third transect is longer and less sloped than the other transects (Table A1), promoting higher diversity and abundance (Figure 5C). More length provides more area and more potential microhabitats (ecological corners or niches) for the presence of different decapods, while the flatter transects slope enhances decapod species' capabilities of displacement in the intertidal zone for different purposes. At a gentler slope, the water level will change slowly, especially during withdrawal. This delay or lag in water withdrawing every day softens environmental changes at the intertidal and imposes less stress upon living communities. The critical tidal level is a zone in which the duration of annual continuous exposure or submergence of intertidal areas changes sharply. The critical tidal level will be wider at gentler-sloped areas, resulting in an increased ability of the animals to vertically move through the intertidal, particularly in its upper part. Crevices and holes under rocks are safe places for the animals and act as a nearly permanent place to withstand environmental changes such as temperature fluctuations. Less than 3% of squares had no samples (‘zero' squares) and all of them were located in the upper intertidal zone. Dissimilarity between the first and third samplings was highest (36.02%), mainly caused by the presence of M. voeltzkowi in the third sampling (and absence of it in the first sampling) and higher abundances of Petrolisthes leptocheles and P. natalensis in the third sampling (Table A3). The factor of pH in comparison with other environmental factors played a more significant role, whereas DO was shown to have the least influence on the decapods community (Figure 9). The PCA shows that pH has a higher contribution in shaping the decapod community than other environmental factors in the fourth sampling (Figure 9). In NEM, highest species numbers (43 species) were associated with salinity, while water and air temperature were main drivers of the decapod community during SWM (Figure 9).
In addition to lower temperatures during NEM in the study area, the occurrence of upwelling in the northern coast of the Gulf of Oman reported by some researchers (Reynolds, Reference Reynolds1993; Johns et al., Reference Johns, Jacobs, Kindle, Murray and Carron1999; Piontkovski et al., Reference Piontkovski, Al-Gheilani, Jupp, Al-Azri and Al-Hashmi2012) may be involved in increasing the diversity and abundance of the intertidal organisms. The upwelling is able to increase the level of nutrients and decrease the water temperature in coastal areas, thus raising the abundance of certain groups such as algal and planktonic communities, which could eventually lead to an increase in primary productivity and strengthen the food chain in intertidal areas (Bosman et al., Reference Bosman, Hockey and Siegfried1987; Ormond & Banaimoon, Reference Ormond and Banaimoon1994; Blanchette et al., Reference Blanchette, Wieters, Broitman, Kinlan and Schiel2009; Reddin et al., Reference Reddin, Docmac, O'Connor, Bothwell and Harrod2015). The decrease of water and air temperature, increasing algal cover (field observations) and OSP was followed by a high decapod community in the winter season (NEM) in comparison with other sampling efforts (Figures 3A, A3). Hence, more oceanographic research is needed to prove the occurrence of upwelling and to determine if this is linked to the observed increase in diversity of intertidal communities.
Further studies should be pursued with a comprehensive approach (including other intertidal biota, i.e. synecology) with long-term registration of environmental factors to evaluate more accurately the effect of the monsoons on intertidal communities in the northern coast of the Gulf of Oman. More taxonomic and ecological research upon decapods (and other crustaceans) of the Gulf of Oman should be pursued, especially using scuba.
Supplementary material
The supplementary material for this article can be found at https://doi.org/10.1017/S0025315418000310.
ACKNOWLEDGEMENTS
This work was a part of a MSc degree in Marine Ecology, carried out at the University of Tehran by the first author, supervised by the second author. We would like to express our indebtedness to the residents of Bandini and Djod Villages, for their warm hospitality during our fieldwork, especially to the families of Mr Rahmdel Ebrahimzehi and Mr Naser Salari. We also appreciate help in the field and laboratory work from our colleagues, in particular, Monire Rabie, Zohre Jalili, Rashed Abdollahi and Mehrnaz Afkhami. We are also greatly appreciate Mark Bertness (Brown University, USA) for his valuable comments on the manuscript. The authors also owe thanks to Dr Hasan Rahimian (University of Tehran, Tehran, Iran) for reading an early version of the manuscript. Special thanks to three anonymous referees who kindly have played a significant role in promoting the presentation of the materials by their instructive comments.
FINANCIAL SUPPORT
The partial financial support from the University of Tehran, Tehran, Iran during the study is greatly appreciated.


