INTRODUCTION
Herbivorous invertebrates are important components of benthic marine ecosystems, as they represent a critical trophic link between primary producers, such as kelps and seagrasses, and higher organisms, including predatory fish and mammals (Estes & Duggins, Reference Estes and Duggins1995; Pace et al., Reference Pace, Cole, Carpenter and Kitchell1999; Bruno & O'Connor, Reference Bruno and O'Connor2005). Some invertebrate herbivores have a disproportionately high influence on local patterns of community structure and biodiversity, thereby acting as ecosystem engineers (sensu Jones et al., Reference Jones, Lawton and Shachak1994). Overgrazing by sea urchins, in particular, can cause phase-shifts from biologically diverse and complex macroalgae-dominated habitats towards low diversity habitats characterized by urchin ‘barrens’ (Andrew, Reference Andrew1993; Estes & Duggins, Reference Estes and Duggins1995; Leinaas & Christie, Reference Leinaas and Christie1996; Steneck et al., Reference Steneck, Graham, Bourque, Corbett, Erlandson, Estes and Tegner2002). Overgrazing by high densities of urchins can occur following sporadic intense recruitment events (e.g. Hart & Scheibling, Reference Hart and Scheibling1988; Valentine & Edgar, Reference Valentine and Edgar2010), or as a result of overexploitation of urchin predators, leading to elevated grazing pressure through trophic cascade effects (reviewed by Jackson et al., Reference Jackson, Kirby, Berger, Bjorndal, Botsford, Bourque, Bradbury, Cooke, Erlandson, Estes, Hughes, Kidwell, Lange, Lenihan, Pandolfi, Peterson, Steneck, Tegner and Warner2001; Steneck et al., Reference Steneck, Graham, Bourque, Corbett, Erlandson, Estes and Tegner2002). In Tasmania, for example, urchin recruitment has increased in response to recent changes in ocean climate, and concurrent overfishing of urchin predators has allowed the urchin population to expand unchecked (Ling, Reference Ling2008; Ling et al., Reference Ling, Johnson, Frusher and Ridgway2009). Recent decimation of kelp forests, resulting in a loss of habitat complexity and diversity, has been attributed to elevated grazing pressure from sea urchins.
In contrast, many species of sea urchin are largely sedentary and, generally, do not actively graze benthic macrophytes. When the supply of unattached ‘drift’ algae is sufficient, these urchins remain sedentary and collect and feed on detrital material (e.g. Vanderklift & Kendrick, Reference Vanderklift and Kendrick2005). In wave-exposed habitats, for example, kelps and other large macroalgae are frequently dislodged from rocky reefs and transported up to many kilometres, before being consumed as detritus by sea urchins (Vanderklift & Kendrick, Reference Vanderklift and Kendrick2005; Vanderklift & Wernberg, Reference Vanderklift and Wernberg2008). By consuming algal detritus, sea urchins provide an important service in terms of energy flow, trophic linkages and nutrient cycling (Vanderklift & Wernberg, Reference Vanderklift and Wernberg2010). Some urchin species exhibit plasticity in their feeding strategy, by acting as detritivores when drift algae is plentiful and reverting to direct grazing when the supply of detritus is insufficient, because of either reduced drift algae supply or increased urchin density (Kenner, Reference Kenner1992; Livore & Connell, Reference Livore and Connell2012a). Whether active grazers, drift feeders, or both, sea urchins are key benthic organisms and documenting population structure and condition is crucial for understanding wider ecosystem structure and functioning.
The benthic ecosystem off south-west Australia represents a global hotspot of biodiversity and endemism for marine macroalgae (Phillips, Reference Phillips2001; Kerswell, Reference Kerswell2006) and also supports rich assemblages of sessile invertebrates (Hatcher, Reference Hatcher1989) and demersal fish (Fox & Beckley, Reference Fox and Beckley2005; Langlois et al., Reference Langlois, Radford, Van Niel, Meeuwig, Pearce, Rousseaux, Kendrick and Harvey2012). Extensive subtidal limestone and granite reef habitats fringe the south-west Australian coastline, which support dense kelp beds in the shallows and rich assemblages of macroalgae and invertebrates in deeper water (Smale et al., Reference Smale, Kendrick, Waddington, Van Niel, Meeuwig and Harvey2010a, Reference Smale, Kendrick and Wernbergb). Mature reef assemblages exhibit high species richness and turnover (Kendrick et al., Reference Kendrick, Lavery and Phillips1999; Wernberg & Goldberg, Reference Wernberg and Goldberg2008), while biodiversity patterns shift predictably along a regional-scale temperature gradient (Wernberg et al., Reference Wernberg, Kendrick and Phillips2003; Smale et al., Reference Smale, Kendrick and Wernberg2010b; Tuya et al., Reference Tuya, Wernberg and Thomsen2011), albeit with pronounced small-scale variability (Phillips et al., Reference Phillips, Kendrick and Lavery1997; Tuya et al., Reference Tuya, Wernberg and Thomsen2009; Smale et al., Reference Smale, Kendrick and Wernberg2010b).
Conspicuous mobile macro-invertebrates such as echinoderms and large molluscs are, however, fairly low in diversity and abundance in south-west Australian kelp forests compared with many other temperate and polar ecosystems, and exhibit highly patchy distributions (Vanderklift & Kendrick, Reference Vanderklift and Kendrick2004; Wernberg et al., Reference Wernberg, White and Vanderklift2008; Azzarello et al., Reference Azzarello, Smale, Langlois and Håkansson2013). The most abundant sea urchin in the region is the purple sea urchin Heliocidaris erythrogramma (Valenciennes, 1846), which is widely distributed across temperate Australia. Heliocidaris erythrogramma is primarily a drift-feeder, preferentially consuming detrital fragments of the kelp Ecklonia radiata (Vanderklift & Kendrick, Reference Vanderklift and Kendrick2005; Vanderklift & Wernberg, Reference Vanderklift and Wernberg2010). Previous removal experiments have shown that H. erythrogramma has minimal influence on the structure of proximal benthic assemblages (Valentine & Johnson, Reference Valentine and Johnson2005; Vanderklift & Kendrick, Reference Vanderklift and Kendrick2005). However, other manipulative and observational studies have shown that at medium to high densities of H. erythrogramma, as often found within wave-sheltered locations, can restrict the development of macroalgal canopies and facilitate the persistence of urchin ‘barrens’ (Wright et al., Reference Wright, Dworjanyn, Rogers, Steinberg, Williamson and Poore2005; Ling et al., Reference Ling, Ibbott and Sanderson2010; Livore & Connell, Reference Livore and Connell2012b). On exposed subtidal reefs off southern and western Australia, H. erythrogramma densities are generally assumed to be too low to exert control over macroalgae assemblage development (Connell & Irving, Reference Connell and Irving2008).
In south-west Australia, only one previous study has examined abundance distribution patterns of H. erythrogramma at large spatial scales (Vanderklift & Kendrick, Reference Vanderklift and Kendrick2004), and very little is known about population size structure and condition along the latitudinal temperature gradient that defines the ecology of the region (Smale & Wernberg, Reference Smale and Wernberg2009). Moreover, recent work by Binks et al. (Reference Binks, Evans, Kennington and Prince2011) has identified two morphologically distinct subspecies of H. erythrogramma in south-west Australia, but their relative abundances and habitat preferences remain largely unknown. We examined population structure of H. erythrogramma along >500 km of coastline, encompassing a 1.5°C temperature gradient, to address these knowledge gaps.
MATERIALS AND METHODS
Study region
The purple sea urchin Heliocidaris erythrogramma was examined at three locations off south-west Australia; Hamelin Bay (34.2°S 115.0°E), Marmion Lagoon (31.8°S 115.7°E) and Jurien Bay (30.2S 115.0°E). Adjacent locations were situated >200 km apart (Figure 1) and the study encompassed ~530 km of south-west Australian coastline (south-east Indian Ocean). At each location, six comparable study sites were selected >1 km apart from one another. All study sites were at 8–13 m depth, and were dominated by extensive limestone reef habitats that comprised both flat reef platforms (hereafter ‘flats’) and complex topographical features such as rocky ledges, lumps and overhangs (hereafter ‘slopes’).

Fig. 1. Map of south-west Australia indicating the Jurien Bay (JB), Marmion Lagoon (ML) and Hamelin Bay (HB) study locations. The region is characterized by a well-defined oceanic temperature gradient, represented here by average winter isotherms (in °C, 2005–2007).
All locations were moderately exposed to the considerable oceanic swell systems that influence the ecology and geomorphology of the region (Searle & Semeniuk, Reference Searle and Semeniuk1985; Smale et al., Reference Smale, Wernberg and Vance2011). In 2010, the average wave height recorded at wave buoys offshore from the study locations was ~2 m, with maximum wave heights exceeding 6 m (Bosserelle et al., Reference Bosserelle, Pattiaratchi and Haigh2012). All study sites were partially protected by offshore islands and submerged reefs which—to some extent—dissipate wave energy (Smale et al., Reference Smale, Wernberg and Vance2011). These locations encompass a temperature gradient of ~1.5°C and fall within a larger regional-scale oceanic temperature gradient that defines the west coast of Australia (see Smale & Wernberg, Reference Smale and Wernberg2009, for detailed climatology of the region). This coastline is strongly influenced by the Leeuwin Current (LC), which originates in the Indo-Pacific and flows polewards along the coast of Western Australia, before deviating eastwards into the Great Australian Bight (Pearce, Reference Pearce1991; Smith et al., Reference Smith, Huyer, Godfrey and Church1991). The LC transports tropical (and subtropical) dispersal stages and warm, nutrient-poor water polewards, which enhances north to south mixing of species and effectively raises winter water temperatures (Ayvazian & Hyndes, Reference Ayvazian and Hyndes1995; Caputi et al., Reference Caputi, Fletcher, Pearce and Chubb1996; Smale & Wernberg, Reference Smale and Wernberg2009). The coastal waters off Western Australia are considered oligotrophic, although localized nutrient enrichment can occur (Pearce, Reference Pearce1991; Lourey et al., Reference Lourey, Dunn and Waring2006).
Field surveys
At each of the six sites within each location, two distinct habitat types were surveyed; (1) reef ‘flats’, which were flat or gently sloping sections of open reef platforms; and (2) reef ‘slopes’, which were steeply sloping to vertical rock faces that often included ledges and cracks (surveys were conducted at the base of the slopes). All H. erythrogramma individuals within a 5 × 1 m belt transect were counted using SCUBA (the same observer completed all transects), and five replicate transects were conducted within each habitat type at each site. Transects were positioned haphazardly and placed >5 m apart from one another. Surveys were completed in February 2013 (austral summer).
Sea urchin metrics
Specimens of H. erythrogramma were collected and returned to the laboratory for further analysis. Urchins were collected from reef slopes at four survey sites at Marmion Lagoon and Jurien Bay and from three sites at Hamelin Bay. At each site 10 urchins were collected, except for Marmion sites 1 (8 urchins) and 2 (9 urchins). Only adults were collected (test diameter ranged from 40 to 96 mm), and urchins were selected randomly to provide a representative sample of the adult population at each site. We obtained size–frequency data by measuring the test diameter of each urchin. The gonad index (a measure of urchin condition) was calculated as the percentage of an individual's total weight (blot dried) that was gonad (urchins were dissected, gonads were carefully extracted and then blot dried before weighing, as per Livore & Connell (Reference Livore and Connell2012a)). Research from the east coast of Australia has shown that the gonad index of H. erythrogramma remains relatively constant throughout the year, and the timing of collection here would likely have corresponded to the summer spawning period (Laegdsgaard et al., Reference Laegdsgaard, Byrne and Anderson1991). Furthermore, we used the morphological characteristics described by Binks et al. (Reference Binks, Evans, Kennington and Prince2011) to assign each urchin to one of the two distinct subspecies found in the region, H. e. erythrogramma and H. e. armigera. Specifically, urchins with a red dermis and wide, relatively blunt, violet/violet–green coloured spines were classified as H. e. armigera, while urchins with a white dermis and pointed green spines were classified as H. e. erythrogramma (Binks et al., Reference Binks, Evans, Kennington and Prince2011).
Statistical analysis
Variability in the abundance of H. erythrogramma was examined with permutational analysis of variance (hereafter ‘permutational ANOVA’; see Anderson, Reference Anderson2001) using the PERMANOVA add-on to PRIMER 6.0 (Clarke & Warwick, Reference Clarke and Warwick2001). A three-factor model including location (fixed factor), site (random factor, nested within location) and habitat type (reef flat vs slope, fixed factor) was used to partition variability in urchin abundance. As H. erythrogramma density may be influenced by wave action (Ling et al., Reference Ling, Ibbott and Sanderson2010; Livore & Connell, Reference Livore and Connell2012a), sites within each location were ranked by wave exposure. Estimates of effective fetch were generated by measuring the distance from each study site to an obstruction that offered protection from wave action (i.e. an island, skerrie or submerged reef <5 m in depth, or the mainland). Distances (to a maximum of 20 km) were calculated for every 15° of the compass rosette, generating 24 measurements per site, then averaged to allow ranking of sites within each location (see Ruuskanen et al., Reference Ruuskanen, Bäck and Reitalu1999 for a similar approach). Relative wave exposure was then included in the model as a covariate. Permutations were based on a similarity matrix generated from Euclidian distances of untransformed abundance data (4999 permutations under a reduced model). As a significant interaction between habitat type and site was detected, further permutational ANOVAs were conducted on abundance data from each habitat type separately. Here, a two-factor model using location (fixed factor) and site (random factor, nested within location) was employed and permutations were based on two separate similarity matrices generated for both reef ‘flats’ and reef ‘slopes’.
For the urchin metrics, test diameters were used to generate size–frequency histograms for each location. Differences in urchin gonad index between sites and locations were visualized by plotting mean values for each site (±SE). Spatial patterns in the abundance of each subspecies were visualized by plotting relative abundances for each site. A two-factor permutational ANOVA (with ‘Location’ as a fixed factor and ‘Site’ as a random, nested factor) was used to examine spatial variability in urchin size, gonad index and subspecies relative abundance (based on Euclidian distances and 4999 permutations under a reduced model).
RESULTS
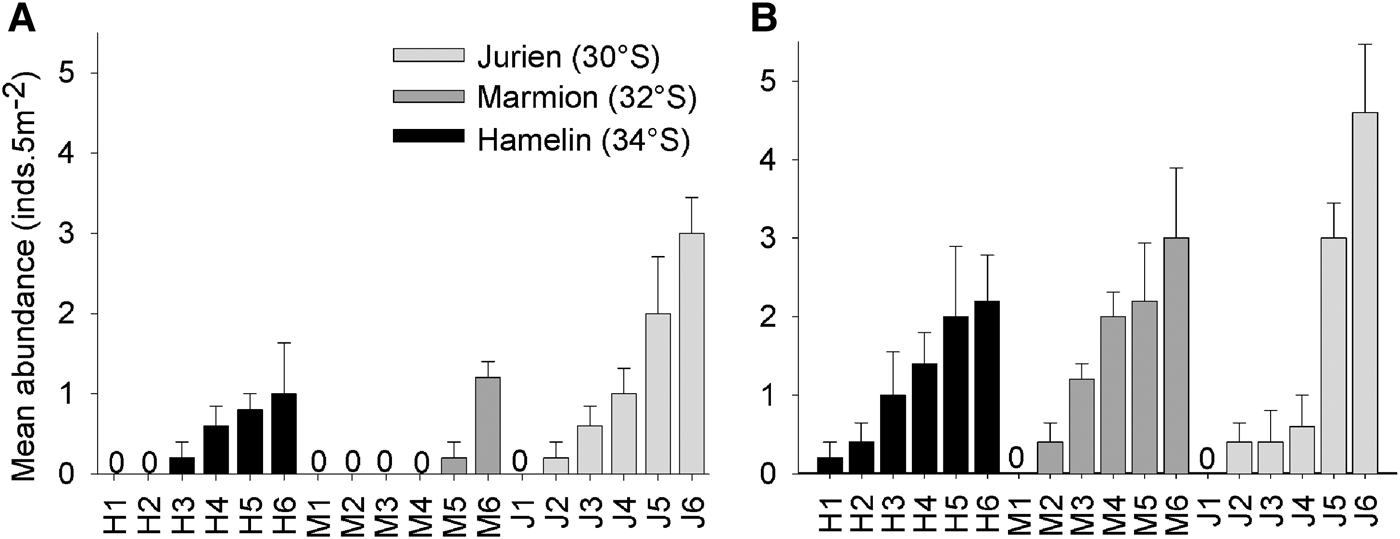
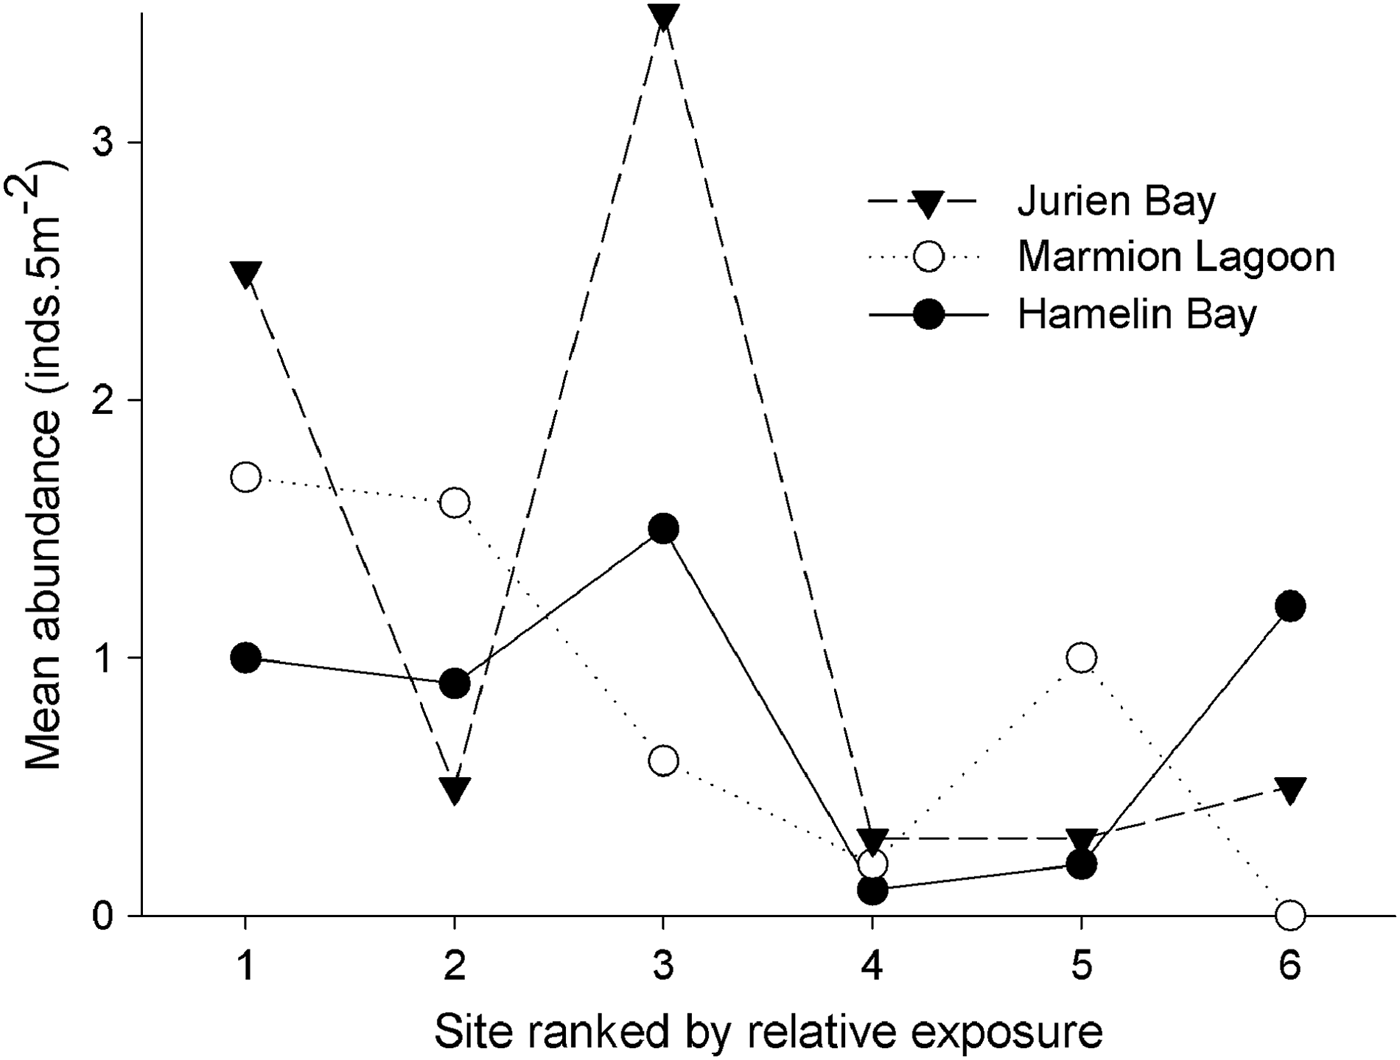
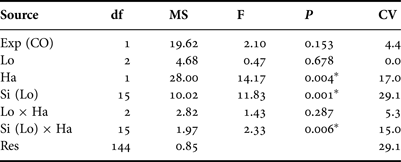
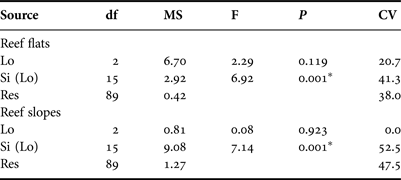
Abundance patterns of Heliocidaris erythrogramma on subtidal rocky reefs off south-west Australia exhibited high spatial variability, and ranged from 0 to 8 inds 5m-2. Urchin densities were higher on reef slopes than reef flats, and were highly variable between sites but not locations (Figure 2; Table 1). As permutational ANOVA detected a highly significant Site × Habitat interaction (Table 1), variability patterns for each habitat type were examined separately. This showed that the relative magnitude of site-level variability was greater for reef slopes compared with reef flats (Figure 2; Table 2). For both the ‘global’ permutational ANOVA (Table 1) and the within-habitat permutational ANOVA (Table 2), variability between sites was the major contributor to total variability, as shown by the estimates of components of variation. Within each location, urchin abundances were highly variable along the wave exposure gradient and did not alter predictably between sites (Figure 3). This was shown statistically in the global model, as relative wave exposure was not a significant covariable (Table 1).

Fig. 2. Mean abundance (±SE) of Heliocidaris erthyrogramma at each of six sites within the three study locations in temperate Western Australia. Abundances are means of five replicate transects (5 m−2) for both habitat types, reef flats (A) and reef slopes (B).

Fig. 3. Mean abundance of Heliocidaris erthyrogramma at each of six sites within the three study locations in temperate Western Australia. Sites within each location are ranked by their relative exposure to wave action. Abundances are means of 10 replicate transects (5 m−2) per site (reef flats and slopes pooled).
Table 1. Results of permutational ANOVA to test for differences in the abundance of Heliocidaris erythrogramma between locations (‘Lo’, fixed factor), sites (‘Si’, random factor, nested within location) and habitat type (‘Ha’, reef flat vs slope, fixed factor). Relative wave exposure (‘Exp’) was included in the model as a covariable (CO). Permutations were based on a similarity matrix generated from Euclidian distances of untransformed abundance data (4999 permutations under a reduced model). Significant factors (at P < 0.05) are indicated with an asterisk (*). Percentage contributions of each term to total variability (i.e. estimates of components of variation, ‘CV’) are also shown.

Table 2. Results of permutational ANOVA to test for differences in the abundance of Heliocidaris erythrogramma between locations (‘lo’, fixed factor) and sites (‘si’, random factor, nested within location) within each habitat type separately. Permutations were based on a similarity matrix generated from Euclidian distances of untransformed abundance data (4999 permutations under a reduced model). Significant factors (at P < 0.05) are indicated with an asterisk (*). Percentage contributions of each term to total variability (i.e. estimates of components of variation, ‘CV’) are also shown.

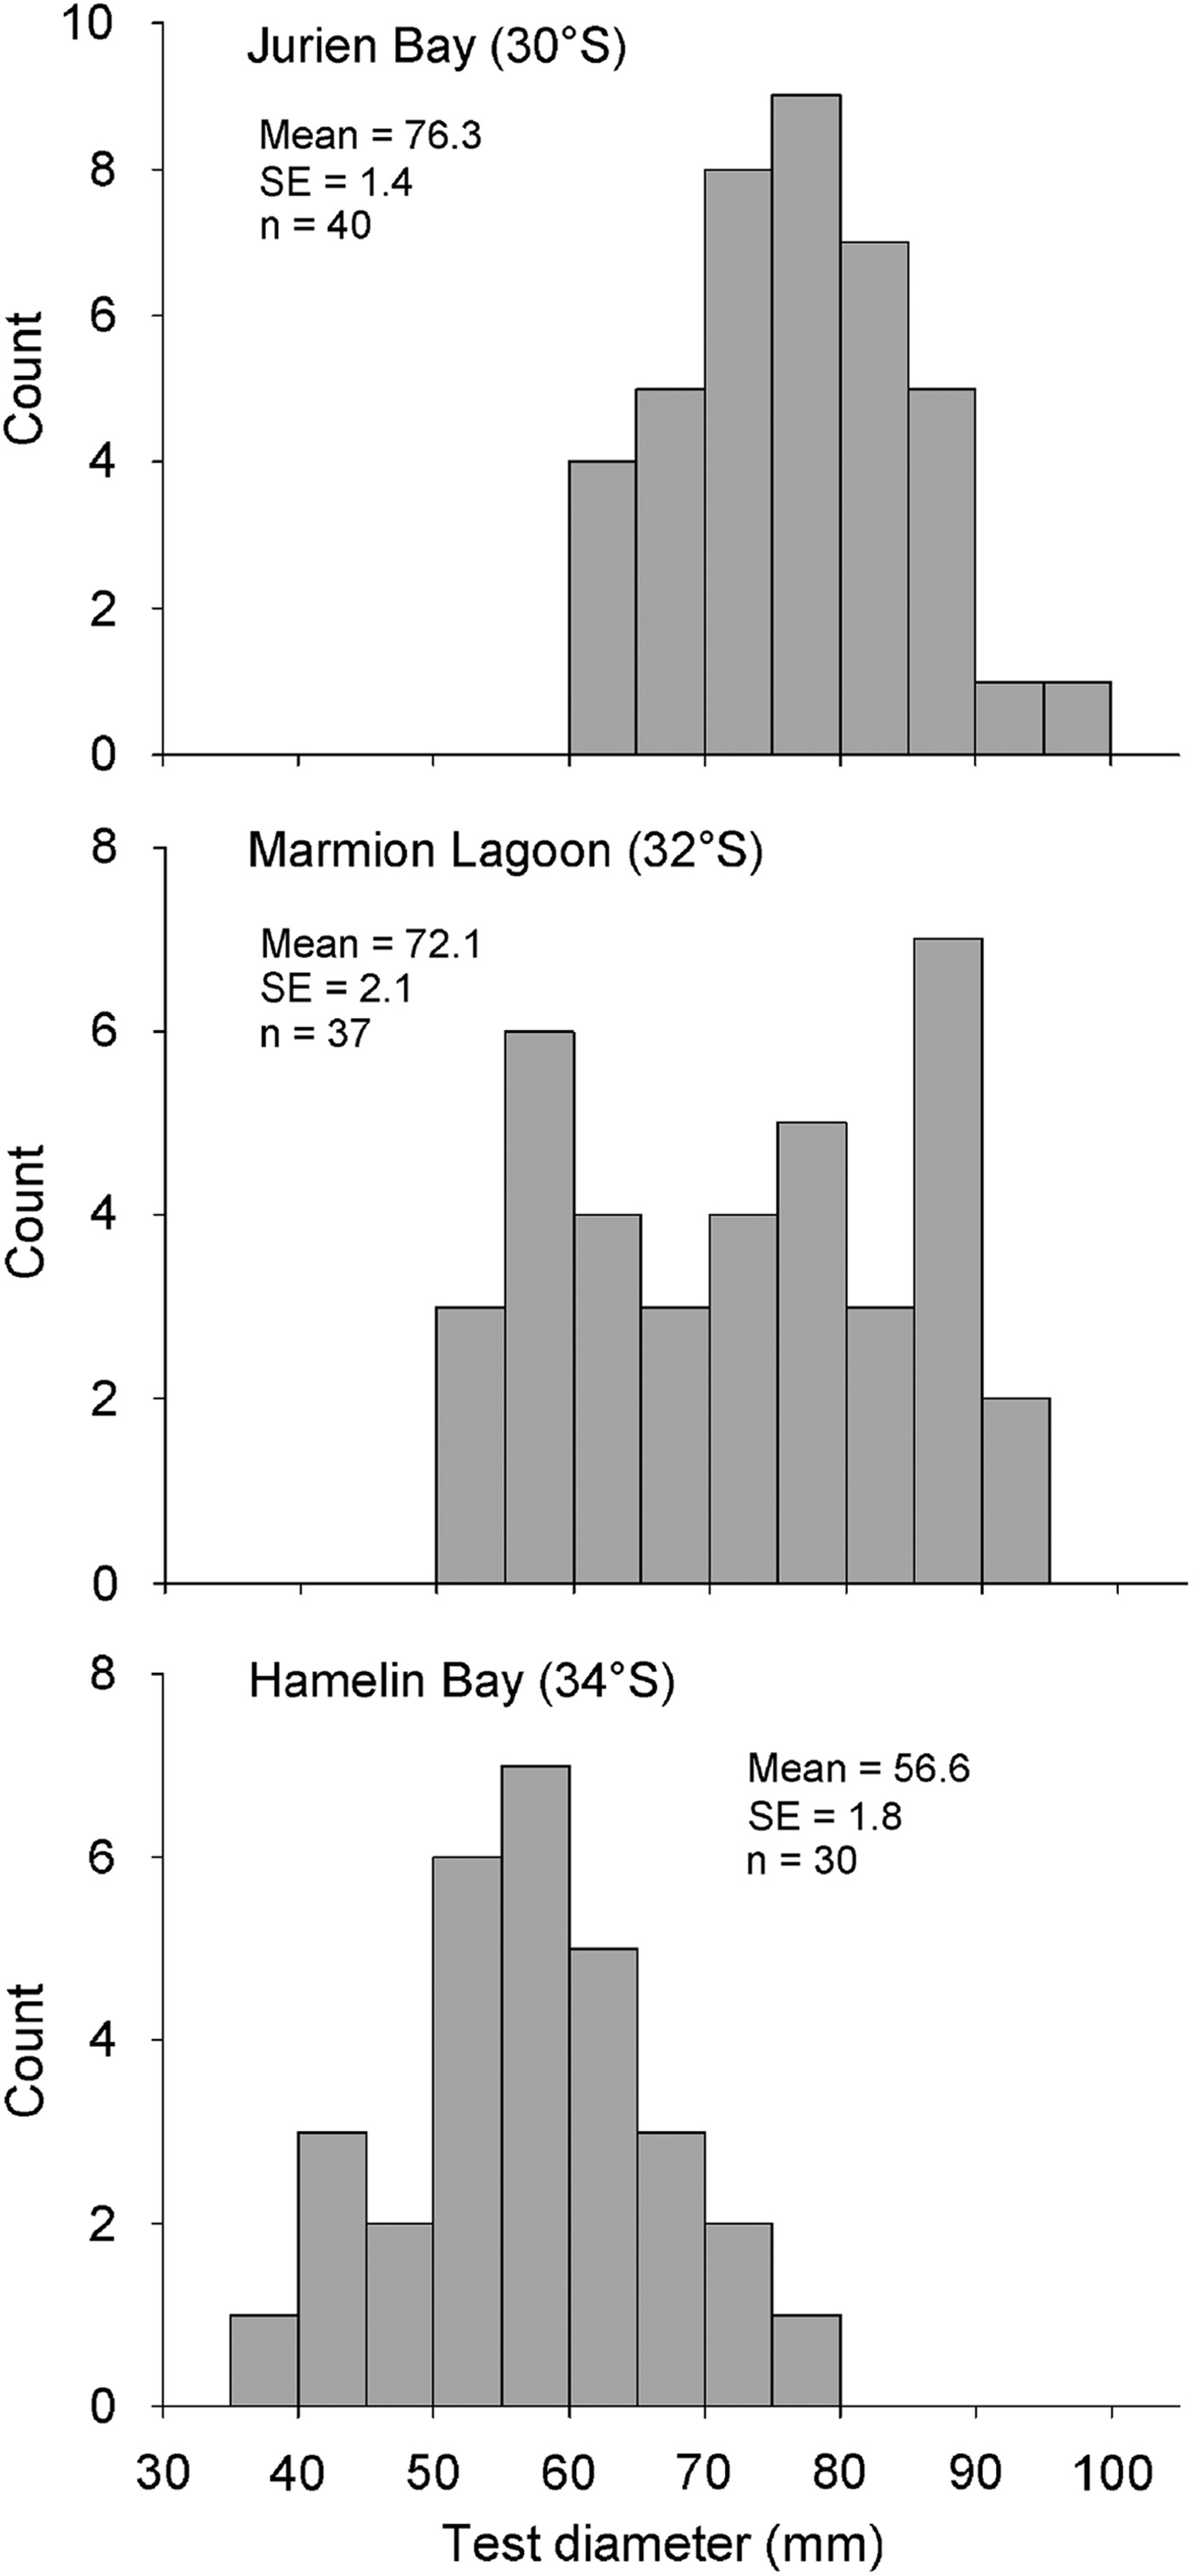
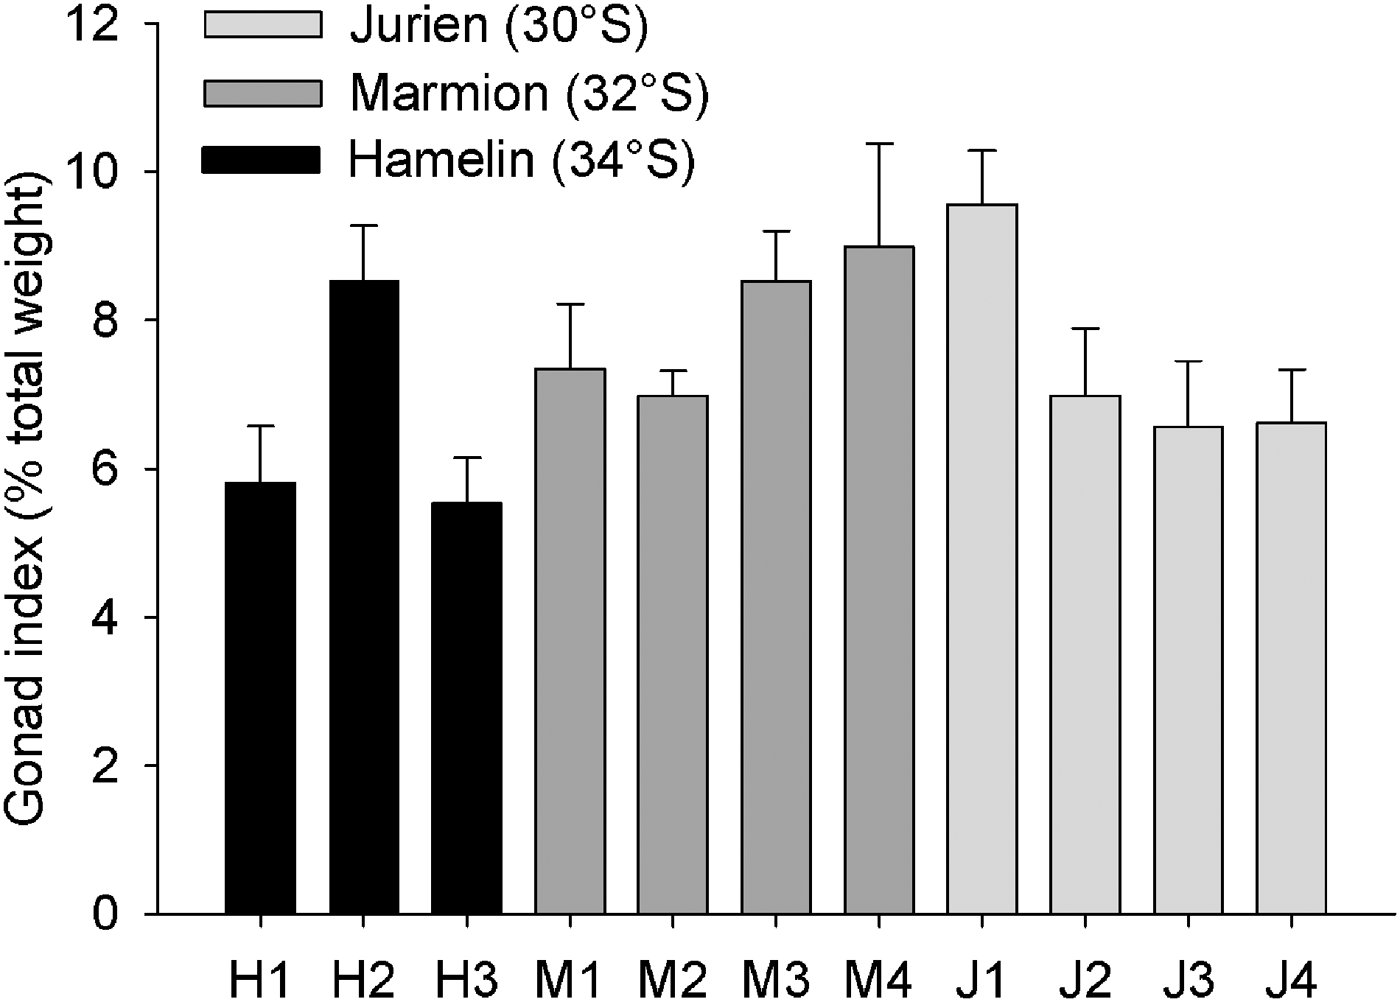
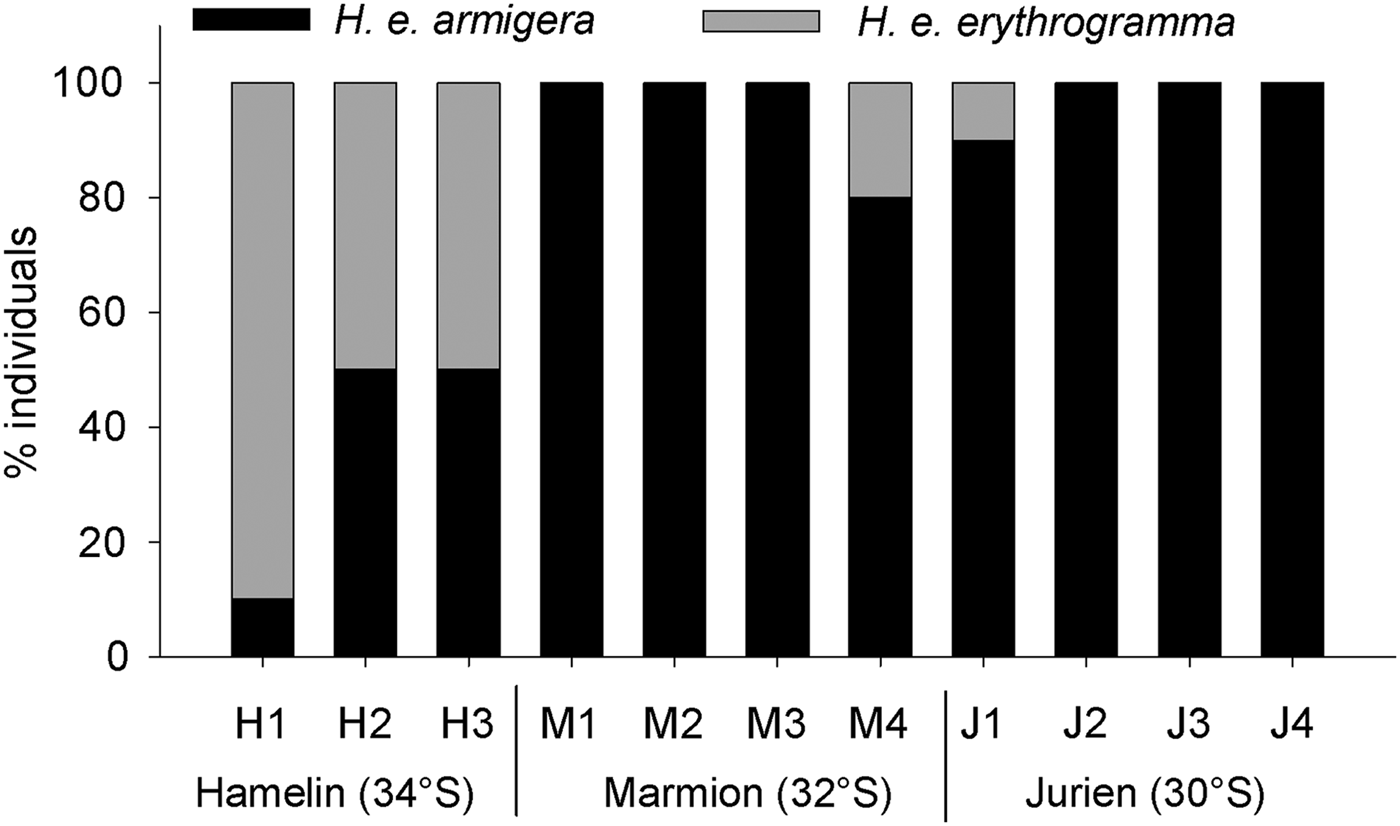
Size–frequency histograms based on test diameter suggested that urchins at the southernmost location, Hamelin Bay, were smaller than at the other locations (Figure 4). This was confirmed by permutational ANOVA, which detected significant variability between both sites (F8,96 = 5.54, P = 0.001) and locations (F2,96 = 7.66, P = 0.017, pairwise tests; JB = ML > HB). Interestingly, size–frequencies were normally distributed at Jurien Bay and Hamelin Bay (Shapiro–Wilk's tests, JB; W = 0.98, P = 0.781, HB; W = 0.98, P = 0.865) but not at Marmion Lagoon (W = 0.93, P = 0.023). The gonad index for each individual ranged from 1.94 to 16.51%; no clear pattern in mean gonad index between locations was observed (Figure 5). Gonad index varied significantly between sites (F8,96 = 2.64, P = 0.013) but not locations (F2,96 = 0.84, P = 0.469). Finally, the abundance of each subspecies did vary between locations, as H. e. erythrogramma was much more abundant at Hamelin Bay compared with the other locations (Figure 6). This observation was supported by permutational ANOVA (F2,96 = 21.39, P = 0.002, pairwise tests; HB > ML = JB), which also detected significant variability at the site level (F8,96 = 2.04, P = 0.05). On average, H. e. erythrogramma was smaller than H. e. armigera (mean test diameter 56.0 ± 1.6 versus 72.7 ± 1.3, n = 22 and 85, respectively) but had similar gonad index values (H. e. erythrogramma = 7.6 ± 0.3, H. e. armigera = 6.4 ± 0.5).

Fig. 4. Size–frequency histograms (5 mm size classes) for each of the three study locations in temperate Western Australia (sites pooled). Mean test diameter (±SE) and total n are shown for each location.

Fig. 5. Mean gonad index (±SE) of Heliocidaris erthyrogramma at each site within the three study locations in temperate Western Australia. Urchins were collected from three sites at Hamelin Bay and four sites at Marmion Lagoon and Jurien Bay. At each site 10 urchins were analysed, with the exception of M1 (8 urchins) and M2 (9 urchins).

Fig. 6. The relative abundances of the two different subspecies of Heliocidaris erthyrogramma found in temperate Western Australia, based on colour variation and spine morphology (see Methods). At each site 10 urchins were analysed, with the exception of M1 (8 urchins) and M2 (9 urchins).
DISCUSSION
Despite being one of the most abundant mobile macroinvertebrates on wave exposed subtidal reefs in south-west Australia (Vanderklift & Kendrick, Reference Vanderklift and Kendrick2004), Heliocidaris erythrogramma abundances were relatively low, at ~0–2 inds m-2. Our abundance values were similar to those recorded by Vanderklift and Kendrick (Reference Vanderklift and Kendrick2004) at corresponding locations, suggesting that there has been negligible change in location-specific abundances over the last ~12 y. Heliocidaris erythrogramma exhibits a highly patchy distribution pattern and can be found in much greater densities at other locations within the bounds of the study region (Vanderklift & Kendrick, Reference Vanderklift and Kendrick2004; Azzarello et al., Reference Azzarello, Smale, Langlois and Håkansson2013). Heliocidaris erythrogramma inhabited both reef flats and reef slope habitats, but was more abundant on reef slopes. In general, reef slopes had greater topographic complexity and heterogeneity, which may be favourable for sea urchin recruitment (Tomas et al., Reference Tomas, Romero and Turon2004), predator avoidance (Tuya et al., Reference Tuya, Boyra, Sanchez-Jerez, Barbera and Haroun2004; Hereu et al., Reference Hereu, Zabala, Linares and Sala2005; Clemente et al., Reference Clemente, Hernández, Montaño-Moctezuma, Russell and Ebert2013) and retention of detrital algal fragments (Krumhansl & Scheibling, Reference Krumhansl and Scheibling2012). Although Vanderklift & Kendrick (Reference Vanderklift and Kendrick2004) found no difference in H. erythrogramma abundances between reef flats and slopes, this finding was largely due to anomalously high densities on reef flats close to Fremantle Port, which were not surveyed in the current study.
The greatest source of spatial variability in H. erythrogramma abundance was at the scale of kilometres, between sites. In other regions of Australia, urchin densities are often higher at sheltered locations (Ling et al., Reference Ling, Ibbott and Sanderson2010; Livore & Connell, Reference Livore and Connell2012a), but we did not record greater abundances at our least exposed sites. However, our locations were all moderately to very exposed to intense wave action, as the south-west Australian coastline offers little protection from substantial oceanic swells (Bosserelle et al., Reference Bosserelle, Pattiaratchi and Haigh2012). In contrast, the coastal geomorphology of South Australia or Tasmania, for example, offers greater protection and the greater variability in wave exposure between locations. As such, the range of wave exposure captured by the current study was relatively limited. Previous surveys within the study area have indicated that sites with anomalously high abundances of H. erythrogramma are generally more sheltered (Vanderklift & Kendrick, Reference Vanderklift and Kendrick2004; Azzarello et al., Reference Azzarello, Smale, Langlois and Håkansson2013), but this pattern is highly variable. Other factors that may promote between-site variability include localised oceanographic processes that influence larval dispersal and recruitment (Hereu et al., Reference Hereu, Zabala, Linares and Sala2004), physical habitat structure, such as the complexity, composition and integrity of the limestone reef itself (Azzarello et al., Reference Azzarello, Smale, Langlois and Håkansson2013), and variability in predation pressure (Hereu et al., Reference Hereu, Zabala, Linares and Sala2005). Further work is needed to determine the relative importance of these factors in promoting small to medium scale variability in urchin abundance, size and condition.
The H. erythrogramma population at Hamelin Bay, our cooler southerly study location, was in some ways distinct from those at the other locations. Urchins at Hamelin Bay were smaller and the relative abundance of the H. e. erythrogramma subspecies was higher. There were no discernible differences in habitat structure, food availability or local stressors (i.e. pollution, nutrients) between Hamelin Bay and the other locations and, with average temperatures of ~19.5°C (Smale & Wernberg, Reference Smale and Wernberg2009), conditions at Hamelin Bay should be favourable (Byrne et al., Reference Byrne, Selvakumaraswamy, Ho, Woolsey and Nguyen2011). The reduced average urchin size at Hamelin Bay was, in part, related to a higher relative abundance of the H. e. erythrogramma subspecies, which was generally smaller than H. e. armigera. As the distributions and ecologies of the two sympatric subspecies in south-west Australia are almost entirely unknown (Binks et al., Reference Binks, Evans, Kennington and Prince2011), it is not possible to speculate as to why H. e. erythrogramma was considerably more abundant at our southernmost location. It is interesting to note that, despite differences in test diameter, gonad index values for the subspecies were similar.
In early 2011, west coast of Australia experienced its highest-magnitude oceanic warming event on record, as coastal sea temperatures soared to 2–4°C above average and record sea surface temperatures were observed (Rose et al., Reference Rose, Smale and Botting2012; Feng et al., Reference Feng, McPhaden, Xie and Hafner2013; Wernberg et al., Reference Wernberg, Smale, Tuya, Thomsen, Langlois, de Bettignies, Bennett and Rousseaux2013). The warming event, driven by anomalously intense La Niña conditions, persisted for >10 wk and affected >2000 km of coastline (Feng et al., Reference Feng, McPhaden, Xie and Hafner2013; Wernberg et al., Reference Wernberg, Smale, Tuya, Thomsen, Langlois, de Bettignies, Bennett and Rousseaux2013). The warming event had wide ranging impacts on temperate and tropical ecosystems, resulting in high levels of coral bleaching and mortality (Moore et al., Reference Moore, Bellchambers, Depczynski, Evans, Evans, Field, Friedman, Gilmour, Holmes, Middlebrook, Radford, Ridgway, Shedrawi, Taylor, Thomson and Wilson2012; Smale & Wernberg, Reference Smale and Wernberg2012), widespread mortality and consequent range contractions of habitat-forming macroalgae (Smale & Wernberg, Reference Smale and Wernberg2013; Wernberg et al., Reference Wernberg, Smale, Tuya, Thomsen, Langlois, de Bettignies, Bennett and Rousseaux2013), changes in demersal fish assemblages (Wernberg et al., Reference Wernberg, Smale, Tuya, Thomsen, Langlois, de Bettignies, Bennett and Rousseaux2013), and a suite of unusual ecological phenomena (Pearce et al., Reference Pearce, Lenanton, Jackson, Moore, Feng and Gaughan2011).
The impact of the extreme warming event on mobile invertebrates, however, is poorly understood. Our warmest study location, Jurien Bay (~30°S), is situated within a broader temperate–tropical transition zone and was particularly impacted by the warming event. In contrast, the cooler locations further south were considerably less impacted (Wernberg et al., Reference Wernberg, Smale, Tuya, Thomsen, Langlois, de Bettignies, Bennett and Rousseaux2013; authors', unpublished data). At Jurien Bay, where temperatures peaked at 28.3°C and were in excess of 26°C for 3 week (Pearce et al., Reference Pearce, Lenanton, Jackson, Moore, Feng and Gaughan2011; Wernberg et al., Reference Wernberg, Smale, Tuya, Thomsen, Langlois, de Bettignies, Bennett and Rousseaux2013), we did not observe declines in urchin abundance, size or condition, relative to the cooler locations. Moreover, H. erythrogramma abundances at Jurien Bay were not appreciably lower than those recorded by Vanderklift and Kendrick (Reference Vanderklift and Kendrick2004) some 12 yr previously. This is somewhat counter-intuitive as experimental work on H. erythrogramma on the east coast of Australia has shown that temperatures >26°C retard larval development and exceed thermal tolerances of adults (Byrne et al., Reference Byrne, Ho, Selvakumaraswamy, Nguyen, Dworjanyn and Davis2009, Reference Byrne, Selvakumaraswamy, Ho, Woolsey and Nguyen2011). This research has also indicated that H. erythrogramma has the potential to acclimatise and even adapt to increased temperature, as ‘warmer’ populations exhibit greater thermal tolerance (Byrne et al., Reference Byrne, Selvakumaraswamy, Ho, Woolsey and Nguyen2011). Therefore, it could be that the H. erythrogramma population at Jurien Bay, which persists close to its equator-ward range edge, were not directly impacted by the event because of enhanced thermal tolerance through phenotypic or genotypic adaptation. Moreover, it would appear that the H. erythrogramma population at Jurien Bay was not adversely impacted by indirect impacts of the warming event, specifically a decline in the quantity and quality of detrital food supply. Following the marine heat wave, the percent cover of the common kelp Ecklonia radiata decreased by >30% and other large fucoids were completely eliminated by the event as physiological thresholds were exceeded (Smale & Wernberg, Reference Smale and Wernberg2013; Wernberg et al., Reference Wernberg, Smale, Tuya, Thomsen, Langlois, de Bettignies, Bennett and Rousseaux2013). In the 2 yr since the event, there have been no signs of recovery (Wernberg, unpublished data). It may be that population persistence is not limited by detrital food supply, and a >30% reduction in local kelp abundance was buffered by redundancy in detritus production, or perhaps the urchins switched feeding behaviour and/or diet preference. It is also possible that the effects of the decline in local kelp abundance will take time to materialize at higher trophic levels, following reduced recruitment and fitness, for example.
There is some evidence to suggest that invertebrate herbivores at warmer, lower latitude locations were impacted by the warming event (Pearce et al., Reference Pearce, Lenanton, Jackson, Moore, Feng and Gaughan2011) and multi-species surveys along a broader latitudinal/temperature gradient will provide insights into the response of invertebrate assemblages to the warming event. Even so, it is evident that both discrete warming events (Wernberg et al., Reference Wernberg, Smale, Tuya, Thomsen, Langlois, de Bettignies, Bennett and Rousseaux2013) and gradual warming trends (Wernberg et al., Reference Wernberg, Russell, Moore, Ling, Smale, Coleman, Steinberg, Kendrick and Connell2011) will influence the ecology of the region and understanding population-level responses of key herbivores such as H. erythrogramma is of critical importance.
ACKNOWLEDGEMENTS
Scott Bennett, Tiffany Simpson, Emily Gates and Thibaut de Bettignies are acknowledged for assistance in the field. We thank Mat Vanderklift for insightful discussions.
FINANCIAL SUPPORT
This work was funded by the Australian Research Council through grants to T.W. D.A.S. is funded by a Marie Curie International Incoming Fellowship within the seventh European Community Framework Programme.


