


INTRODUCTION
Understanding of genetic diversity and population structure is important for maintaining productive fisheries and sustainable harvest of populations (Carvalho & Hauser, Reference Carvalho and Hauser1994; Park & Moran, Reference Park and Moran1994; Begg et al., Reference Begg, Friedland and Pearce1999). Many marine species often have large populations and pelagic larval stages. These characteristics are believed to be responsible for connecting populations demographically on a far broader spatial scale than among most terrestrial species (Caley et al., Reference Caley, Carr, Hixon, Hughes, Jones and Menge1996; Couceiro et al., Reference Couceiro, Barreiro, Ruize and Sotka2007). But in recent years, the existence of population subdivisions over small distances in some organisms with a potentially high dispersal capacity have been reported (Grosberg & Cunningham, Reference Grosberg, Cunningham, Bertness, Gaines and Hay2001; Couceiro et al., Reference Couceiro, Barreiro, Ruize and Sotka2007; Tzeng, Reference Tzeng2007; De Croos & Pálsson, Reference De Croos and Pálsson2010). A growing literature has also revealed the subdivision of wild populations due to ‘unnatural’ selection imposed by extensive human harvesting (Allendorf et al., Reference Allendorf, England, Luikart, Ritchie and Ryman2008; Allendorf & Hard, Reference Allendorf and Hard2009).
Parapenaeopsis shrimp species are common along the Indian subcontinent (Ravindranath, Reference Ravindranath1989). Within the area, purely marine Parapenaeopsis coromandelica (Alcock, 1906) occurs along the southern part of India and Sri Lanka extending as far as the Gulf of Thailand, the Indonesian Archipelago and Borneo (Fischer & Bianchi, Reference Fischer and Bianchi1984; De Bruin et al., Reference De Bruin, Russell and Bogusch1994). Substantial quantities of these shrimps are landed during monsoons sustaining thousands of small-scale trawl fishers (Ravindranath, Reference Ravindranath1989; De Bruin et al., Reference De Bruin, Russell and Bogusch1994). Parapenaeopsis coromandelica contributes 30% of the total shrimp landing of the two major fishing grounds on the west coast of Sri Lanka: Negombo and Hendala (De Croos & Valtýsson, Reference De Croos and Valtýsson2007). These non-overlapping fishing grounds are about 25 km apart and execute extremely different fishing intensities. Coastal shrimp trawling in Sri Lanka began approximately 100 years ago (Weerasooriya Reference Weerasooriya1977; Jayawardane et al., Reference Jayawardane, McLusky and Tytler2004) while at Hendala motorization of trawlers began 50–55 years ago. Negombo is a more artisanal fishing ground where traditional trawling canoes powered by a sail are operated, while at Hendala trawlers are powered by mechanized engines (fishery information in Table 1) (Jayawardane et al., Reference Jayawardane, McLusky and Tytler2004; Haputhantri & Jayawardane, Reference Haputhantri and Jayawardane2006). Investigations on the distribution, admixture of this purely marine benthic species at these adjacent geographical locations are scanty and limited understanding on their stock structure hinders important fisheries management decisions.
Table 1. Information on fishery and sampling of Parapenaeopsis coromandelica males (m) and females (f) collected from Hendala and Negombo.

*, Haputhantri & Jayawardane (Reference Haputhantri and Jayawardane2006).
Morphometric variability between different geographical populations can be considered as an indication of genetic structure and/or distinct environmental conditions. Hence, animals with the same morphometric characteristics are considered to belong to the same stock (Cadrin, Reference Cadrin, Cadrin, Friedland and Waldman2005). Similarly, reproductive life history parameters including timing, duration and location of spawning and age or length at maturity have been used as the basis for distinguishing stocks because these parameters are a phenotypic expression of the interactions between genotypes and environmental influences (Begg, Reference Begg, Cadrin, Friedland and Waldman2005). Conclusive evidence on the genetic effects of exploitation has also been documented (Rijnsdorp, Reference Rijnsdorp1993; Allendorf et al., Reference Allendorf, England, Luikart, Ritchie and Ryman2008; Allendorf & Hard, Reference Allendorf and Hard2009). In highly exploited stocks, possible genetic changes in life history parameters such as the size and age at first maturity, reproductive investment and growth rate are well accepted, because exploitation is selective and life history characters are heritable (Rijnsdorp, Reference Rijnsdorp1993). Ultimately, as a result of intensive harvesting, alteration of population subdivision, loss of genetic variation and selective genetic changes could occur in a population (Allendorf et al., Reference Allendorf, England, Luikart, Ritchie and Ryman2008).
Over the past decade, mark–recapture studies, chemical tagging studies and detailed modelling with morphometric data (Tzeng, Reference Tzeng2004), parasitic surveys (Garcia et al., Reference Garcia, Santos, Damiano, Nascetti and Mattiucci2008; Lester & MacKenzie, Reference Lester and MacKenzie2008), reproductive biology (Rijnsdorp, Reference Rijnsdorp1993; Begg, Reference Begg, Cadrin, Friedland and Waldman2005), and larval survival studies (Hare, Reference Hare, Cadrin, Friedland and Waldman2005) have been used to determine the stock structures of marine species. Presently genetic markers are considered to be the best available tool in estimating the level of exchange in marine populations (Hellberg, Reference Hellberg2009). Mitochondrial DNA has been extensively used to resolve genetic population structures of different shrimp species (Garcia-Machado et al., Reference Garcia-Machado, Robainas, Espinosa, Oliva, Paez, Verdecia and Monnerot2001; Klinbunga et al., Reference Klinbunga, Siludji, Wudthijinda, Tassanakajon, Jarayabhand and Menasveta2001; McMillen-Jackson & Bert, Reference McMillen-Jackson and Bert2004). Specifically, the mtDNA gene cytochrome c oxidase subunit I (COI) has been the marker of choice in most studies, and has successfully been used to describe the genetic structure of many shrimp species (Folmer et al., Reference Folmer, Black, Hoeh and Vrijenhoek1994) and other invertebrates (Couceiro et al., Reference Couceiro, Barreiro, Ruize and Sotka2007). Nevertheless, each stock identification technique has its own pros and cons. A combined approach integrating several stock identification methods may maximize the likelihood of correctly defining stocks (Pawson & Jennings, Reference Pawson and Jennings1996; Waldman, Reference Waldman, Cadrin, Friedland and Waldman2005; Tzeng, Reference Tzeng2007).
The aim of this study is twofold. Firstly, to find out whether Hendala and Negombo fishing grounds are individually harvesting the same stock or two geographically distinct sub-populations of P. coromandelica based on mtDNA analysis. Secondly, whether shrimps from the Hendala and Negombo fishing grounds differ in phenotypic and reproductive parameters. The presented information on reproduction, stock structure and genetic diversity could assist fishery managers to set sound management regulations for harvesting of P. coromandelica.
MATERIALS AND METHODS
Sample collection and measurements
Samples were collected from the commercial catches of trawlers from Hendala and Negombo fishing grounds off the western coast of Sri Lanka (Figure 1; Table 1). According to the pilot survey analysis based on the method by Helle & Pennington (Reference Helle and Pennington2004), six craft were sampled randomly from both fishing grounds on a weekly basis to minimize the variance in sampling craft. Differences in size-distribution among samples were minimized by simultaneous sampling from both fishing grounds throughout the study period and by analysing the sexes separately. Sampling took place at the landing site. A 2 l container was used to scoop through the catch to obtain samples from each selected craft. Complementary samples were also taken from experimental trawling on both fishing grounds at different depths.
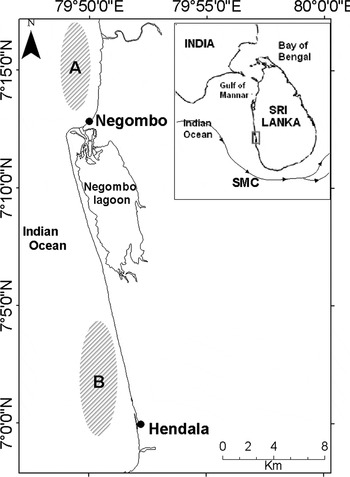
Fig. 1. Location of the two fishing grounds (Negombo (A) and Hendala (B)) on the west coast of Sri Lanka. Line with arrows in smaller panel indicates the south-west Monsoonal current (SMC).
At the landing site, P. coromandelica shrimp pleopod muscle tissue was removed, and immediately fixed in 90% ethanol for genetic analysis after recording sex and body measurements. Carapace length (from tip of the rostrum to posterior edge of carapace), total length (from tip of the rostrum to posterior edge of telson) and weight measurements were recorded, to the nearest 0.01 mm and 0.01 g respectively.
Carapace length, total length, and weight measurements obtained during the study were pooled by sex and compared between fishing grounds with a t-test. Carapace length was further analysed with respect to sex, fishing ground and month (considered as blocks), with analyses of variance. As three-way interaction was observed, the analysis was conducted separately for each sex, and the difference between fishing grounds further for each month. Variation in weight was analysed in a similar way with respect to sex, fishing ground and month, but by taking logarithm of length as a covariate, i.e. log Wt = log a + b log Lt. The effect of heterogeneity of the variances was studied by comparisons of the likelihoods of models with and without considering the variance structure applying the generalized least squares method (gls) implemented in the nlme R-package (Pinheiro et al., Reference Pinheiro, Bates, DebRoy and Sarkar2010). Condition factor (K) was calculated by K = (weight · 100/total length3) for each individual and averaged with respect to sex and fishing ground.
The increased risk of rejecting the null hypothesis was taken into account by the Bonferroni adjustment (e.g. Sokal & Rohlf, Reference Sokal and Rohlf1995).
Analysis of aspects of reproduction
SEX-RATIO
The sex-ratios were estimated for all individuals with respect to size and time (months). Sex-ratios were estimated at 0.2 mm length-classes within each population, in order to characterize the spawning in each fishing ground. The sex-ratio data were based on the proportion of the females and plotted with respect to the carapace length. A trend line was fitted with a floating mean of three size-classes in order to offset bias due to some sample numbers. A generalized linear model, with a Poisson link function, was used to analyse the variation in sex-ratio between the fishing grounds for each month.
SPAWNING SEASON
Seasonal changes in gonadosomatic index, indicating size of the gonads with respect to body weight (GSI = 100 · gonad weight/body weight), and percentage frequency of developmental maturity stages of gonads (as explained below), were analysed to determine the spawning season of adult females. This was estimated only for females, assuming that the development and maturation of testis is synchronous (King, Reference King2007).
MATURITY STAGES OF FEMALES
Degree of sexual maturity of females was grouped in four stages: Stage I: immature stage—unpigmented transparent ovaries confined to the abdomen; Stage II: early mature stage—increased ovary size with developing anterior and middle; Stage III: premature gonads—fully developed anterior middle lobes; and Stage IV: mature stage—greatly enlarged first abdominal segment of ovary in dark colour with developing ovaries, and with mature ovaries. Early maturing and developing or mature ovaries were isolated and weighed to the nearest 0.01 g to calculate GSI.
SIZE AT FIRST MATURITY (L50)
Depth-wise samples obtained from experimental trawling and commercial catches during the spawning period (April–June) were combined and all females belonging to maturity stages III and above, were considered as ‘matured' in calculating the mean length at 50% maturity (L50) (King, Reference King2007). Length at first maturity was estimated by plotting the proportion of sexually mature individuals by the length in 2 mm intervals and then fitting a generalized linear model (GLM) as in Sparre et al. (Reference Sparre, Ursin and Venema1992).
Analysis of population genetic structure
Total DNA was extracted from ~1 mg pleopod tissue of ethanol-preserved samples. Tissues were incubated in 6% Chelex with proteinase K at 67°C overnight with 650 rpm shaking. Polymerase chain reaction (PCR) amplifications of the COI mtDNA region were performed using LCO-1490 and HCO-2198 primers (Folmer et al., Reference Folmer, Black, Hoeh and Vrijenhoek1994). PCR reactions were performed in a final volume of 10 µl, containing 0.75 µl of dNTP (0.2 mM), 1.15 µl of 1%Tween 20, 1 µl Taq polymerase (NEB 5 U/µl) and 1 µl of 0.5 BSA (0.5 mM) and 1 µl of DNA (65–160 ng/µl). A thermal cycle of the following profile was used: 4 minutes at 94°C for 30 seconds then 40 cycles of 1 minute at 94°C denaturation, 30 seconds at 45°C for annealing and 1 minute at 72°C for extension. A final step of 6 minutes at 72°C was added to complete extension of the fragments. The products were sequenced on ABI 3100 Genetic Analyser (Applied Biosystems) for both forward and reversed direction.
Gene diversity (h) and nucleotide diversity (π) were calculated using ARLEQUIN, version 3.1 (Excoffier et al., Reference Excoffier, Yer, Laval and Schneider2006). To evaluate the neutrality of the observed variation, number of standard tests (Tajima test, Fu's Fs Ewens–Watterson test and Chakraborty's test) implemented in Arlequin, were applied. The statistical significances were tested by using 1000 permutations. Comparison of the result of the different tests can give more sound outcomes of the analyses of selective and historic processes shaping the genetic data. Demographic histories were further investigated by the mismatch method developed by Rogers & Harpending (Reference Rogers and Harpending1992), implemented in DnaSP v5 (Librado & Rozas, Reference Librado and Rozas2009).
The population variation was analysed both by applying conventional F statistics based on haplotype frequencies and by taking genetic distances among haplotypes into account (Tamura & Nei, Reference Tamura and Nei1993). Significance was tested by 1000 permutations of the data set. The evolutionary relationships between haplotypes were examined with the software Network (http://fluxus-engineering.com/) using a median-joining algorithm to build an unrooted cladogram, and redrawn using R (R Development Core Team, 2010).
RESULTS
Morphometric comparisons
LENGTH AND WEIGHT COMPARISON
Significant differences were observed between the two fishing grounds for sex-wisely pooled total length (P < 0.0001), carapace length (P < 0.0001) and weight (P < 0.0001) data. The carapace length varied over time, from 3.09 to 3.70 cm in males and from 2.61 to 3.14 cm in females. Variances for the same lengths ranged from 0.137 to 0.427 in females and 0.036 to 0.146 in males. Due to heterogeneity in variances, models incorporating its effect were selected. Carapace length was found to be affected by a three-way interaction (sex:fishing ground:month; P < 0.0001). A separate analysis for each sex revealed significant interactions between months and fishing ground (Table 2). A sex-separated analysis of the monthly differences between the two fishing grounds (Figure 2A) shows that the lengths differ between the fishing grounds in both sexes during June–October, but in females only in December. The average lengths of individuals from Hendala are generally larger.

Fig. 2. Differences in biological traits of Parapenaeopsis coromandelica between Negombo (solid line) and Hendala (broken line) from January 2009 to April 2010. (A) Mean carapace length (CL) of females (upper two lines) and males (lower two lines); (B) slope of log transformed length–weight relationship for females; and (C) the corresponding comparison for males. Significant differences between the two fishing grounds are marked with asterisks (*). In panel (a) asterisks in upper and lower levels correspond to the significant differences in females and males respectively. Sample sizes are equal to the numbers given in Table 4; (D) shows the % GSI of females in Hendala (filled circles) and Negombo (open circles) from April 2009 to April 2010; vertical bars in represent confidence intervals.
Table 2. Outcomes of the two-way analysis of variance, analysed with the least squares method of the carapace length of Parapenaeopsis coromandelica females and males, collected from two fishing grounds: Hendala and Negombo. Number of degrees of freedom (df) in the denominator were 9814 for females and 11,175 for males.
LENGTH–WEIGHT RELATIONSHIP AND CONDITION FACTOR
Analysis of the variation in weight with respect to carapace length gave a similar result to the analysis of the carapace length variation. Significant three-way interactions were found between the sex, fishing ground and month, and these were dependent on the covariate (P < 0.0001). The analysis of weight with respect to length and fishing ground was thus conducted for each sex and showed highly significant effects (Table 3). Due to interactions among the variables the analysis was further conducted for each month (see Supplementary Table S1 online). As expected, length contributed significantly to weight, although the slope varied from month to month. Significant differences in the slope of the log transformed length–weight relationships were observed for females during July–September and marginally in March–April 2010 (considering the Bonferroni adjustment) (Figure 2B); the slope for males differed for a longer period (April–November) (Figure 2C). The individuals from Hendala generally showed steeper slopes. The adjusted mean (intercepts) of the Hendala sample was larger in both sexes in June, where the slope was equal (see Supplementary Table S1 online). Significant differences in adjusted means were also observed in March and November for females.
Table 3. Outcomes of the two-way analysis of covariance, analysed with the least squares method, of variation in weight of Parapenaeopsis coromandelica females and males collected from two fishing grounds (Hendala and Negombo) with carapace length (CL) as covariate. Weight and CL were both log-transformed. Number of degrees of freedom (df) in the denominator were 9782 for females and 11143 for males.

The condition factors for the sexes at Hendala and Negombo were found to be in same range for males (0.55 ± 0.01 and 0.53 ± 0.01) and females (0.53 ± 0.01 and 0.51 ± 0.01) respectively (t-tests, P > 0.05).
Reproductive aspects
SEX-RATIOS
The sex-ratios at the two fishing grounds were different in four months (May, August, September and October) (Table 4). The sex-ratio was generally skewed towards males, although females were found in higher numbers in the months of March and April (marginally) in both fishing grounds in 2009, and a similar trend was observed at Negombo in 2010.
Table 4. Male and female numbers and the monthly comparisons of the deviation of sex-ratio (generalized linear model) from expected 1:1 value and its association with fishing ground (G:Sex) for Parapenaeopsis coromandelica collected from Hendala and Negombo during January 2009–April 2010.

Statistical significance level: P = 0.1–0.05•; P = 0.05–0.01*; P = 0.01–0.001**; P < 0.001***.
In both fishing grounds, sex-ratios varied in an identical v-shaped manner with respect to size, with minimum at 2.7 cm in carapace length (Figure 3).

Fig. 3. Relationship between the sex-ratio and the carapace length (cm) of Parapenaeopsis coromandelica at Negombo and Hendala fishing grounds. Numbers of measured males (nm) and females (nf) are presented for the two fishing grounds separately.
GONADOSOMATIC INDEX (GSI)
Though the basic pattern of %GSI fluctuation throughout the year is more or less similar in both fishing grounds, significant average differences were observed (Figure 2D). In both fishing locations %GSI decreases during the months of April–July and remains at a low level during the following 3–4 months (July–October). The spawning seems to be taking place in the April–July period. A steeper GSI drop occurred in May–June at Negombo than in Hendala where the drop occurred in April–May. The slight drop in percentage GSI values observed in the December–January period at Hendala is not prominent at Negombo fishing ground.
Abundance of percentage mature females stages were in conformity with the April–August spawning period (Figure 4). The highest proportion of mature gonads (22–40%) was observed during this period in both fishing grounds.

Fig. 4. Monthly changes in the percentage of maturity stages (I–IV) of female Parapenaeopsis coromandelica at Negombo (A) and Hendala (B) from April 2009 to April 2010.
SIZE AT FIRST MATURITY (L50)
The size at first maturity (L50) was smaller at Hendala (2.9 cm) than in Negombo (3.2 cm, P = 0.03) (Figure 5). The significant difference was observed by comparing the residuals of models with (Akaike information criterion (AIC): 833.78) and without (AIC: 836.19) considering the sampled locations.

Fig. 5. The length at maturity for female Parapenaeopsis coromandelica at Negombo and Hendala fishing grounds. The curved lines present the prediction from a generalized linear model fitted separately to the data from each fishing ground. Straight broken lines present the 50% maturity (L50) in Negombo and in Hendala. n, sample size; a, intercept term; b, regression coefficient.
Population genetics
DIVERSITY AND GENETIC VARIATION
Sixty-six shrimps (35 males and 31 females), ranging in size from 18 mm to 51 mm carapace length, were sequenced, resulting in 620 base pairs (bp) from each individual. Eighteen haplotypes were identified, four types were found in more than a single individual: 44 Hp1, 6 Hp3, 3 Hp15 and 2 Hp5 (Table 5; Figure 6). Three of the haplotypes were found at both locations, all three Hp15 were found in individuals from Negombo. Number of haplotypes, haplotype diversity and nucleotide diversity was about two times higher in Negombo than in Hendala (Table 6).

Fig. 6. Median-joining network of COI mtDNA haplotypes in Parapenaeopsis coromandelica, sampled from Negombo and Hendala in Sri Lanka. Each haplotype (Hp) is represented by a pie and its area is proportional to its relative frequency (smallest = 1); length of lines reflects the number of nucleotide differences between haplotypes (shortest = 1). Different shadings in pies represent Negombo (Black) and Hendala (White) regions. Numbers refer to haplotype numbers in Table 5.
Table 5. Haplotypes of the mtNDA COI gene (620 base pairs) for Parapenaeopsis coromandelica from the Hendala and Negombo populations. Variable sites are presented with numbers starting from the beginning of the sequences. Hp, haplotype identity; H,Hendala; N, Negombo. Sample number is denoted in parentheses.

Table 6. Genetic diversity and demographic history information of Parapenaeopsis coromandelica collected from Hendala and Negombo.

ns, not significant.
POPULATION GENETIC STRUCTURE AND DEMOGRAPHIC HISTORY
Population subdivision between the two fishing grounds, based on haplotype frequencies only was significant (Fst = 0.037, P = 0.036 ± 0.005). The two fishing grounds were not significantly different when the genealogical relationship was considered (Фst = 0.007; P = 0.224 ± 0.012). A larger Fst than Фst indicates a recent subdivision which is not supported by a phylogenetic split of the mtDNA lineages.
The mismatch analysis produced a unimodal distribution for both samples, with a higher average pairwise haplotype difference for Negombo. Tajima's D and Fu's Fs tests were negative and significant for each sample (Table 6), indicating purifying selection or alternatively recent expansion.
DISCUSSION
The populations of Parapenaeopsis coromandelica at the two neighbouring fishing grounds at Hendala and Negombo, western Sri Lanka, are distinguished by morphological, reproduction and mitochondrial characteristics. The differentiation may be recent and has possibly been driven by different fishing intensities.
Carapace length, total length and weight are significantly different with respect to the sampled fishing grounds during part of the year. Morphometric variation between stocks provides a basis for stock structure though factors like sexual dimorphism, timing of sampling, and allometric growth can bias the estimates of the population differences (Tzeng, Reference Tzeng2004). The present study was carefully designed in order to minimize variance due to sampling, and high numbers of individuals were sampled. Sexual dimorphism of P. coromandelica has not been reported earlier, and as no sexually intermediate individuals were found in the present samples the effect on morphological measurements by sex reversal is highly unlikely.
To differentiate and sustain as discrete stocks, a reasonably high degree of reproductive isolation is essential (Rice, Reference Rice1987; Tzeng, Reference Tzeng2004; Begg, Reference Begg, Cadrin, Friedland and Waldman2005). Such reproductive isolation can be based on spawning locations, spawning periods and spawning frequencies (Tzeng, Reference Tzeng2004; Begg, Reference Begg, Cadrin, Friedland and Waldman2005). The sex-ratio differed between the fishing grounds, in May, August, September and October, and deviated from parity at different months. As there was no evidence of sex reversal, the observed difference is most likely due to behaviour or difference in growth rates. High abundance in females at larger length-classes may be due to faster growth, differences in mortality or timing of migration caused by either genetic or environmental effects (Creasey et al., Reference Creasey, Rogers, Tyler, Young and Gage1997). The environmental conditions, such as rain and temperature fluctuations, at the two closely located fishing grounds are almost similar (source of data: Meteorological Department SL). Nevertheless, based on the %GSI values, the predicted spawning seasons at the two fishing grounds were found to be slightly different. Months where significant differences in %GSI were observed did not coincide with months where the length and growth differences were found, indicating no direct relation between reproduction and growth or growth inducing factors. The minor spawning period observed at Hendala during December–January (as evident by the drop of %GSI; Figure 2D) was not prominent in the sample obtained from Negombo. This observed minor spawning period at Hendala was in agreement with the finding of decreased percentage females' fourth maturity stage during the same period at Hendala. The observed differences in timing of spawning at two locations provide particularly valuable information because, as shown by Begg (Reference Begg, Cadrin, Friedland and Waldman2005), they can restrict gene flow to a level that effectively isolates stock units. The %GSI values reported for April 2009 and 2010 were found to be slightly different. This difference in two fishing years might though be due to fluctuations caused by dynamic environmental factors, which may be prominent in short-lived species (Millan, Reference Millan1999).
Interestingly, the two fishing locations revealed different mean lengths at sexual maturity (L50). In Hendala individuals attain sexual maturity at smaller sizes than in Negombo. The overlapping of the two fishing grounds are prevented by regulations (Jayawardane et al., Reference Jayawardane, McLusky and Tytler2004) and the fisheries are operated at different intensities. Negombo is a more artisanal fishing ground, where sailing canoes are operated, but at Hendala trawlers are powered by mechanized engines (Jayawardane et al., Reference Jayawardane, McLusky and Tytler2004). These two extreme harvesting intensities seem to be creating different fishing pressures on these two fishing grounds. Human harvest of wild populations is almost always non-random. Hence, individuals with certain size, morphology, or behaviour are more vulnerable than others and subsequently can be removed from population through continuous harvesting. This will lead to genetic changes in harvested populations if the selected phenotype has a genetic basis, or to ‘unnatural’ selection as termed by Allendorf & Hard (Reference Allendorf and Hard2009); such as decreasing size at maturity due to intensive fishing in lobster (Melville-Smith & de Lestang, Reference Melville-Smith and de Lestang2006) and fish populations (Gerritsen et al., Reference Gerritsen, Armstrong, Allen, McCurdy and Peel2003; Ernande et al., Reference Ernande, Dieckmann and Heino2004; Olsen et al., Reference Olsen, Heino, Lilly, Morgan, Brattey, Ernande and Dieckmann2004; Allendorf et al., Reference Allendorf, England, Luikart, Ritchie and Ryman2008; Allendorf & Hard, Reference Allendorf and Hard2009). Evolutionary changes have also been reported by Law (Reference Law2007) and Coltman (Reference Coltman2008) in fisheries that are not highly selective, but cause high fishing mortalities. According to Rijnsdorp (Reference Rijnsdorp1993) and Gerritsen et al. (Reference Gerritsen, Armstrong, Allen, McCurdy and Peel2003), genotypes that code for high fecundity or early maturation are favoured over genotypes coding for low fecundity or delayed maturation under enhanced mortality. Hence, the observed different lengths at maturity in the two locations may result from different fishing pressures created during the last few decades, further augmented by the short life span of the shrimp. Phenotypic changes in body size and related traits caused by human harvesting are known to be much more rapid on average (they can be three times higher) than changes in natural systems (Darimont et al., Reference Darimont, Carlson, Kinnison, Paquet, Reimchen and Wilmers2009; Shackell et al., Reference Shackell, Frank, Fisher, Petrie and Leggett2010).
Most marine organisms exhibit phenotypic plasticity (Rijnsdorp, Reference Rijnsdorp1993; Prada et al., Reference Prada, Schizas and Yoshioka2008), thus the lower L50 at Hendala and difference in other reproductive parameters might be a plastic phenotypic response due to enhanced availability of food at reduced population size, created through extensive fishing (Gerritsen et al., Reference Gerritsen, Armstrong, Allen, McCurdy and Peel2003; Olsen et al., Reference Olsen, Heino, Lilly, Morgan, Brattey, Ernande and Dieckmann2004). Heritability estimates for life history traits in teleosts indicate that about 24% of the phenotypic variability in a trait is due to genetic variability (Rijnsdorp, Reference Rijnsdorp1993) but estimates of such a genetic heritability in shrimps are scanty in literature. As variation in morphometric (Cadrin, Reference Cadrin, Cadrin, Friedland and Waldman2005) and reproductive behavioural characters (Begg, Reference Begg, Cadrin, Friedland and Waldman2005) can be affected by both genetic and environmental factors, the population structure or the degree of reproductive isolation needs to be further confirmed with genetic analysis (Tzeng, Reference Tzeng2007).
The mtDNA COI analysis revealed relatively high difference in genetic diversity between the two fishing grounds. The diversity at Negombo, where artisanal sailing canoes are operated was about twofold higher than in Hendala and the number of unique haplotypes in Negombo was three times higher. Studies on mtDNA variation in Parapenaeopsis shrimps are scanty. A study on 1048 bp of the mitochondrial control region in a related species, P. hardwickii from the China Sea and Taiwan, revealed a high diversity as well: 153 haplotypes were observed in 171 individuals (Tzeng, Reference Tzeng2007). The haplotype diversity (0.99) of P. hardwickii (Tzeng, Reference Tzeng2007) was high as it depends on the sequence length but the nucleotide diversity (π) (0.66–0.95%) was within the range of this study. Similar and higher nucleotide diversities have been observed in populations of Penaeus japonicus in East Asia (Tsoi et al., Reference Tsoi, Chan and Chu2007).
Lower number of haplotypes and haplotype diversity at Hendala, as well as lower L50, might result from higher fishing intensity. The effective population size as reflected by genetic diversity is often much smaller than the population numbers, especially in marine species, hence heterozygosity can even be lost despite large population sizes (Allendorf et al., Reference Allendorf, England, Luikart, Ritchie and Ryman2008). The impacts of harvesting have been reported by many authors (e.g. review by Allendorf et al., Reference Allendorf, England, Luikart, Ritchie and Ryman2008) who discussed how harvest of phenotypically desirable animals from wild populations imposes selection. Further, Allendorf et al. (Reference Allendorf, England, Luikart, Ritchie and Ryman2008) showed how reduced population size due to harvesting reduces the number of migrants and causes the loss of genetic variation. Early migrants may though experience lower capture rates and selection may thus favour earlier-arriving individuals, and subsequently result in genetic changes (Quinn et al., Reference Quinn, Hodgson, Flynn, Hilborn and Rogers2007). A selection towards either late-arrivals or earlier-arrivals could also be possible in P. coromandelica, as they perform an annual migration towards the fishing grounds (De Bruin et al., Reference De Bruin, Russell and Bogusch1994). Maximum trawling time and speed may also impose size-dependent selection, making it easier for larger individuals to escape the trawls, as discussed by Law (Reference Law2007). The effect of fishing may thus both alter the stocks and lead to less diversity.
The analysis of the demographic changes, as revealed by the mismatch distributions and the various neutrality tests, points to a population expansion or possible selective effects at both locations. A similar unimodel pattern of the mismatch distributions was also observed from the same waters for P. indicus, although the variation was much larger (De Croos & Pálsson, Reference De Croos and Pálsson2010).
The differences between the two fishing grounds were further confirmed by a significant difference in frequencies of the haplotypes (Fst), pointing to limited gene flow between the regions. As the corresponding Фst, value, considering genetic distances among the haplotypes, was not significant, the observed divergence may reflect a recent substructure. Parapenaeopsis coromandelica is known to migrate from inshore to offshore as they grow to a specific size or life stage. This is especially apparent for the females in this study (Figure 3). No documented literature on the migratory distance exists of P. coromandelica between coast and offshore areas, but De Bruin et al. (Reference De Bruin, Russell and Bogusch1994) have reported the presence of this species in muddy substrates around 15 m of depth-range. Living at the muddy or sandy bottoms may lead to reduced admixture due to oceanic currents than in pelagic species. Being an entirely marine species and not migrating to the adjacent common lagoon in Negombo to complete their life cycle as other penaeid shrimps in the region do may also minimize the chances of admixture. A recent study of variation in the COI mtDNA gene in Fenneropenaeus indicus (De Croos & Pálsson, 2010) and Metapenaeus dobsoni (De Croos & Pálsson, unpublished observations) in the same waters, Hendala and Negombo, did not reveal any differentiation, and comparison of L50 in M. dobsoni showed no difference (De Croos et al., Reference De Croos, Pálsson and Thilakarathna2011). The dispersal of larvae is the primary source of distribution and recruitment of marine invertebrates, hence P. coromandelica larvae should also be dispersed with ocean currents. The mixing of pelagic larvae may though fail to homogenize genetically in heavily harvested populations, with no other demographic inputs (Hellberg, Reference Hellberg2009). Similarly Tzeng (Reference Tzeng2007) reported that the mixing of Parapenaeopsis hardwickii larvae north-east of Taiwan and in the east Chinese Sea was not sufficient to eliminate the genetic difference between localities in Taiwan. No evidence of geographical barriers exists between the Hendala and Negombo fishing grounds. During the spawning period of P. coromandelica (May–June) there is a strong south-west monsoonal current further west of the coast (Schott & McCreary, Reference Schott and McCreary2001). This current is though not sufficient to homogenize the genetic frequencies in the two areas and cannot explain higher diversity in Negombo.
Biological and genetic evidences of the present study revealed that sub-populations of P. coromandelica at Hendala and Negombo are different. According to the meteorological data, both grounds are exposed to similar environmental fluctuations. Thus, the observed differences in length and reproductive parameters could reflect genetic differences, caused or enhanced by exploitation pressure. The observed differences in biological traits between the two fishing grounds were in conformity with the findings of the genetic analysis. To verify whether the differences between the two fishing grounds reflect a stable divergence, despite the absence of geographical barriers, a more comprehensive study based on samples over generations and a larger geographical region is needed. A study of variation in nuclear genetic markers is also necessary to analyse the extent of the genetic divergence of the two populations.
The high harvesting intensities at Hendala fishing grounds seem to be threatening the local subpopulation. Further, shrimps' behaviour seems to be preventing the mixing of Hendala and Negombo sub-populations. This becomes more crucial in terms of sustainable fishery because evolution under exploitation can reduce population growth and viability, and ultimately yield (Olsen et al., Reference Olsen, Heino, Lilly, Morgan, Brattey, Ernande and Dieckmann2004; Allendorf & Hard, Reference Allendorf and Hard2009). A sustainable harvest of P. coromandelica on the west coast of Sri Lanka should be developed, incorporating genetic principles combined with routine molecular genetic monitoring to detect and minimize harmful evolutionary genetic alterations before it threatens productivity.
ACKNOWLEDGEMENTS
We thank Professor Gunnar Stefansson for his suggestions in designing a sample survey used in this study. Support extended by Dr Tumi Tomasson (County Director, ICEIDA—Sri Lanka) is gratefully acknowledged. R.M.G.N. Thilakarathna and the Department of Wildlife Conservation, Sri Lanka are acknowledged for their support in shrimp sample collection. We want also to thank two anonymous referees for constructive comments. This research was fully supported by a grant from the Icelandic International Development Agency (ICEIDA)—Sri Lanka (grant number ICEDA2009_01) and the United Nations University, Fisheries Training Programme (UNU-FTP) in Iceland.
Supplementary materials and methods
The Supplementary material referred to in this article can be found online at journals.cambridge.org/mbi.


