INTRODUCTION
Biofilms are ubiquitous in the marine world (García-Fernández et al., Reference García-Fernández, Cui, Serrano, Gropeanu, San Miguel, Iturri Ramos, Wang, Auernhammer, Ritz, Golriz, Berger, Wagner and del Campo2013). Biofilms are composed of multiple species of microorganisms attached to the substratum and encased within a matrix of extracellular polymeric substance (Dobretsov et al., Reference Dobretsov, Abed and Teplitski2013). Marine biofilms contain different species of heterotrophic bacteria, cyanobacteria, archaea, diatoms, protozoans and other microorganisms (Dobretsov, Reference Dobretsov, Dürr and Thomason2010; Callow & Callow, Reference Callow and Callow2011; Wahl et al., Reference Wahl, Goecke, Labes, Dobretsov and Weinberger2012). Biofilms can promote (Kirchman et al., Reference Kirchman, Graham, Reish and Mitchell1982; Bao et al., Reference Bao, Yang, Satuito and Kitamura2007b; Yang et al., Reference Yang, Shen, Liang, Li, Bao and Li2013), inhibit (Holmström et al., Reference Holmström, Rittschof and Kjelleberg1992; Dobretsov & Qian, Reference Dobretsov and Qian2004), or have no effect (Henschel & Cook, Reference Henschel and Cook1990; Wieczorek & Todd, Reference Wieczorek and Todd1998) on larval settlement and metamorphosis of many marine invertebrates. Thus, different species of marine invertebrates may exhibit varying responses to biofilms.
Despite the long-recognized role of biofilms as potential inducers of larval settlement and metamorphosis of marine invertebrates, knowledge about the interactions between marine biofilms and resettlement of metamorphosed plantigrades of mussels is limited. For example, biofilms enhanced or had no effect on settlement of juveniles of the brown mussel Perna perna (Ank et al., Reference Ank, Porto, Pereira and da Gama2009). Recently, Yang et al. (Reference Yang, Li, Liang, Bao, Shen and Li2014) demonstrated that natural biofilms could enhance settlement of plantigrades of the mussel Mytilus coruscus.
The formation of biofilms can be affected by the physical, chemical and biological factors (Dobretsov, Reference Dobretsov, Flemming, Murthy, Venkatesan and Cooksey2009). Recently, effects of physical factors, especially the characteristic of the surface including wettability, roughness, colour and tension have received much attention (Terlizzi & Faimali, Reference Terlizzi, Faimali, Dürr and Thomason2010). Wettability represents a fundamental property of any material; it reveals information about the chemical structure of the material (Genzer & Efimenko, Reference Genzer and Efimenko2006). Surface wettability may regulate patterns of cell accumulation and cell distribution during the early stages of biofilm development (Terlizzi & Faimali, Reference Terlizzi, Faimali, Dürr and Thomason2010). In addition, surface wettability is one of the major factors influencing larval settlement of many marine invertebrates (Prendergast, Reference Prendergast, Dürr and Thomason2010), e.g. the bryozoan, Bugula neritina (Rittschof & Costlow, Reference Rittschof and Costlow1989; Gerhart et al., Reference Gerhart, Rittschof, Hooper and Eisenman1992), the mussel, M. galloprovincialis (Carl et al., Reference Carl, Poole, Sexton, Glenn, Vucko, Williams, Whalan and de Nys2012), the barnacles Balanus amphitrite (Rittschof & Costlow, Reference Rittschof and Costlow1989) and B. improvisus (Dahlström et al., Reference Dahlström, Jonsson, Jonsson and Elwing2004) and the ascidian, Ascidia nigra (Gerhart et al., Reference Gerhart, Rittschof, Hooper and Eisenman1992). The studies described above focused on understanding the interaction between surface wettability and biofilm formation or the interaction between surface wettability and larval settlement of marine invertebrates. Although the interaction between surface wettability and the biofilm community is expected to play an important role in the larval settlement process (Maki et al., Reference Maki, Ding, Stokes, Kavouras and Rittschof2000; Faimali et al., Reference Faimali, Garaventa, Terlizzi, Chiantore and Cattaneo-Vietti2004), knowledge of the interactions between surface wettability, biofilm characteristics and settlement of marine invertebrates is limited.
The mussel M. coruscus is an important fouling species in China (Cai et al., Reference Cai, Chen, Xue and Lu1994; Yang et al., Reference Yang, Shen, Liang, Li, Bao and Li2013), and inhabits the temperate zone along the coast of the East China Sea (Chang, Reference Chang2007). In contrast with other marcofouling organisms, mussels are able to detach, cutting their byssal thread, to reattach on a new habit (Petrone, Reference Petrone2013). At the end of a planktonic larval phase, the competent pediveliger larvae of the mussels will settle and metamorphose in a suitable environment. The metamorphosed individuals are termed plantigrades (Bayne, Reference Bayne1964; Carl et al., Reference Carl, Poole, Vucko, Williams, Whalan and de Nys2011, Reference Carl, Poole, Sexton, Glenn, Vucko, Williams, Whalan and de Nys2012), post-larvae (Cárceres-Martínez et al., Reference Cárceres-Martínez, Robledo and Figueras1994; Yang et al., Reference Yang, Satuito, Bao and Kitamura2008, Reference Yang, Li, Satuito, Bao and Kitamura2011), spat, seed or juveniles (Alfaro et al., Reference Alfaro, Jeffs and Creese2004). Following the primary settlement, these plantigrades can detach from their byssal threads and resettle to a new location (Bayne, Reference Bayne1964; Kavouras & Maki, Reference Kavouras and Maki2003; Petrone, Reference Petrone2013). In the present study, the authors investigated effects of surface wettability on the characteristics of natural biofilms, such as biofilm age, dry weight, bacterial and diatom densities, thickness, chlorophyll-a (chl a) and the biofilm community. Simultaneously, the effect of biofilms formed on surfaces of different wettabilities on the settlement of M. coruscus plantigrade was also examined. The purpose of this study was to determine whether the biofilm formation was influenced by surface wettability, and whether change of biofilm characteristics resulted in variance of the settlement of plantigrades of M. coruscus.
MATERIALS AND METHODS
Preparation and deployment of glass slides
In order to obtain the different wettabilities, microscopic glass slides (38 mm × 26 mm) were treated following the method of Gerhart et al. (Reference Gerhart, Rittschof, Hooper and Eisenman1992). Briefly, surfaces of glass slides were prepared by heating at 500°C for 4 h, and stored in a desiccated cabinet at 100°C until used. Four modified surfaces were produced through silanisation using procedures summarized in Table 1. Two treatments, trimethylsilyl (TMS) and dimethyldichlorosilane (DMS), created low surface wettability. Two treatments, aminopropyltriethoxysilane (APS) and (3-chloropropyl)trimethoxysilane (CLPRS), created intermediate surface wettability. Non-treated glass slides (Glass) showed high surface wettability.
Table 1. Silanizing procedures used in the assay.

*, sodium pyrophosphate buffer.
Drop spread measurement
The wettability of each surface was measured using the drop spread technique according to the procedures described by Gerhart et al. (Reference Gerhart, Rittschof, Hooper and Eisenman1992). The spread of 25 µl drops of water (100, 80, 60, 40, 30, 20, 10, 0%) in methanol was measured to the nearest millimetre. The calculation of the standardized harmonic mean (SHM) of the drop spread data was conducted following the method of Gerhart et al. (Reference Gerhart, Rittschof, Hooper and Eisenman1992). Six replicate measurements were used in the assays. Briefly, drop spread measurements were reduced to a single number, scaled from 0 to 100, by calculating a SHM of the drop spread measurements using the following equation (Gerhart et al., Reference Gerhart, Rittschof, Hooper and Eisenman1992):
 $$\eqalign{{\rm SHM}& =\left[{\left({\displaystyle{8 \over \eqalign{&1/{W_{100}}+1/{W_{80}}+1/{W_{60}}+1/{W_{40}}\cr &\quad+1/{W_{30}} +1/{W_{20}}+1/{W_{10}}+1/{W_0}}}} \right)- 4} \right] \cr & \quad / 16 \times 100}$$
where W 100 is mm drop spread at 100% water; W 80 is mm drop spread at 80% water in methanol, etc; 8 indicates number of solvent concentrations used; 4 indicates minimum possible drop measurement in millimeters; 16 indicates maximum range of drop sizes in millimetres.
Development of natural biofilms
Biofilm slips were prepared by immersing clean all of the treated and untreated glass slides in coastal seawater at Gouqi Island (122°77′E 30°72′N), Zhejiang Province, China. All slips were placed on PVC holders and immersed at a depth of 0.5–1.0 m below the surface for 1–10 days in November 2012. The slips were brought back to the laboratory and thoroughly washed with autoclaved filtered seawater (AFSW) prior to use in biofilm collection for dry weight measurement, enumeration of diatom density, DNA extraction and mussel settlement bioassays on the same day.
Measurement of biofilm dry weight
Dry weight was measured by the method of Bao et al. (Reference Bao, Satuito, Yang and Kitamura2007a). The biofilms on each glass slide were scraped off by using a sterile glass slide and separately suspended in AFSW. Each suspension was collected on a pre-weighed GF/C filter (Whatman glass fibre filter; pore size: 1.2 µm) by filtration. Each filter paper holding the biofilm was washed with 50 ml of 0.22 µm filtered distilled water, dried for 48 h in an oven at 80°C and cooled to room temperature in a desiccator before weighting. The dry weight of the biofilm was determined after subtracting the weight of the filter.
Enumeration of densities of bacteria and diatoms
Biofilms were fixed in 5% formalin solution for a maximum duration of 3 weeks. Samples were washed with AFSW and stained by acridine orange (AO, 0.1%) for 5 min. Bacterial densities of stained samples were counted directly at 1000× magnification under an Olympus BX51 epifluorescence microscope. Densities of diatoms were counted directly at 200× magnification under a light microscope immediately after samples were brought back to the laboratory. The densities of bacteria and diatoms in each sample were enumerated from ten random fields of view.
Determination of biofilm thickness
Biofilm thickness was measured by the method of Yang et al. (Reference Yang, Shen, Liang, Li, Bao and Li2013). Biofilms of four ages were fixed in 5% formalin solution for 24 h. Biofilms were stained by propidium iodide (5 µg ml−1) and incubated for 15 min in the dark. Slides were washed three times, and then were observed at 400× magnification under an Olympus FluoView™ FV1000 confocal laser scanning microscope (CLSM). Three replicate biofilms were examined for each age of biofilm. Ten random fields of view of each biofilm were selected for imaging and analysis. Thirty image stacks of varying thickness were generated to determine the full thickness of the biofilms in each field of view.
Chlα concentration in natural biofilms
The chlα concentration in biofilms was measured following the method of Wang et al. (Reference Wang, Bao, Gu, Li, Liang, Ling, Cai, Shen and Yang2012). Briefly, natural biofilms were scraped from three replicate glass slides using sterile glass slides, filtered through membranes and preserved at −20°C. Chl a extraction was conducted at 4°C using 90% acetone for 14 h in darkness. To ensure complete extraction of chl a, samples were vortexed for 1 h at the end of the extraction period, then centrifuged for 10 min at 3000 rpm. The chl a concentration of the supernatants was determined spectrophotometrically (UNIC 2100 spectrophotometer). The wavelengths measured were 630, 647, 664 and 750 nm, respectively. The chl a concentrations were calculated using the equation of Ma et al. (Reference Ma, Liu and Wang2011).
DNA extraction
Biofilms were scraped from three replicate glass slides as above and centrifuged for 5 min at 10,000 g. The supernatant was discarded and genomic DNA was extracted using a 3S DNA Isolation Kit for Environmental Samples V2.2 following the manufacturer's instructions (Shenergy Biocolor Bioscience and Technology Company, Shanghai, China).
PCR amplification of 16S rDNA
Bacterial 16S rRNA genes were amplified using the primers 357F, which contains a GC clamp (5′-C GCC CGC CGC GCG CGG CGG GCG GGG CGG GGG CAC GGG GGG CCT ACG GGA GGC AGC AG-3′) and 518R (5′-ATT ACC GCG GCT GCT GG-3′) (Muyzer et al., Reference Muyzer, de Waal and Uitterlinden1993). PCR amplification was performed in a 25 µl reaction mixture containing 0.5 µl of each primer (10 µM), 1 µl of template DNA (40–80 ng), 0.25 µl of Ex Taq (5 U µl−1), 2.5 µl of 10× PCR buffer, 2 µl of MgCl2 (25 mM) and 0.5 µl of deoxynucleotide triphosphates (10 mM each) and sterile distilled water to a final volume of 25 µl. PCR cycling was carried out in an Eppendorf Mastercycler (Eppendorf, Hamburg, Germany) thermocycler under the following conditions: an initial denaturing step at 94°C for 5 min, a touch-down thermal cycling of denaturation at 94°C for 1 min, annealing at 65–55°C for 1 min (reducing 0.5°C per cycle) and elongation at 72°C for 0.5 min. Then another fifteen PCR cycles were conducted, each cycle consisting of 1 min denaturation at 94°C, 1 min annealing at 55°C and 0.5 min synthesis at 72°C. Finally, an extension step was carried out at 72°C for 8 min. PCR products were verified by agarose gel electrophoresis (1.2% weight/volume agarose) with ethidium bromide staining and visualized using an ultraviolet (UV) transilluminator.
Denaturing gradient gel electrophoresis analyses of bacterial community
Denaturing gradient gel electrophoresis analysis (DGGE) of the PCR amplified 16S rDNA was carried out using the D-Code™ Universal Mutation Detection System (Bio-Rad, Hercules, CA, USA). PCR products were resolved on a vertical gel containing 8% (w/v) polyacrylamide (arylamide:bisacrylamide, 37.5:1) and a denaturing gradient ranging from 40 to 70%. One hundred per cent denaturant is defined as a 7 M urea and 40% (v/v) deionized formamide. Electrophoresis (60 V, 14 h) was performed in 1 × TAE buffer (40 mM Tris-acetate, 20 mM acetate, 1 mM Na2-EDTA) at 60°C. After electrophoresis, the gel was stained in ethidium bromide for 20 min and photographed under UV illumination. DGGE gel images were analysed using Quantity One analysis software (Bio-Rad). A similarity matrix was constructed based on the total number of bands observed in all biofilm bacterial communities and the presence or absence of these bands in each community. Agglomerative hierarchical clustering was performed using UPGMA (unweighted pair group method using arithmetic averages) and the similarities among communities were displayed as a dendrogram. Bacterial communities of three replicates within each treatment, at each time point were assessed using DGGE.
Mussel settlement bioassay
Plantigrades (shell length/height = 580 ± 39/431 ± 28 µm) of the mussel M. coruscus were obtained from the mussel hatchery farm of Dongtou, Zhejiang Province, China and carried, within 10 h, to Shanghai Ocean University, Shanghai. Prior to the settlement bioassay, plantigrades were maintained at 18 ± 1°C for more than 7 days and fed a diet of Isochrysis galbana at 1.0 × 10⁵ cells ml−1 day−1. In the settlement bioassay, ten plantigrades were transferred into individual glass Petri dishes (Ø64 mm × 19 mm height) containing 20 ml of AFSW and one biofilm slip. The inducing activity of biofilms was evaluated by the percentage of settled plantigrades. Settled plantigrades were verified after 12 h when they attached to the surface with byssal threads. Petri dishes, each containing 20 ml of AFSW, 10 plantigrades and a clean (non-biofilmed) glass slip were set up as negative controls (Blank) in all assays. Assays were conducted at 18 ± 1°C in darkness. Six replicates were used in assays.
Statistical analysis
Settlement inducing activities of the biofilms were evaluated by the percentages of settled plantigrades. Prior to statistical analysis, all data expressed in percentages were arcsine-transformed and tested for normality and homogeneity. Normality of distribution was assessed using the Shapiro–Wilk test. Homogeneity of variance was verified using the O'Brien test. The effects of surface wettability on biofilm activity, dry weight, bacterial and diatom densities, biofilm thickness and chlα concentrations were analysed using the Kruskal–Wallis Test. All statistical computations were performed using JMP™ software (v.10.0.0). Differences were considered significant at P < 0.05. A one-way analysis of similarity (ANOSIM, PRIMER 6, Clarke & Warwick, Reference Clarke and Warwick2001) was conducted with wettability and time point as the factors. ANOSIM computes a test statistics (R), where R = 1 if all replicates within a treatment are more similar to each other than any replicates from different treatments. R is approximately zero if the null hypothesis is true, that similarities between and within treatments are the same. Three replicates were conducted in the ANOSIM analysis. A Monte Carlo simulation where the Bray–Curtis matrix is randomly rearranged allows comparison between simulated and observed R-values and also determines the significance level at which the null hypothesis can be rejected.
RESULTS
Manipulation of surface hydrophobicity
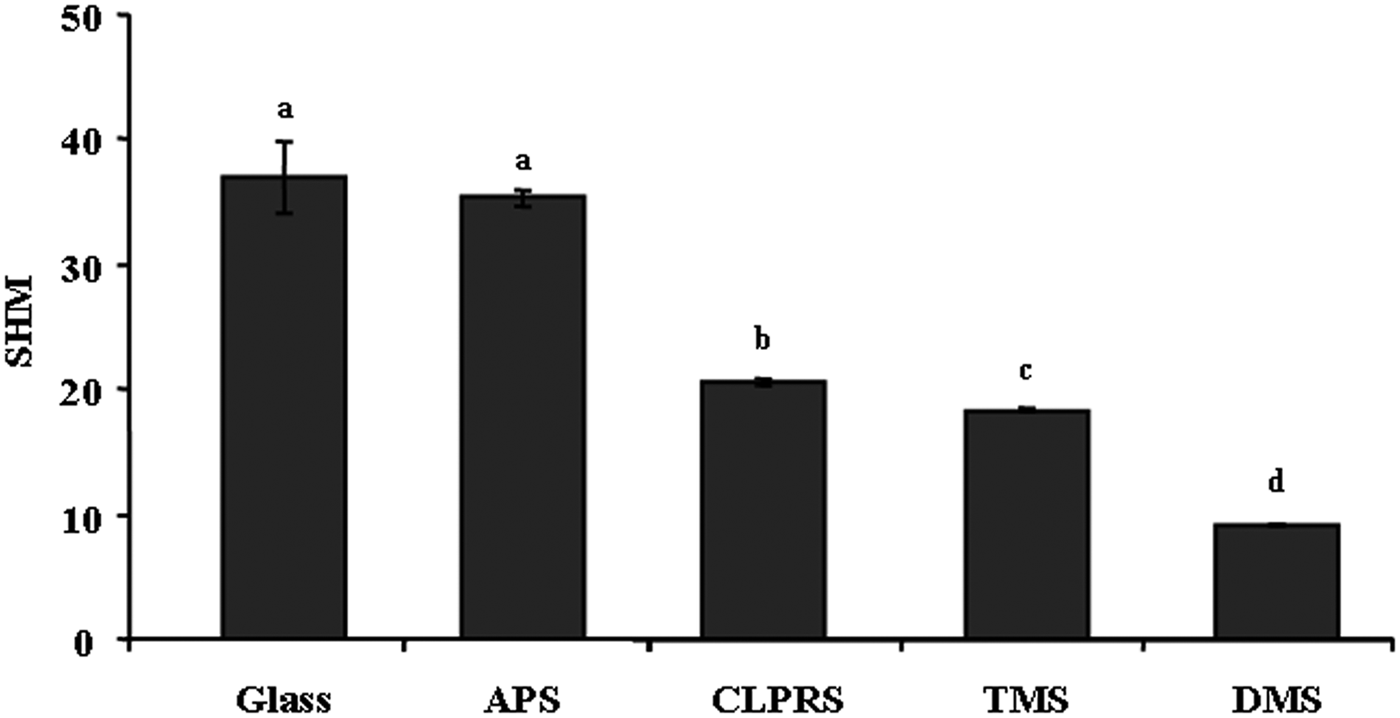
The surface wettabilities of treated and untreated glass slides are shown in Figure 1. The surface SHM values ranged from 9.14 to 36.99. The SHM value was the highest in the untreated glass slides. The SHM values in DMS and TMS were lower than others, indicating that these two treatments resulted in most hydrophobic surfaces. The SHM values of APS and CLPRS were 20.57 and 35.29, respectively.

Fig. 1. The standardized harmonic mean values of various wettability surfaces. Data with significant difference are indicated by different letters. Data are means (±standard error) of six replicates. Glass, non-treated surface of glass slides. Treatments: APS, aminopropyltriethoxysilane; CLPRS, (3-chloropropyl)trimethoxysilane; TMS, trimethylsilyl; DMS, dimethyldichlorosilane.
Plantigrade settlement in response to natural biofilms on manipulated surfaces
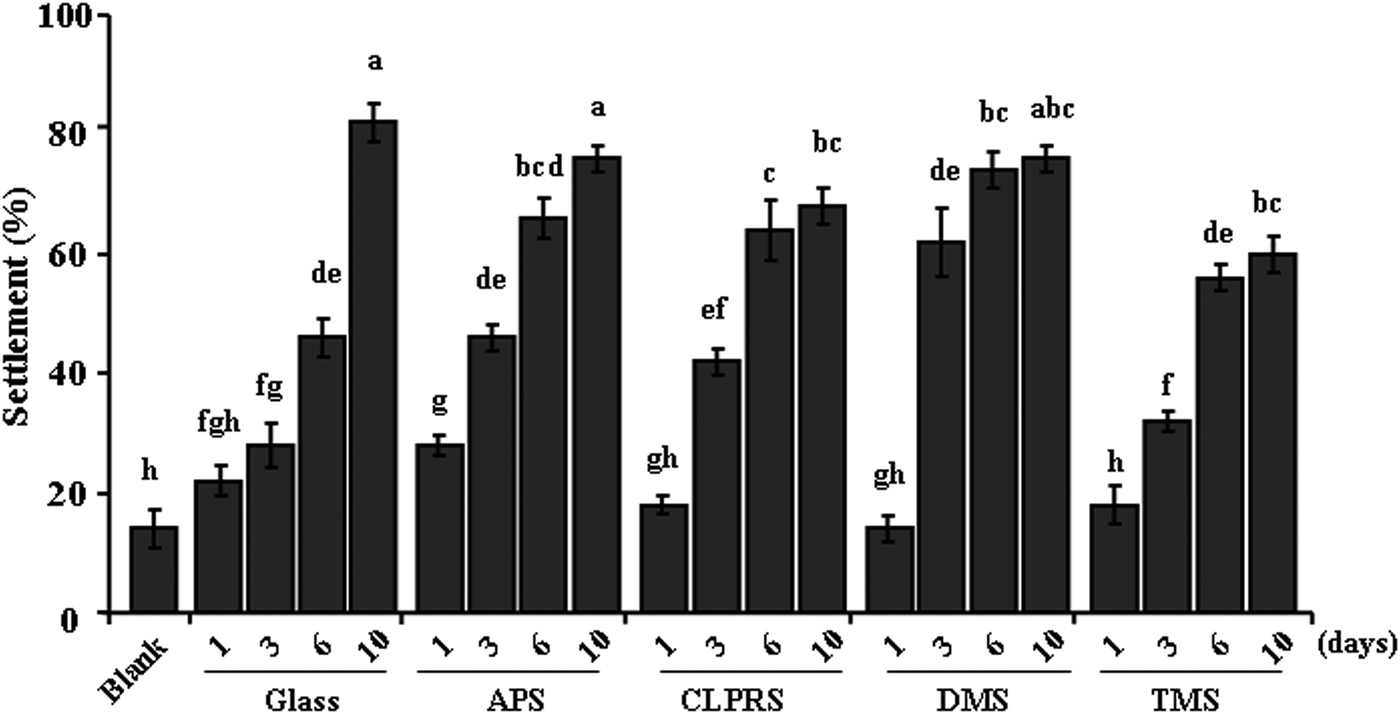
The percentages of settled plantigrades on natural biofilms formed on surfaces with different wettabilities are shown in Figure 2. In the negative controls, only 10% plantigrades settled on non-biofilmed glass slides. In general, the percentages of settlement significantly increased with the age of biofilms (Kruskal–Wallis: P < 0.001). After immersion for 1 and 3 days, no significant inhibiting effect on settlement rates was observed among the manipulated surfaces (Kruskal–Wallis: P > 0.05). After 6 days, no significant decrease in percentages of settlement was observed in surfaces treated by APS and TMS (Kruskal–Wallis: P > 0.05), whereas settlement rates increased significantly in surfaces treated by CLPRS and DMS (Kruskal–Wallis: P < 0.05) when compared to non-treated Glass. After 10 days, there were significantly lower settlement rates in surfaces treated by CLPRS and TMS (Kruskal–Wallis: P < 0.05), while no difference was observed in surfaces treated by APS and DMS (Kruskal–Wallis: P > 0.05).

Fig. 2. Percentages of plantigrade settlement on natural biofilms formed on different wettability surfaces. Data with significant difference are indicated by different letters. Data are means (±standard error) of six replicates. Blank, non-biofilmed glass slides. Glass, non-treated glass slides. Treatments: APS, aminopropyltriethoxysilane; CLPRS, (3-chloropropyl)trimethoxysilane; TMS, trimethylsilyl; DMS, dimethyldichlorosilane.
Dry weight, bacterial and diatom densities on manipulated
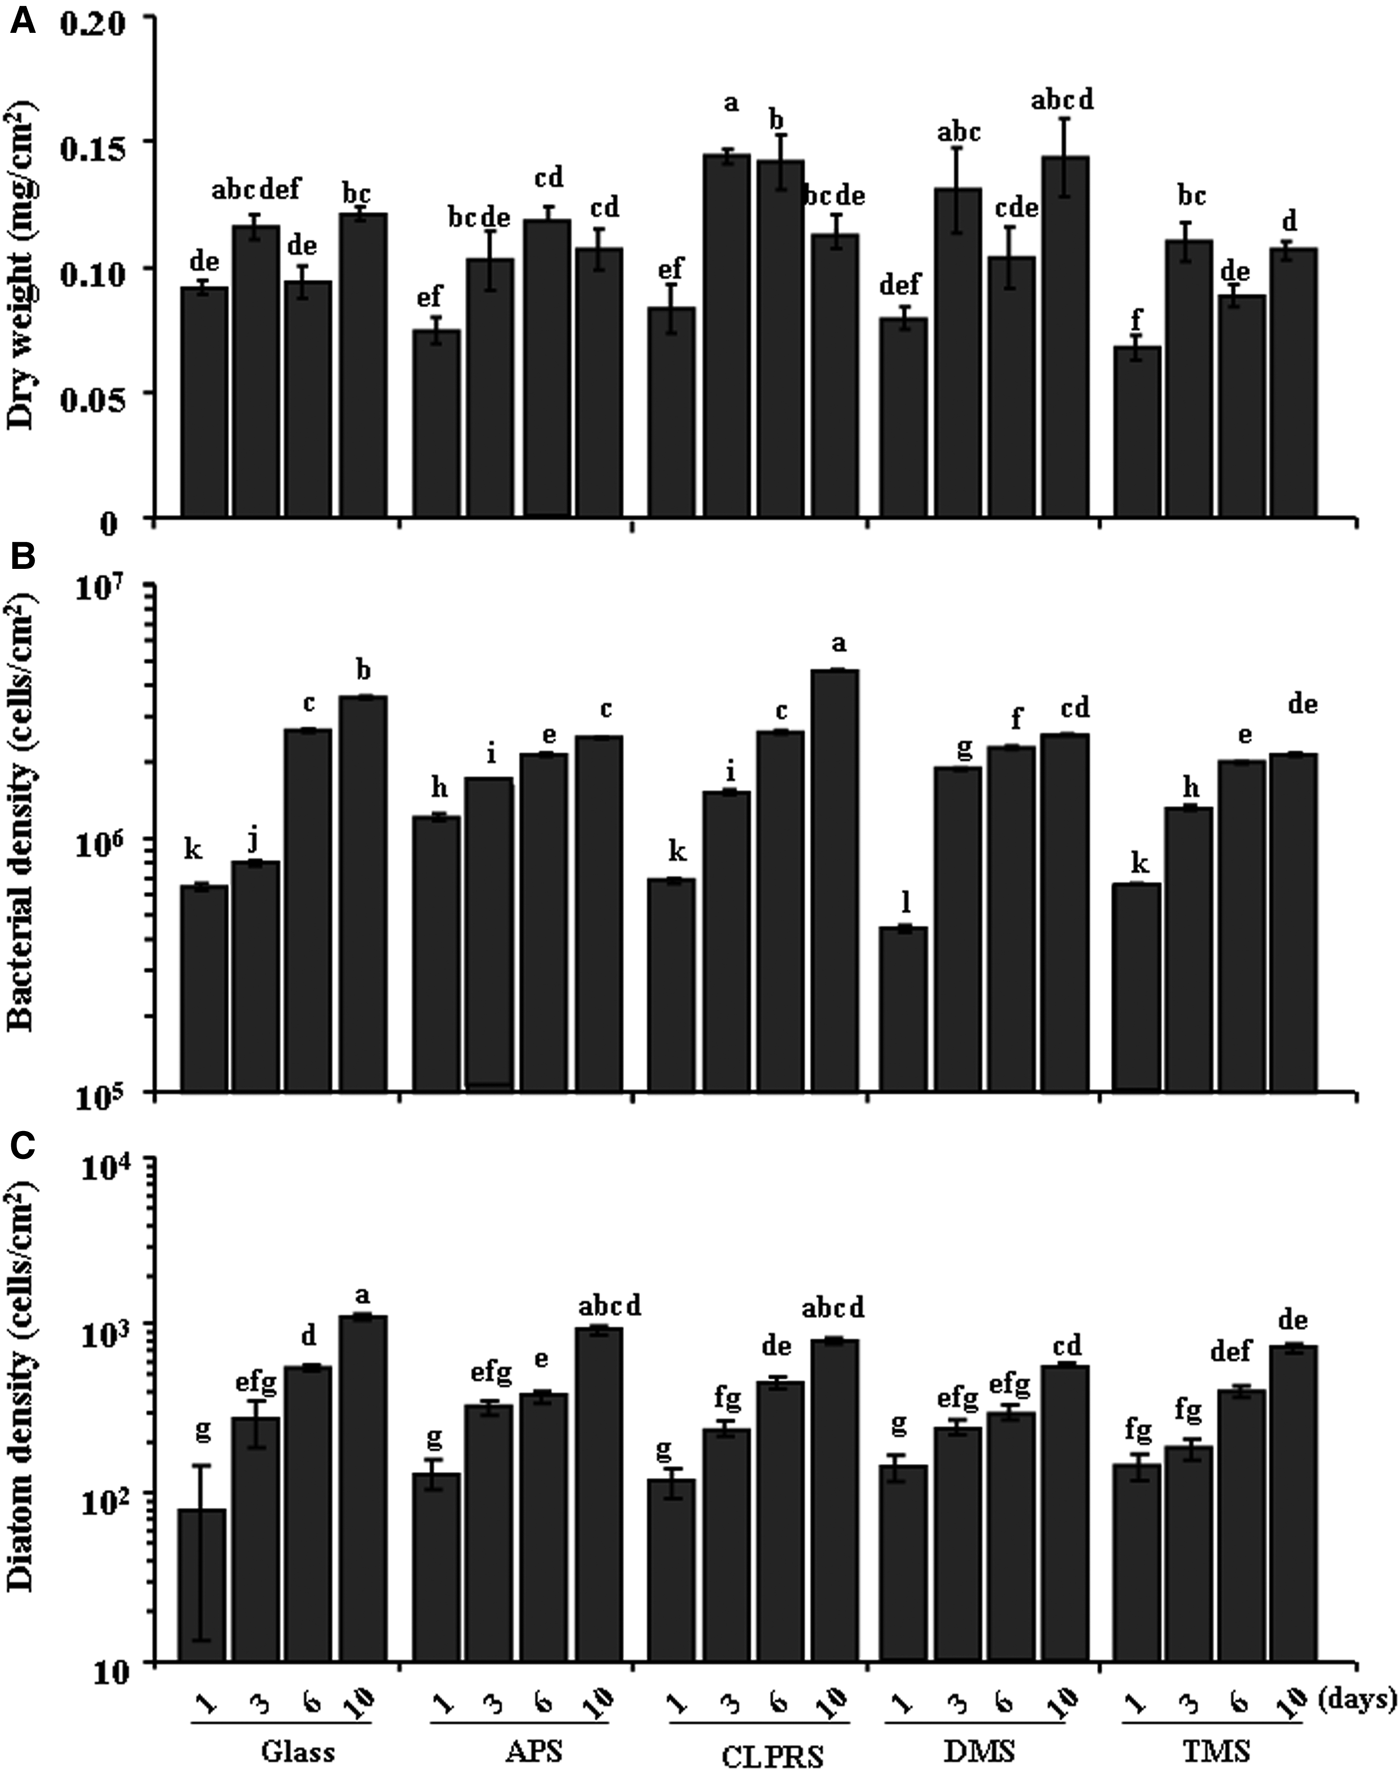
The dry weights and the bacterial and diatom densities of biofilms at different wettabilities are shown in Figure 3. For the dry weight (Figure 3A), significant decrease was observed on surfaces treated by TMS after 1 and 10 days when compared with the untreated Glass. In contrast, there was no decrease in all treated surfaces after 3 and 6 days. In the bacterial densities (Figure 3B), the cell density only decreased in surfaces treated by DMS after 1 day (Kruskal–Wallis: P < 0.05). After 3 days, bacterial density increased compared with the untreated Glass (Kruskal–Wallis: P < 0.05). After 6 and 10 days, bacterial density decreased significantly in all treated surfaces except for that treated by CLPRS (Kruskal–Wallis: P < 0.05). In the case of diatom density (Figure 3C), no significant decrease was observed in all surfaces treated after 1 day (Kruskal–Wallis: P > 0.05) and 3 days (Kruskal–Wallis: P > 0.05). After 6 days, diatom density decreased significantly in surfaces treated by APS and DMS (Kruskal–Wallis: P < 0.05). After 10 days, there was significant decrease in surfaces treated by DMS and TMS (Kruskal–Wallis: P < 0.05).

Fig. 3. Dry weights (A), bacterial densities (B) and diatom densities (C) of biofilms formed on surfaces of different wettabilities. Data with significant difference are indicated by different letters. Dry weights are means (±standard error) of six replicates. Bacterial and diatom densities are means (±SE) of 10 random fields of view. Glass, non-treated glass slides. Treatments: APS, aminopropyltriethoxysilane; CLPRS, (3-chloropropyl)trimethoxysilane; DMS, dimethyldichlorosilane; TMS, trimethylsilyl.
Biofilm thickness
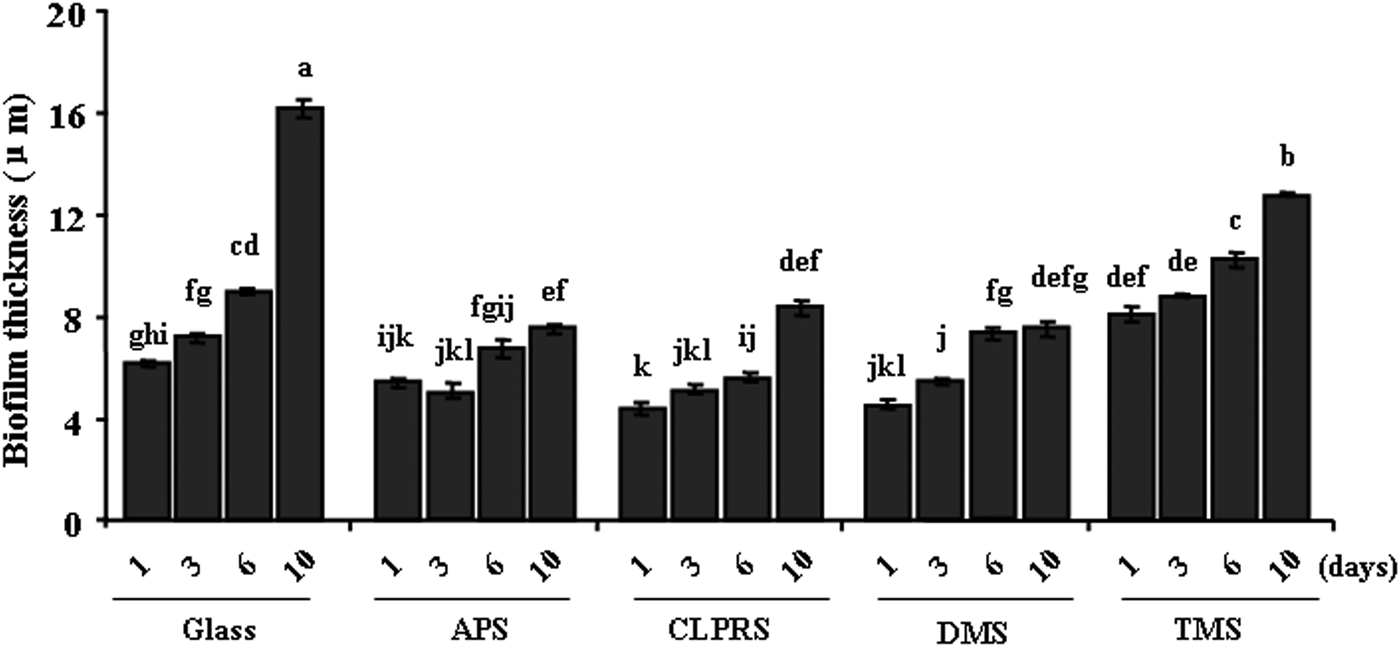
Confocal laser scanning microscope images of natural biofilms on surfaces of different wettabilities are shown in Figure 4. Significant difference was observed in surfaces treated with APS compared to Glass after 10 days, while both exhibited similar inducing activity on settlement of plantigrades. The thickness of biofilms on surfaces of different wettabilities is shown in Figure 5. Surface wettability affected significantly the thickness of natural biofilms. In addition, biofilm age significantly affected the thickness of the biofilm. The biofilm thickness on all surfaces increased with the increasing biofilm age (Kruskal–Wallis: P < 0.05), the maximum being obtained after 10 days.

Fig. 4. Confocal microscopy micrographs of natural biofilms on different wettability surfaces. Glass-1d, 1 day-biofilms formed on non-treated glass slides; Glass-3d, 3 day-biofilms formed on non-treated glass slides; Glass-6d, 6 day-biofilms formed on non-treated glass slides; Glass-10d, 10 day-biofilms formed on non-treated glass slides. Treatments: APS-1d, 1 day-biofilms formed on surfaces treated with minopropyltriethoxysilane; APS-3d, 3 day-biofilms formed on surfaces treated with minopropyltriethoxysilane; APS-6d, 6 day-biofilms formed on surfaces treated with minopropyltriethoxysilane; APS-10d, 10 day-biofilms formed on surfaces treated with minopropyltriethoxysilane; CLPRS-1d, 1 day-biofilms formed on surfaces treated with (3-chloropropyl)trimethoxysilane; CLPRS-3d, 3 day-biofilms formed on surfaces treated with (3-chloropropyl)trimethoxysilane; CLPRS-6d, 6 day-biofilms formed on surfaces treated with (3-chloropropyl)trimethoxysilane; CLPRS-10d, 10 day-biofilms formed on surfaces treated with (3-chloropropyl)trimethoxysilane; DMS-1d, 1 day-biofilms formed on surfaces treated with dimethyldichlorosilane; DMS-3d, 3 day-biofilms formed on surfaces treated with dimethyldichlorosilane; DMS-6d, 6 day-biofilms formed on surfaces treated with dimethyldichlorosilane; DMS-10d, 10 day-biofilms formed on surfaces treated with dimethyldichlorosilane; TMS-1d, 1 day-biofilms formed on surfaces treated with trimethylsilyl; TMS-3d, 3 day-biofilms formed on surfaces treated with trimethylsilyl; TMS-6d, 6 day-biofilms formed on surfaces treated with trimethylsilyl; TMS-10d, 10 day-biofilms formed on surfaces treated with trimethylsilyl.

Fig. 5. The thickness of natural biofilms on different wettability surfaces. Data with significant difference are indicated by different letters. Data are means (±standard error) of 30 replicates. Glass, non-treated glass slides. Treatments: APS, aminopropyltriethoxysilane; CLPRS, (3-chloropropyl)trimethoxysilane; DMS, dimethyldichlorosilane; TMS, trimethylsilyl.
Chlα analysis
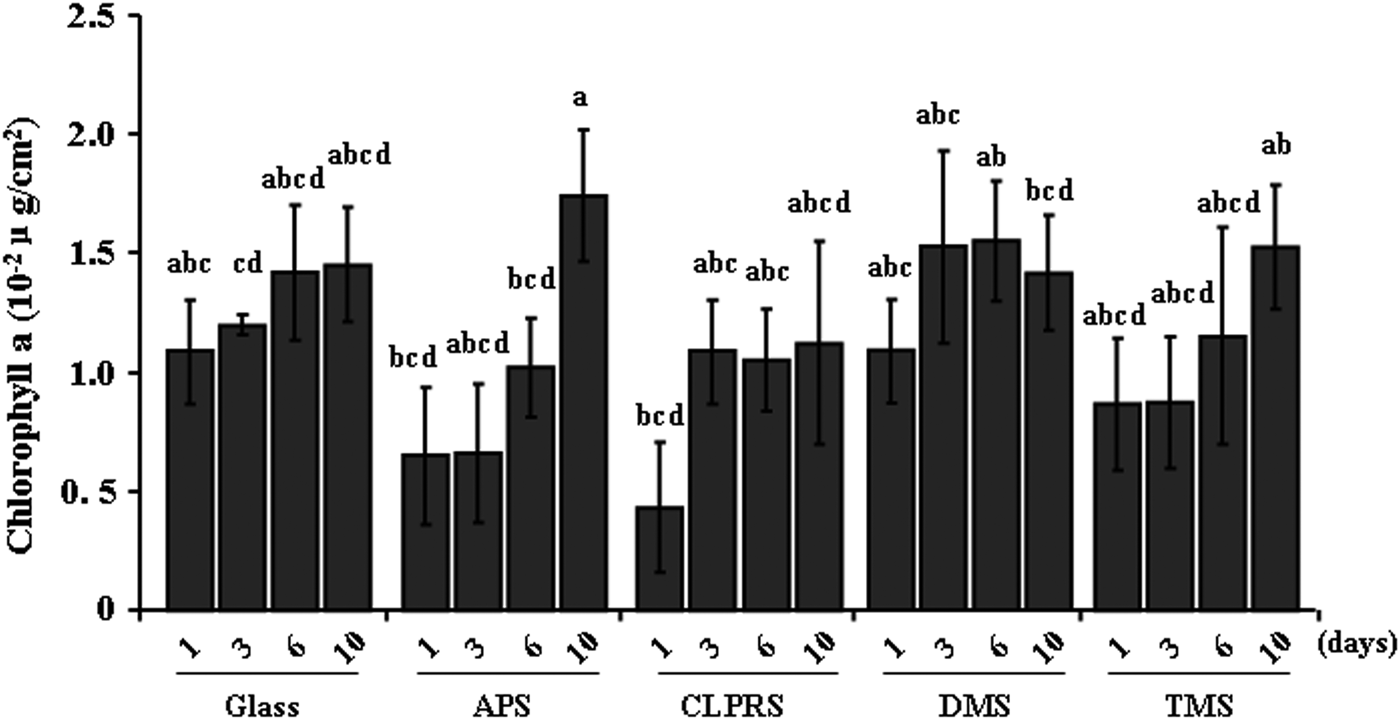
The chl a concentrations in the biofilms on surfaces of different wettabilities are as shown in Figure 6. No significant difference was observed among all surfaces of different wettabilities even after 10 days (Kruskal–Wallis: P > 0.05). The minimum and maximum chl a concentrations were, respectively, 0.004 µg cm−2 on the surface treated by CLPRS after 1 day and 0.017 µg cm−2 on the surface treated by APS after 10 days.

Fig. 6. Chlorophyll-a concentration in natural biofilms on different wettability surfaces. Data with significant difference are indicated by different letters. Data are means (±standard error) of six replicates. Glass, non-treated glass slides. Treatments: APS, aminopropyltriethoxysilane; CLPRS, (3-chloropropyl)trimethoxysilane; DMS, dimethyldichlorosilane; TMS, trimethylsilyl.
Bacterial community analysis by DGGE
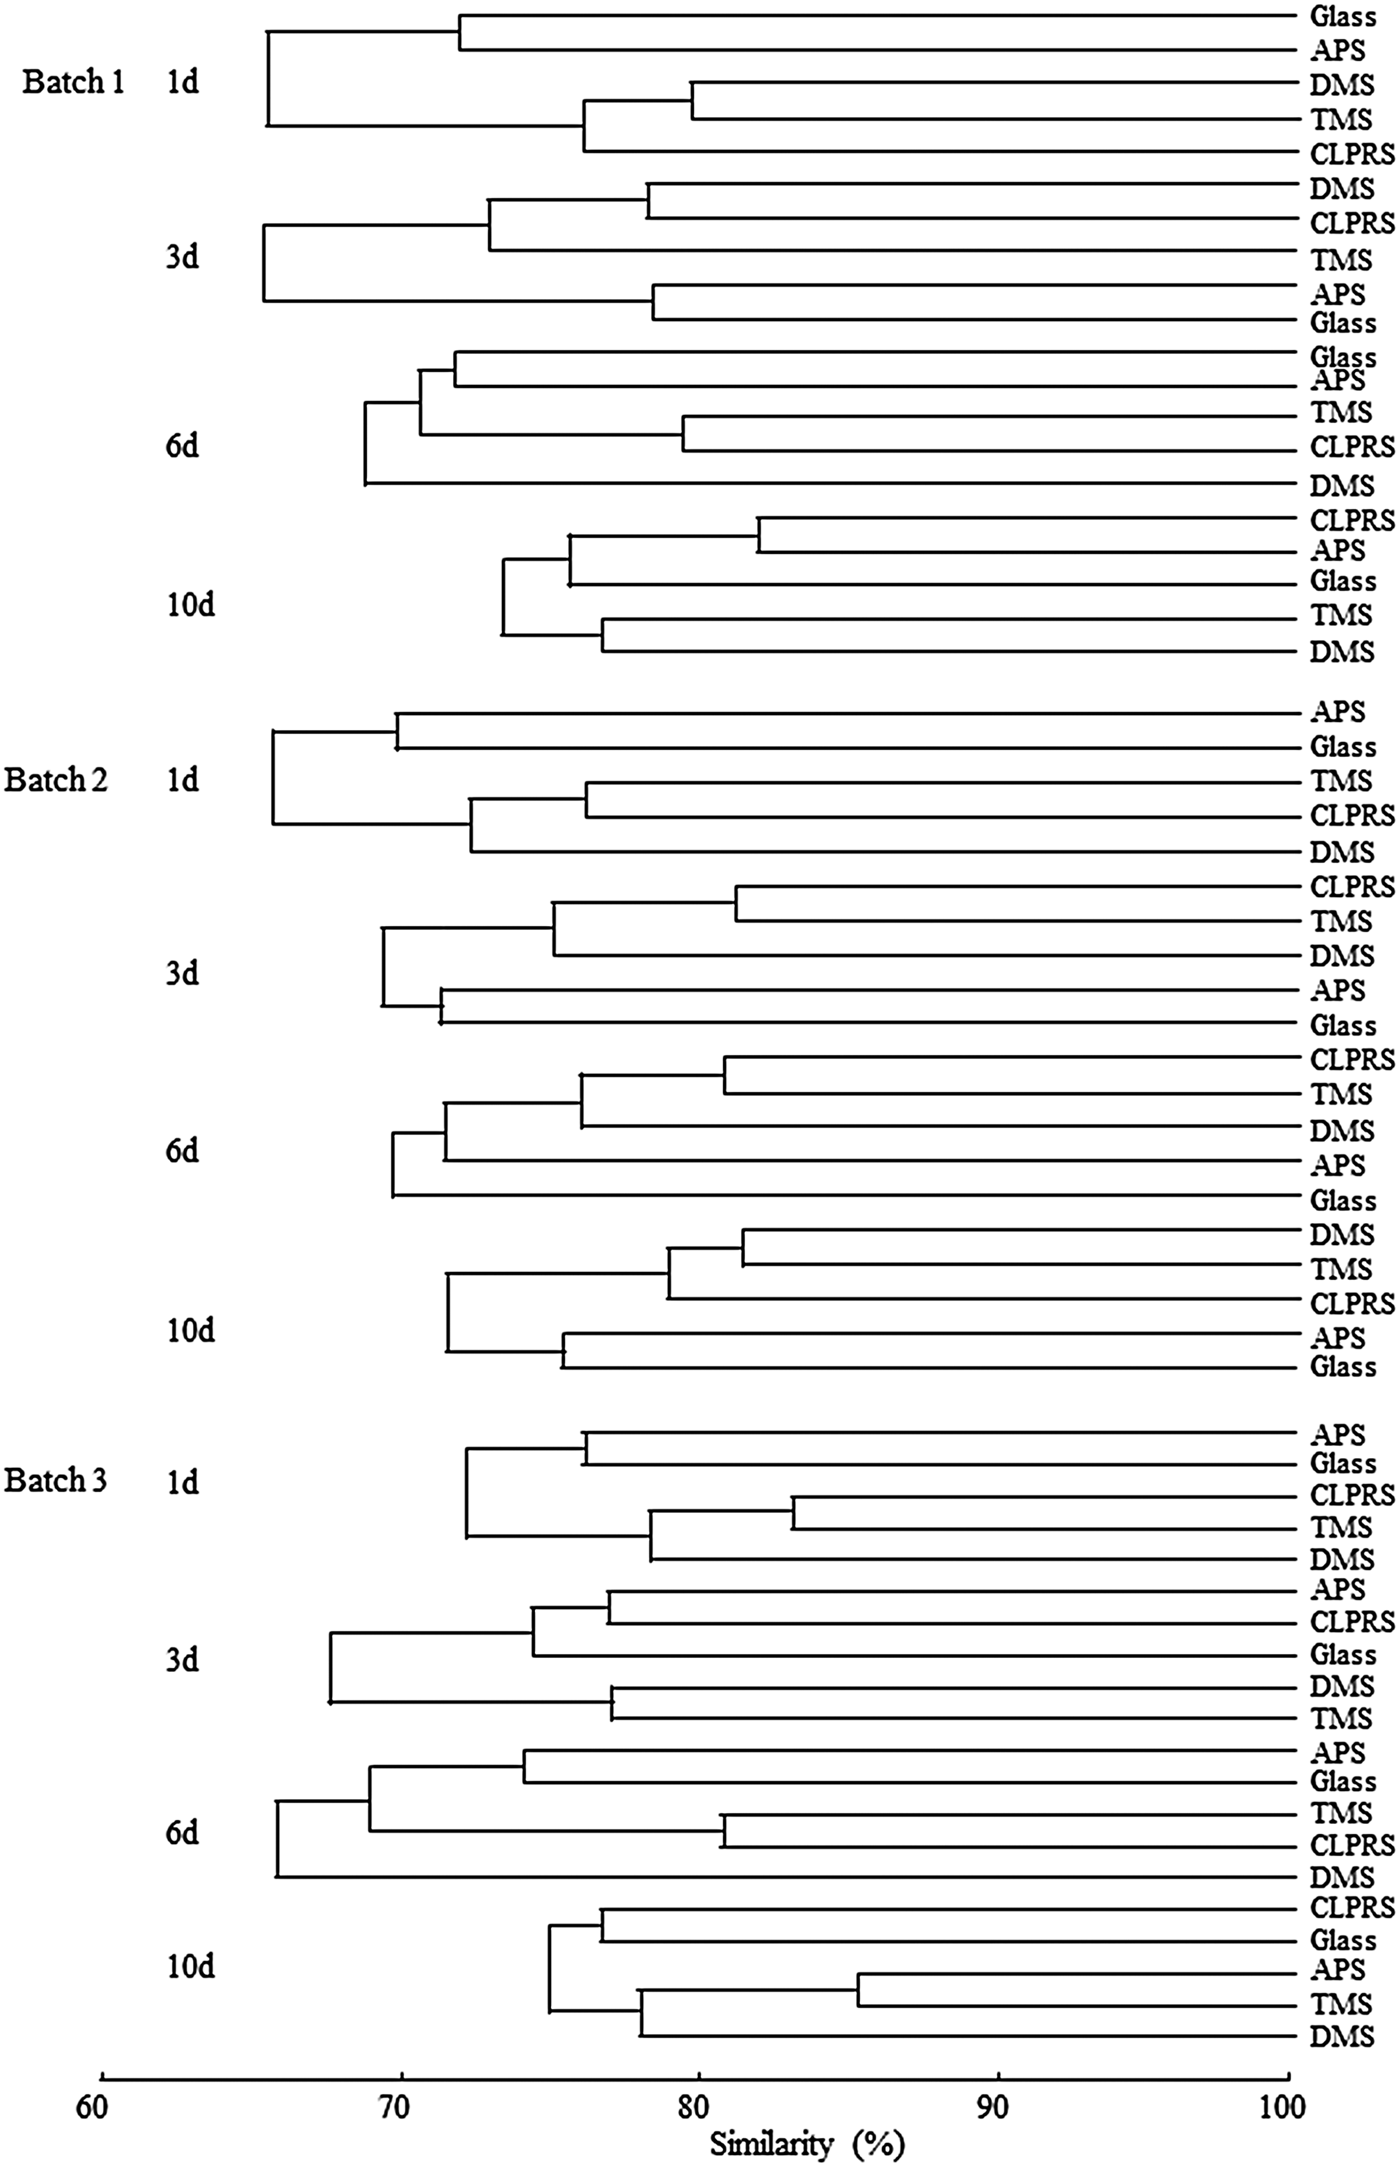
Comparative analysis of bacterial DGGE patterns using Bray–Curtis cluster analysis is shown in Figure 7. In general, Bray–Curtis cluster analysis showed that the variability between the various surface treatments was high. For 1 day-biofilms (Batch 1), cluster analysis revealed that the similarity between untreated Glass and surfaces treated by APS was 72%, and that two biofilms shared 65% with biofilms on other manipulated surfaces. A similar tendency was also found for 3 day-biofilms and 6 day-biofilms (Batch 1). For 10 day-biofilms (Batch 1), cluster analysis revealed that the variability between surfaces treated by DMS and TMS was the greatest (23%), and the variability between untreated Glass and surfaces treated by APS was the least (18%). For Batch 2, cluster analysis of bacterial communities in 1 day-biofilms revealed that the similarity between untreated Glass and surfaces treated by APS was 76%, and that two biofilms shared 72% with biofilms on other manipulated surfaces. For 3 day-biofilms and 6 day-biofilms, cluster analysis revealed that the variability between surfaces treated by CLPRS and TMS was the least (<20%). For 10 day-biofilms, cluster analysis revealed that the variability between untreated Glass and surfaces treated by APS was the greatest (24%), and the variability between surfaces treated by DMS and TMS was the least (18%). For Batch 3, cluster analysis of bacterial communities in 1 day-biofilms revealed that the similarity between untreated Glass and surfaces treated by APS was 76%, and that two biofilms shared 72% with biofilms on other manipulated surfaces. For 3 day-biofilms, cluster analysis revealed that the variability between surfaces treated by CLPRS and APS and between surfaces treated by DMS and TMS were the same (23%). For 6 day-biofilms, cluster analysis revealed that the variability between untreated Glass and surfaces treated by APS was the greatest (26%), and the variability between surfaces treated by TMS and CLPRS was the least (19%). For 10 day-biofilms, cluster analysis revealed that the variability between untreated Glass and surfaces treated by CLPRS was the greatest (23%), and the variability between surfaces treated by APS and TMS was the least (15%).

Fig. 7. Dendrogram generated from the denaturing gradient gel electrophoresis analysis profiles, showing the similarities of bacterial community composition of biofilms. Glass, non-treated glass slides. Treatments: APS, aminopropyltriethoxysilane; CLPRS, (3-chloropropyl)trimethoxysilane; DMS, dimethyldichlorosilane; TMS, trimethylsilyl.
The ANOSIM test was performed to determine the similarity between treatments. R-values were interpreted as follows: R > 0.75 as well separated, R > 0.5 as overlapping, but clearly different, and R < 0.25 as barely separable at all, in accordance with the PRIMER-manual (Clarke & Warwick, Reference Clarke and Warwick2001). For 1, 3 and 10 day-biofilms, difference between bacterial communities on the manipulated surfaces were observed, which all had an R value of >0.5. For 6 day-biofilms, significant difference between bacterial communities on the manipulated surfaces were observed, which both had an R value of >0.75. In addition, the ANOSIM test was also performed to determine the similarity between different-aged biofilms on each surface. For untreated Glass, no significant differences between bacterial communities on biofilms of four ages were observed; all had an R value of <0.25. For the treated surfaces a similar tendency was also observed in biofilms of four ages.
DISCUSSION
The effect of biofilms on the recruitment of marine invertebrates could depend on substrate characteristics (Terlizzi & Faimali, Reference Terlizzi, Faimali, Dürr and Thomason2010). However, interaction between substrate and biofilm in affecting larval settlement remains little known (Faimali et al., Reference Faimali, Garaventa, Terlizzi, Chiantore and Cattaneo-Vietti2004). In the present study, the authors demonstrated that surface wettability affected the formation of natural biofilms, and this difference in biofilms might result in the variance of attracting settlement of plantigrades of M. crouscus.
Previous studies reported that there was no significant difference in the bacterial density between the surfaces with different wettabilities (Hung et al., Reference Hung, Thiyagarajan and Qian2008). Similarly, Huggett et al. (Reference Huggett, Nedved and Hadfield2009) also demonstrated no difference between cell densities of bacteria in biofilms formed on treated surfaces of various wettabilites. However, the results of the present study are not consistent with the above studies (Hung et al., Reference Hung, Thiyagarajan and Qian2008; Huggett et al., Reference Huggett, Nedved and Hadfield2009), since significant decrease in bacterial densities was found on low wettability surfaces (TMS) when compared with the control after 10 days. Dalton et al. (Reference Dalton, Poulsen, Halasz, Angles, Goodman and Marshall1994) also suggested that surface wettability affects bacterial attachment. The possible explanation is that surface wettability may exert some control over the molecular rearrangements that occur on the surface of the bacteria causing different domains to be exposed (Maki et al., Reference Maki, Rittschof, Samuelsson, Szewzyk, Yule, Kjelleberg, Costlow and Mitchell1990).
In the laboratory assays, some fouling diatom species adhered more strongly to hydrophobic surfaces than to hydrophilic surfaces (Finlay et al., Reference Finlay, Callow, Ista, Lopez and Callow2002; Holland et al., Reference Holland, Dugdale, Wetherbee, Brennan, Finlay, Callow and Callow2004; Thompson et al., Reference Thompson, Taylor, Brownlee, Callow and Callow2008). In the field assays, diatom community composition was influenced by surface wettability (Hung et al., Reference Hung, Thiyagarajan and Qian2008). The results of the present study demonstrated that surface wettability affected attachment of diatoms in natural biofilms, and that the diatom densities were reduced significantly on low wettability surfaces (DMS and TMS) when compared to the control. This indicates that hydrophobic surfaces may limit diatom attachment in the marine environment.
In the present study, surface wettability resulted in a decrease in the dry weight of 1 day-biofilms and 10 day-biofilms formed on surfaces treated by TMS, while no significant decrease was observed for other manipulated surfaces. On the other hand, surface wettabiltiy affected the biofilm thickness, and the thickness of biofilms, especially the 10 day-biofilm thickness, decreased significantly on surfaces of medium and low wettabilities in the present investigation. These findings for the first time demonstrate that surface wettability influences the abundance of natural biofilms, and that subsequently this variation may account for the discrepancy of mussel settlement rates.
Chlorophyll-a has been used as an indicator of biomass of photosynthetic organisms in biofilms (Thompson et al., Reference Thompson, Tobin, Hawkins and Norton1999; von der Meden et al., Reference von der Meden, Porri, McQuaid, Faulkner and Robey2010). The present results showed that chl a concentration was similar in the biofilms formed on the different wettability surfaces, indicating that chl a is independent of the initial wettability of a surface.
Recent studies suggested that no obvious difference was observed in biofilm bacterial community composition between low and high wettability substratum (Hung et al., Reference Hung, Thiyagarajan and Qian2008). Huggett et al. (Reference Huggett, Nedved and Hadfield2009) also demonstrated that the community composition of marine biofilms on all surfaces was largely the same across all surfaces, indicating that the formation of a biofilm community on hard surfaces was not influenced by the initial wettability of that surface. However, in the present investigation, ANOSIM of DGGE profiles showed that the R values between the various surface treatments ranged from 0.63 to 1.00, suggesting that surface wettability influenced the bacterial community in biofilms formed on Gouqi Island, China. Subsequent investigation also demonstrated that mussel plantigrades preferred to settle on biofilms formed on high wettability surfaces. This finding indicates that the differences in the bacterial community may contribute to the variance of the settlement-inducing activities of these biofilms.
Biofilm age affects settlement and metamorphosis of larvae of many marine invertebrates (Huggett et al., Reference Huggett, Nedved and Hadfield2009; Yu et al., Reference Yu, He, Li, Yan and Lin2010; Campbell et al., Reference Campbell, Meritt, Franklin, Boone, Nicely and Brown2011). For mussels, larval settlement in particular is positively correlated with the age of the biofilm, and enhanced larval settlement corresponds to the abundance and composition of the biofilm community (Bao et al., Reference Bao, Satuito, Yang and Kitamura2007a; Toupoint et al., Reference Toupoint, Mohit, Linossier, Bourgougnon, Myrand, Olivier, Lovejoy and Tremblay2012; Wang et al., Reference Wang, Bao, Gu, Li, Liang, Ling, Cai, Shen and Yang2012). In the present study, plantigrade settlement of M. coruscus also increased with biofilm age. This finding on mussel plantigrade settlement is consistent with previous reports on mussel larval settlement (Bao et al., Reference Bao, Satuito, Yang and Kitamura2007a; Toupoint et al., Reference Toupoint, Mohit, Linossier, Bourgougnon, Myrand, Olivier, Lovejoy and Tremblay2012; Wang et al., Reference Wang, Bao, Gu, Li, Liang, Ling, Cai, Shen and Yang2012). On the other hand, previous studies also suggested that the positive effects of aged biofilm could override the negative effect of low surface wettability on larval settlement (Hung et al., Reference Hung, Thiyagarajan and Qian2008). Huggett et al. (Reference Huggett, Nedved and Hadfield2009) showed that bacterial community composition of biofilms that accumulated on surfaces over a 10-day period of immersion was similar, regardless of initial surface wettability. By contrast, the results of the present study demonstrated that the percentage of plantigrade settlement was reduced on the surfaces treated by TMS after 10 days when compared to the controls. The possible explanation is due to the difference of biofilms formed in the different sea areas or due to the variation among species tested. Further research is need.
In conclusion, this study demonstrated that surface wettability can affect the formation of natural biofilms, and the variation in biofilm characteristics, such as dry weight, bacterial and diatom densities, thickness and bacterial community for different surface wettabilities may contribute to the discrepancy of their corresponding effect in inducing plantigrade settlement of the mussel M. coruscus. The present study provides novel information about the interactions between mussel settlement, biofilm characteristics and surface wettability.
FINANCIAL SUPPORT
This study was supported by the Shanghai Municipal Science and Technology Commission (12230502100), National Natural Science Foundation of China (No. 31101885), Innovation Program of Shanghai Municipal Education Commission (14ZZ143), Shanghai Universities First-class Disciplines Project of Fisheries to J-L Yang, by the Innovation Plan of Shanghai Graduate Education to Y-F Li and by Shanghai Outstanding Undergraduate Scholarship for Interdisciplinary Training to X-P Guo.


