INTRODUCTION
The Balearic Islands form a topographic barrier separating two sub-basins, the North-western Basin and the Algerian Basin, where different water masses pass through. Atlantic Water (recent AW) dominates the surface layer of the Algerian Basin, while the saltier Mediterranean Surface Water (MW) is prevalent in the North-western Basin (Pinot et al., Reference Pinot, López-Jurado and Riera2002). Different processes such as the formation of deep water in the Gulf of Lions (Estrada et al., Reference Estrada, Vives, Alcaraz and Margalef1985), permanent frontal systems (Estrada & Salat, Reference Estrada, Salat and Ros1989) and river run-off serve to increase primary production in the North-western Basin, causing MW to have a higher concentration of nutrients than recent AW when they meet in the Balearic Sea (Fernández de Puelles & Molinero, Reference Fernández de Puelles and Molinero2007). Circulation through the Balearic Channels is complex due to mesoscale processes (Pinot et al., Reference Pinot, López-Jurado and Riera2002). In general, the Ibiza Channel funnels MW as it moves southward, while the Mallorca Channel is the main route for the northward progression of recent AW. However, seasonal or interannual variation of this general scheme has been observed. Severe conditions intensify the Northern Current increasing the presence of MW in the Mallorca Channel.
Winter or early spring phytoplankton blooms are characteristic of the Mediterranean (Siokou-Frangou et al., Reference Siokou-Frangou, Christaki, Mazzocchi, Montresor, Ribera d'Alcalà, Vaqué and Zingone2009). These increases are generally triggered by periods of high atmospheric pressure, causing an interval of stable water column. The rapid growth of the phytoplankton is then stimulated by this transient stratification of the water column, together with the presence of nutrients in the euphotic layer due to previous winter mixing (Duarte et al., Reference Duarte, Agustí, Kennedy and Vaqué1999). In the Mallorca Channel phytoplankton blooms usually take place in January–February as well as in May (Fernandez de Puelles et al., Reference Fernández de Puelles, Alemany and Jansá2007).
The pattern of phytoplankton succession was originally described by Margalef (Reference Margalef and Buzzi-Traverso1958, Reference Margalef1963a, Reference Margalefb), using samples partly from the Western Mediterranean. Three stages were defined (Margalef, Reference Margalef1963a; Smayda, Reference Smayda and Morris1980). Stage I, typical of turbulent and nutrient-enriched waters, is dominated by species with fast replication rates, including nanoflagellates and fast-growing diatoms. Stage II includes larger diatoms with lower growth rates and dinoflagellates. At the end of this stage, in addition to slow-growing diatoms, there is an increase in the presence of dinoflagellates and coccolithophores. Some authors consider this final phase of Stage II as an independent stage (Smayda, Reference Smayda and Morris1980). Stage III takes place when the water column is well stratified and the nutrients decrease. It is characterized by motile species with low growth rates, particularly dinoflagellates.
The objective of this study is to describe the variation in phytoplankton composition in a neritic area of the Mallorca Channel (Balearic Islands) during an annual cycle.
MATERIALS AND METHODS
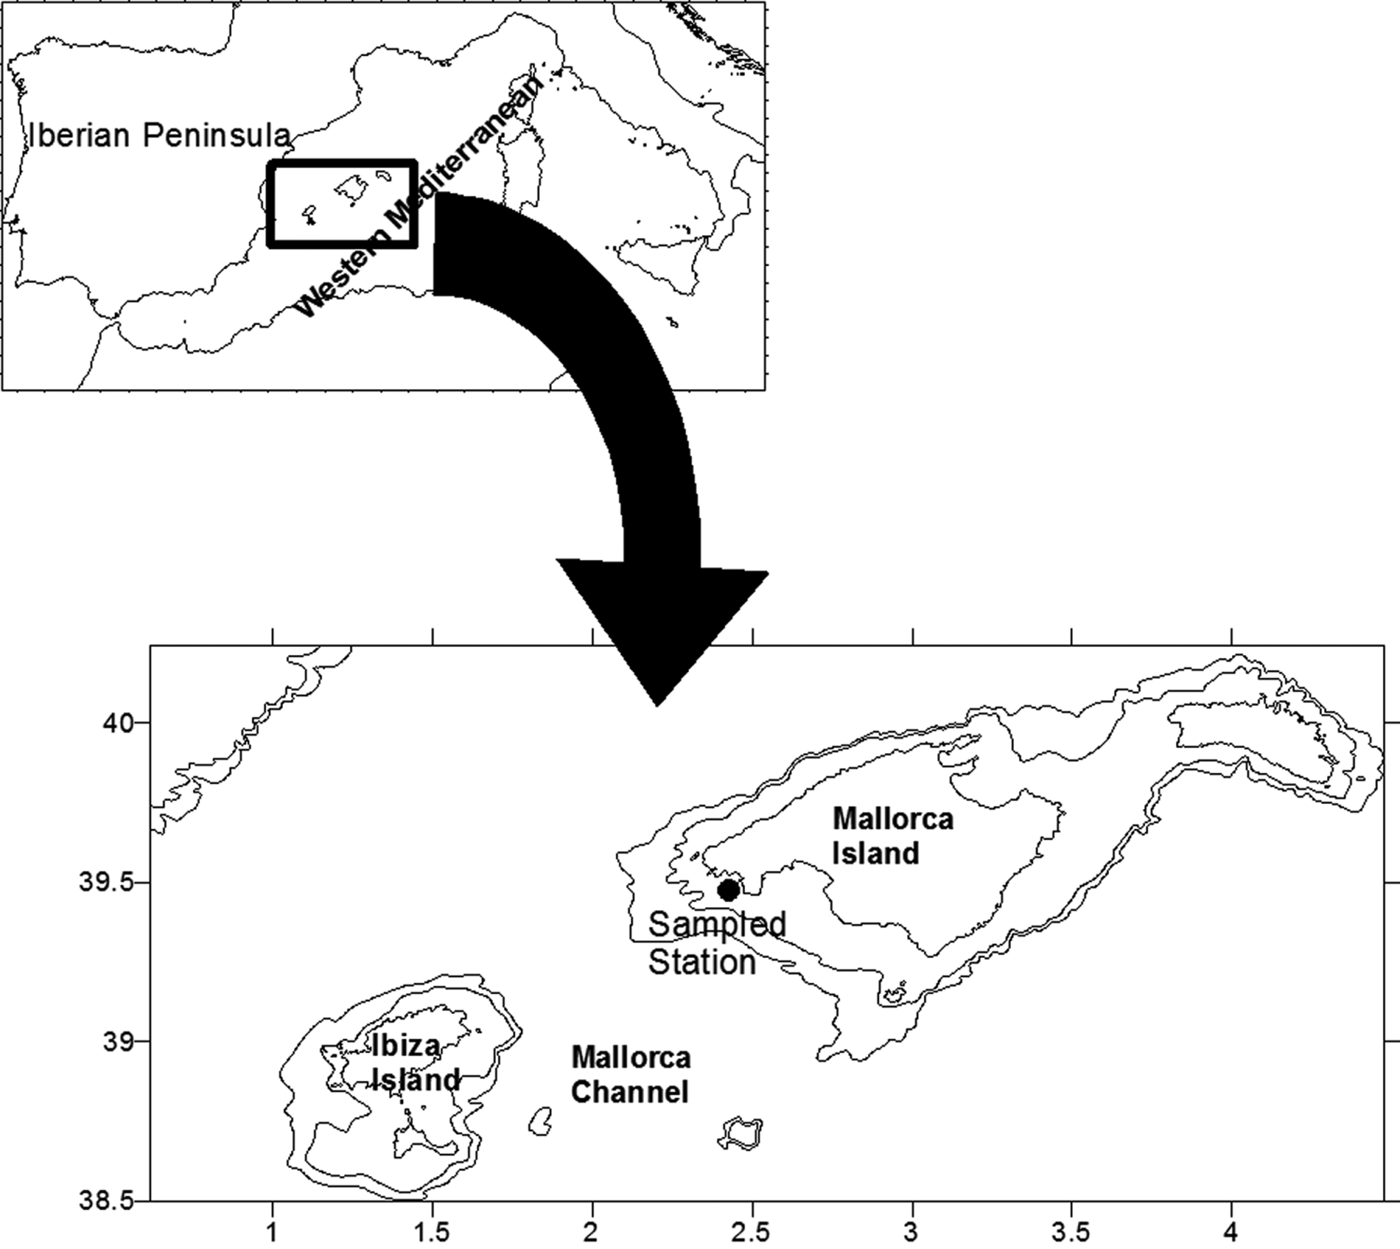
From September 2000 to September 2001 a station, 77 m depth, located on the southern shelf of Mallorca Island (Figure 1) was sampled approximately every 12 days. Water samples were collected at fixed depths of 5, 15, 25, 50 and 75 m using 5 L Niskin bottles. CTD data were recorded with a CTD Seabird 19 or CTD Seabird 25, calibrated every 2 years.
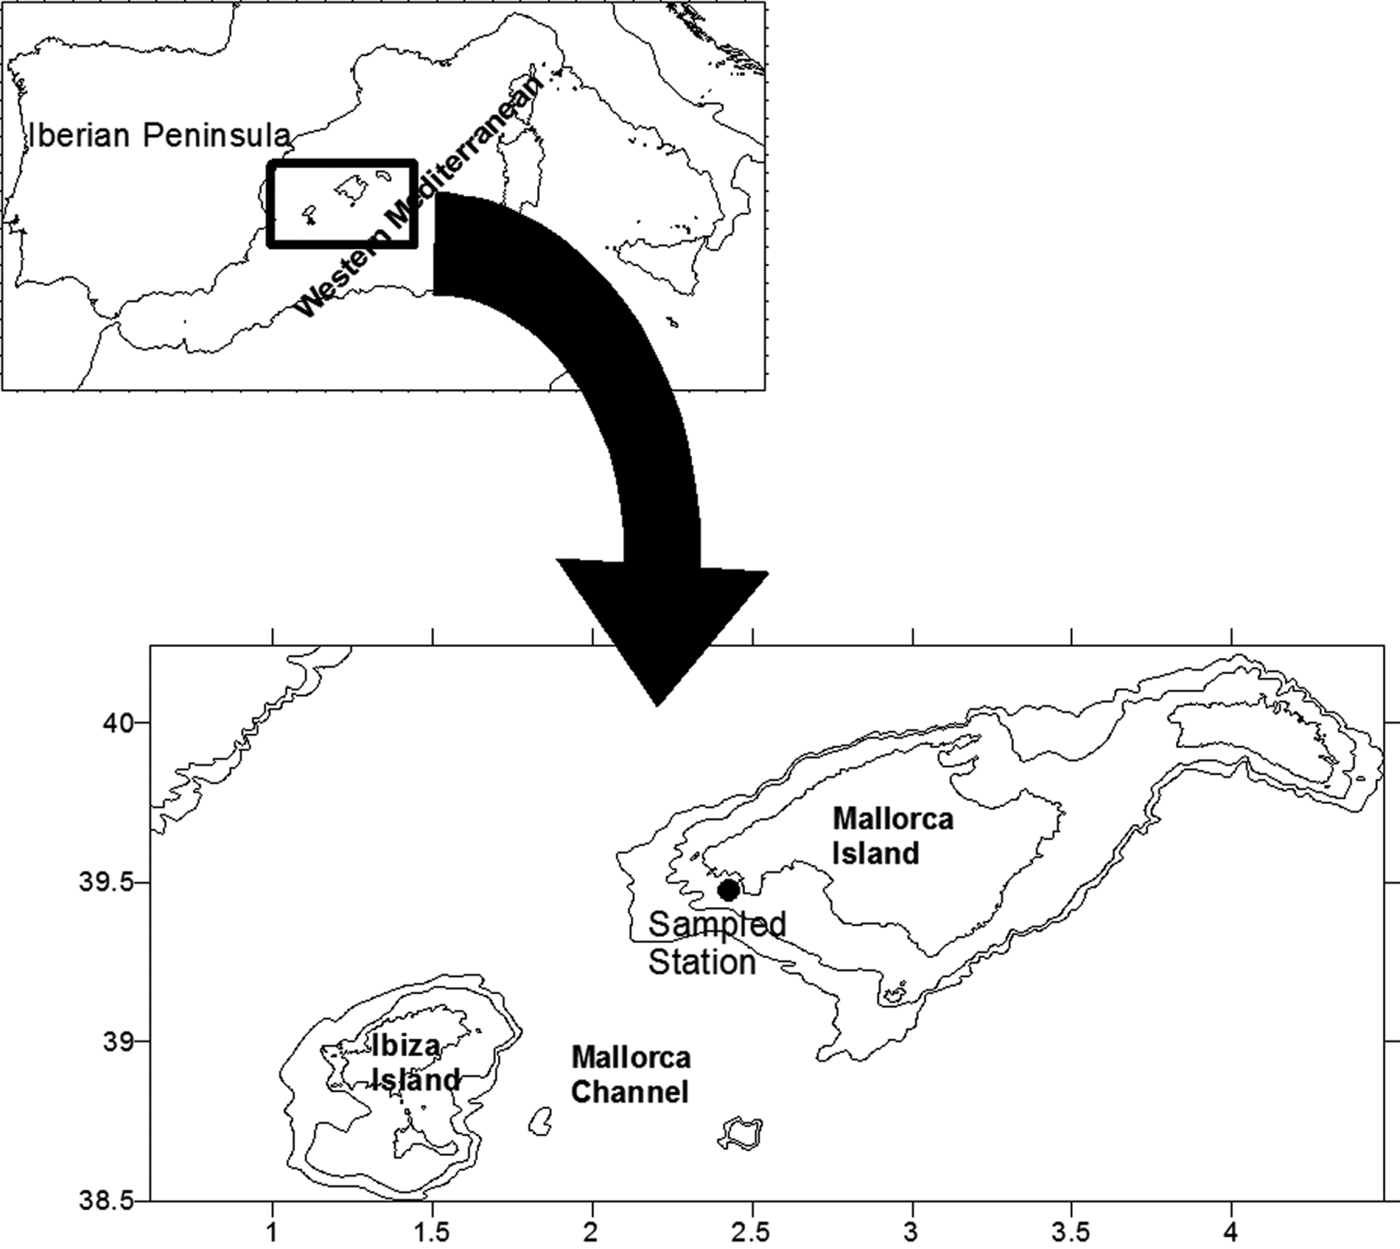
Fig. 1. Map of the study area with location of the sampling station.
Water samples for the determination of nutrients were collected from the Niskin bottles and immediately frozen to −20°C until the laboratory analysis of nitrates+nitrites (NOx) and silicates (Armstrong et al., Reference Armstrong, Stern and Strickland1967).
Chlorophyll a concentrations were determined using the fluorometric technique (Holm-Hansen et al., Reference Holm-Hansen, Lorenzen, Holmes and Strickland1965) after the filtration of 1500 mL of seawater through Whatman GF/C filters. Chlorophyll was extracted with 90% acetone and measured using a Perkin-Elmer 204 spectrofluorimeter (UNESCO, 1966). Samples for phytoplankton counts were preserved with 4% formaldehyde neutralized with hexamethylenetetramine and examined with an inverted microscope following Uterhmöhl's method (Sournia, Reference Sournia1978). As a general rule, three depths were analysed from each sample, corresponding to the chlorophyll maximum and the levels situated above and below that maximum. In cases where the chlorophyll maximum was located at the bottom, the two upper levels were also analysed. Subsamples of 50 or 100 mL were sedimented in a composite chamber before examination. Magnification powers of ×100, ×250 and ×400 were used depending on the size of the organisms. Many organisms could not be identified at the genus or species level and were placed in general categories, for example: dinoflagellates <20 µm, flagellates <20 µm, coccolithophores <20 µm.
RESULTS
Water column conditions
Four oceanographic periods were recognized according to the stratification of the water column (Figure 2). The Winter Mixing period started in January and lasted until the middle of March, and was characterized by homothermal conditions. The Spring Transition period began in the middle of March with the establishment of the thermocline and finished at the end of May. The Summer Stratification period occurred in September 2000 and from June to September 2001, and was characterized by a strong thermal stratification. Finally, the Autumn Transition period lasted between October and the end of December 2000, when the thermocline was eroded.
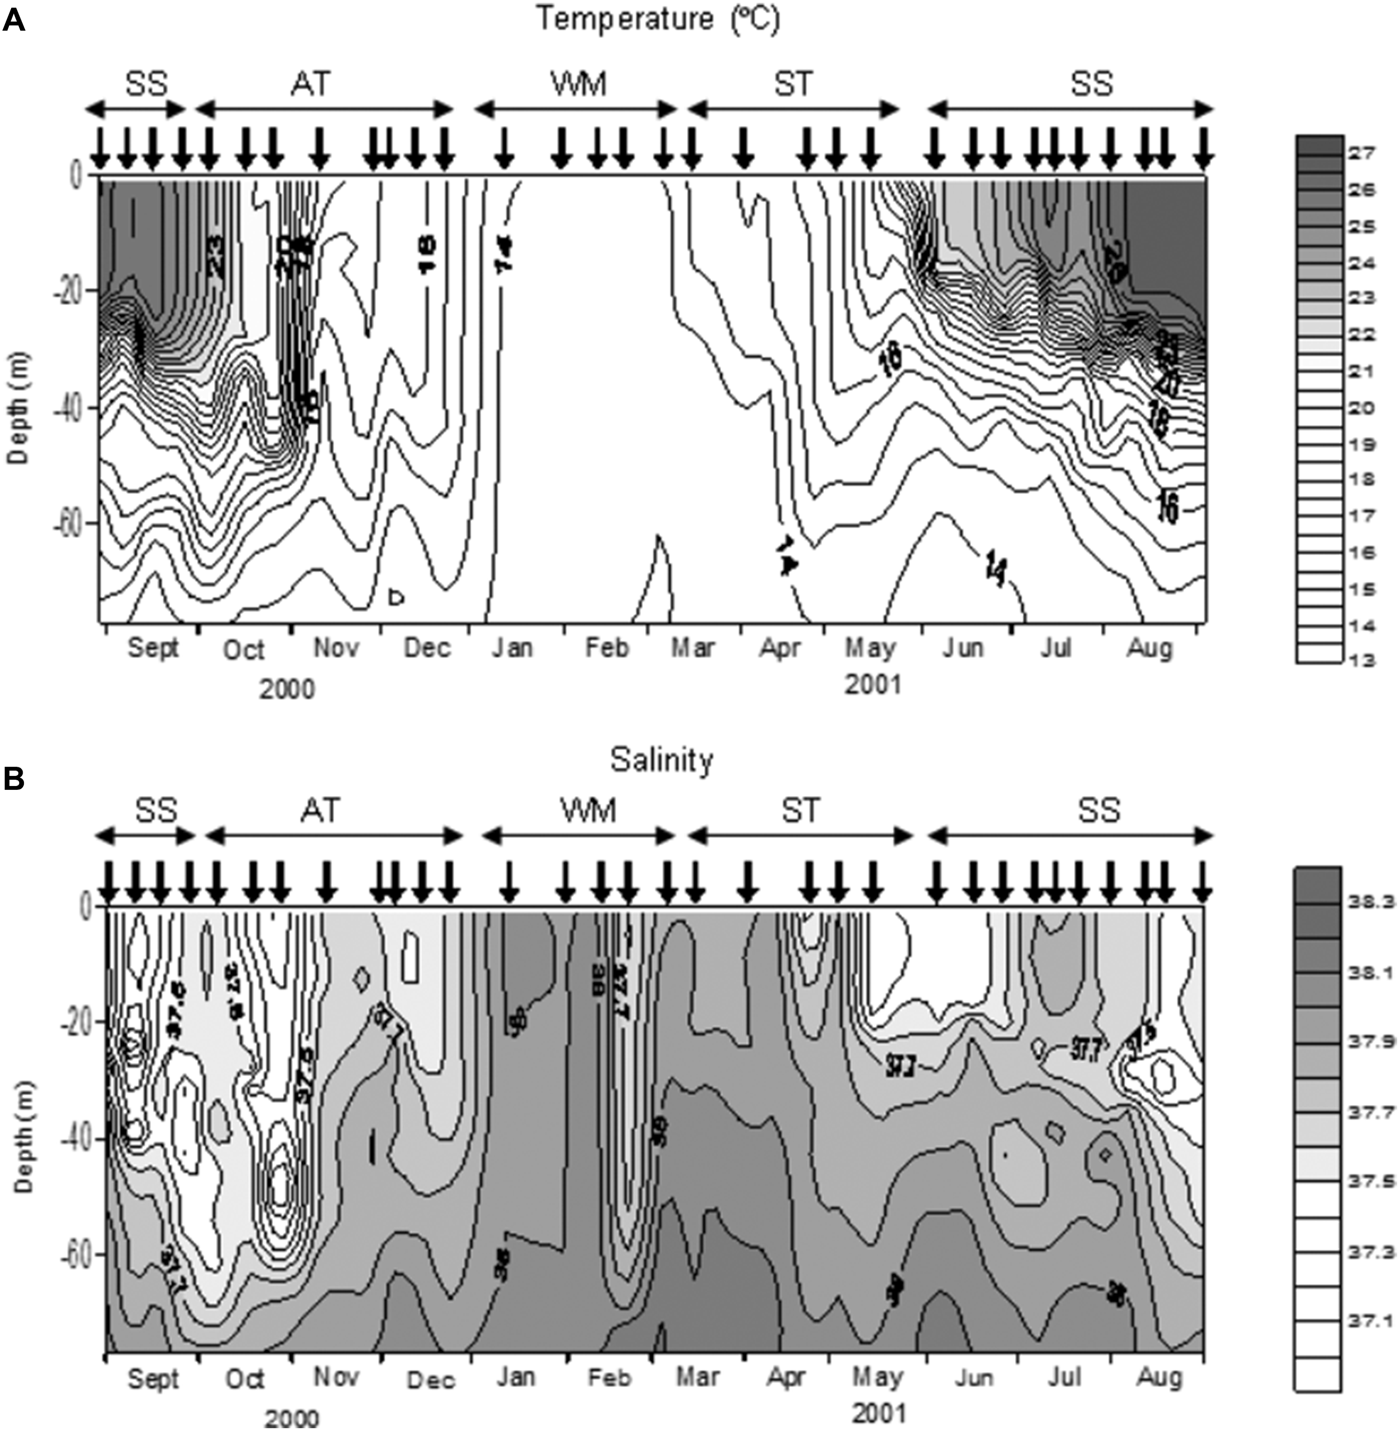
Fig. 2. Distribution of temperature (A) and salinity (B) during the study. Vertical arrows indicate the sampling dates. SS, Summer Stratification; AT, Autumn Transition; WM, Winter Mixing; ST, Spring Transition.
Salinity was generally higher in winter than in summer even though there was no clear seasonal pattern (Figure 2). During the Winter Mixing and the first half of the Spring Transition salinity was close to 38, except in late February when a pronounced decrease was observed. During the second half of the Spring Transition, Summer Stratification and Autumn Transition the salinity in the higher layer (upper 25–70 m) was less than 37.7. At the beginning of June there was a rise in salinity in the lower part of the column with values over 38.1 below 68 m.
During the Winter Mixing (Figure 3) the concentration of NOx was higher than 1 µM in the entire water column, except at the end of February when the values were lower than 0.1 µM in most layers. During the Spring Transition surface concentrations decreased to less than 0.2 µM. In the Summer Stratification NOx values were less than 0.2 µM in most of the water column. Meanwhile, the bottom concentration usually was above 2 µM, with a noteworthy increase of up to 4.8 µM in the bottom concentration in early June. On the contrary, the bottom concentration was less than 1.1 µM in August. In the Autumn Transition period the NOx concentration increased, especially in the bottom layer, with values higher than 3 µM.

Fig. 3. Distribution of NOx (A) and silicate concentration (B). Dots indicate the depths sampled by Niskin Bottles. SS, Summer Stratification; AT, Autumn Transition; WM, Winter Mixing; ST, Spring Transition.
Silicates increased on the surface during the Winter Mixing period, reaching values above 2 µM in most of the water column in early March, but decreased thereafter, particularly in the bottom layer (Figure 3). In May, silicate concentrations rose at the 75 m level, achieving the maximum concentration in early June (4.0 µM). During the rest of the Summer Stratification silicate concentration at the bottom level fluctuated between 2.7 and 0.6 µM. In the Autumn Transition the concentration of silicate increased mainly at the 50–75 m layer with values between 2 and 3.6 µM.
Phytoplankton blooms
In this study a phytoplankton bloom was deemed to exist when the maximum chlorophyll concentration in the water column was higher than 1 µg L−1. Therefore, proliferations occurred in January, February, March and early June (Figure 4). January, February and March bloom values reached around 1.5 µg L−1. In the second half of March the maximum concentration was still above 0.9 µg L−1. During the rest of the Spring Transition the values tended to decline and the chlorophyll maximum was found at deeper levels, forming a distinct deep chlorophyll maximum (DCM). In early June another bloom was found with values over 1 µg L−1 at 50 m. Twelve days later, the concentration of chlorophyll was still quite high (0.9 µg L−1) although the maximum had moved to 75 m. During the rest of the Summer Stratification (including September 2000) the DCM was found near the bottom with values ranging between 0.46 and 0.72 µg L−1, while in the upper 25 m the concentration was less than 0.25 µg L−1. At the beginning of the Autumn Transition the chlorophyll maximum was located at the 50 m level with values of 0.32–0.45 µg L−1. From the end of November until the end of December the chlorophyll maximum was situated at the 25 m level with concentrations between 0.49 and 0.6 µg L−1.

Fig. 4. Distribution of chorophyll a concentration (A) and phytoplankton abundance (B) during the study. Dots indicate the depths sampled by Niskin Bottles for each variable. SS, Summer Stratification; AT, Autumn Transition; WM, Winter Mixing; ST, Spring Transition.
Phytoplankton abundance and composition
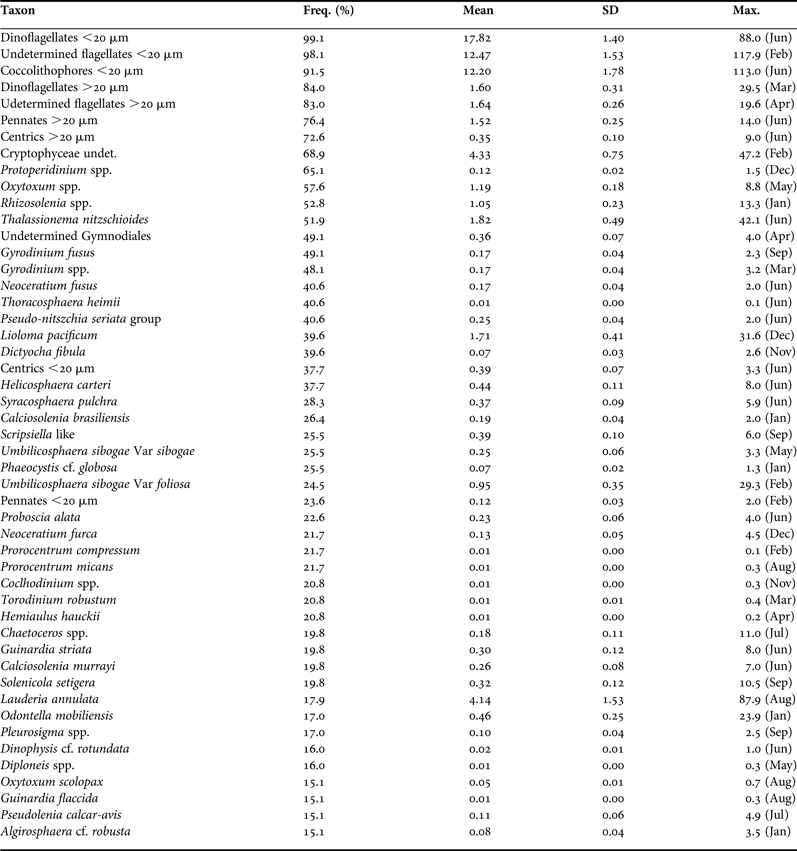
Table 1 shows the taxons with the highest frequency of occurrence. During the Winter Mixing period phytoplankton comprised mainly coccolithophores, flagellates and dinoflagellates of nanoplanktonic size, with none of these groups being clearly dominant (Figures 5 and 6). Diatoms were only occasionally important as in the first proliferation. In the January bloom a maximum of 272 cell mL−1 was observed (Figure 4), made up of coccolithophores, diatoms and nanoflagellates. These diatoms mainly belong to the species Lauderia annulata, Rhizosolenia spp., Thalassionema nitzschioides and Leptocylindrus danicus. On the other hand, the February proliferation reached 309 cell mL−1 and was dominated by nanoflagellates and nanodinoflagellates. In early March a new bloom started, composed primarily of coccolithophores and nanoflagellates.
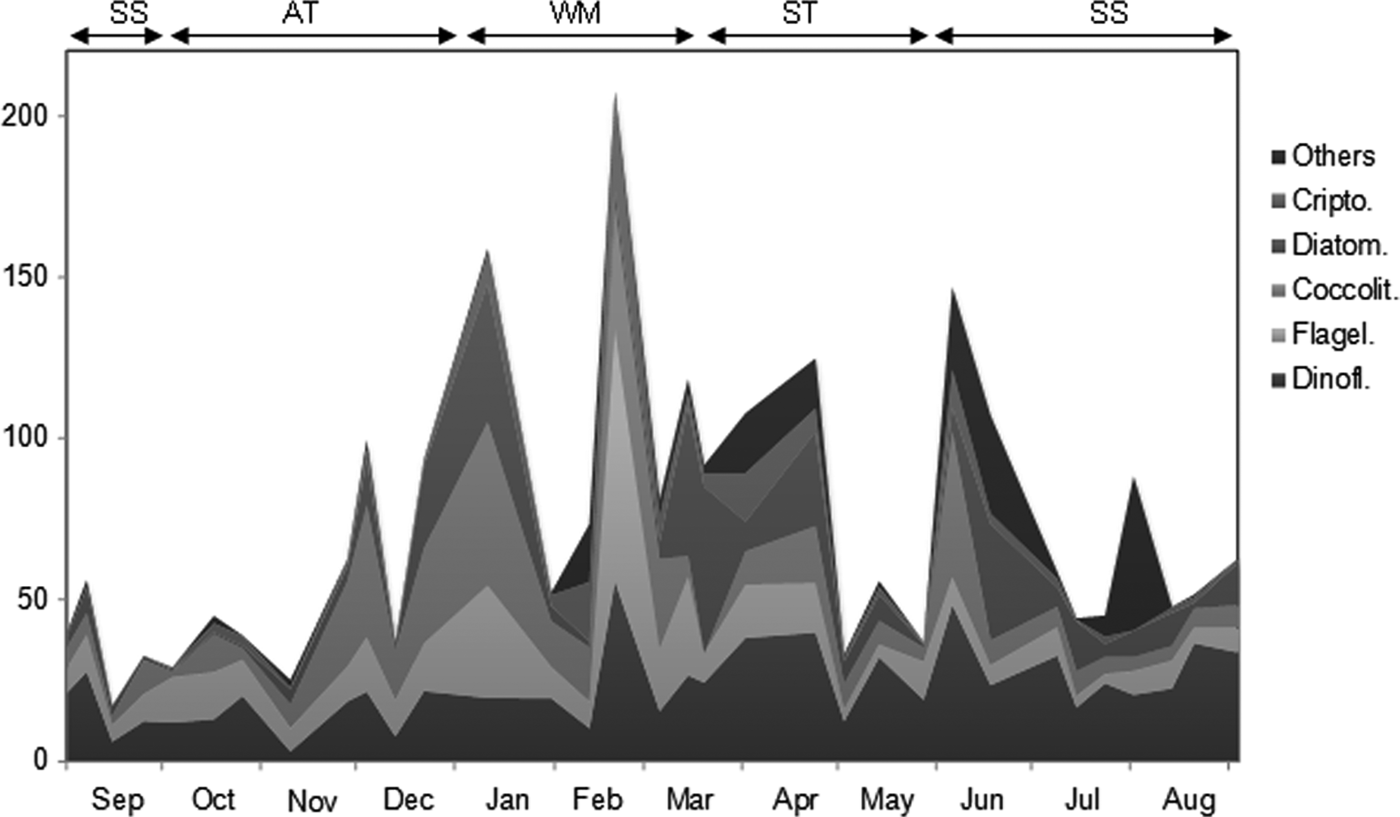
Fig. 5. Variation of the main taxonomic groups during the study. Others: other groups. Crypto: cryptophyceans. Diatom: diatoms. Coccolit: coccolithophores. Flagel: undetermined flagellates. Dinofl: dinoflagellates. SS, Summer Stratification; AT, Autumn Transition; WM, Winter Mixing; ST, Spring Transition.
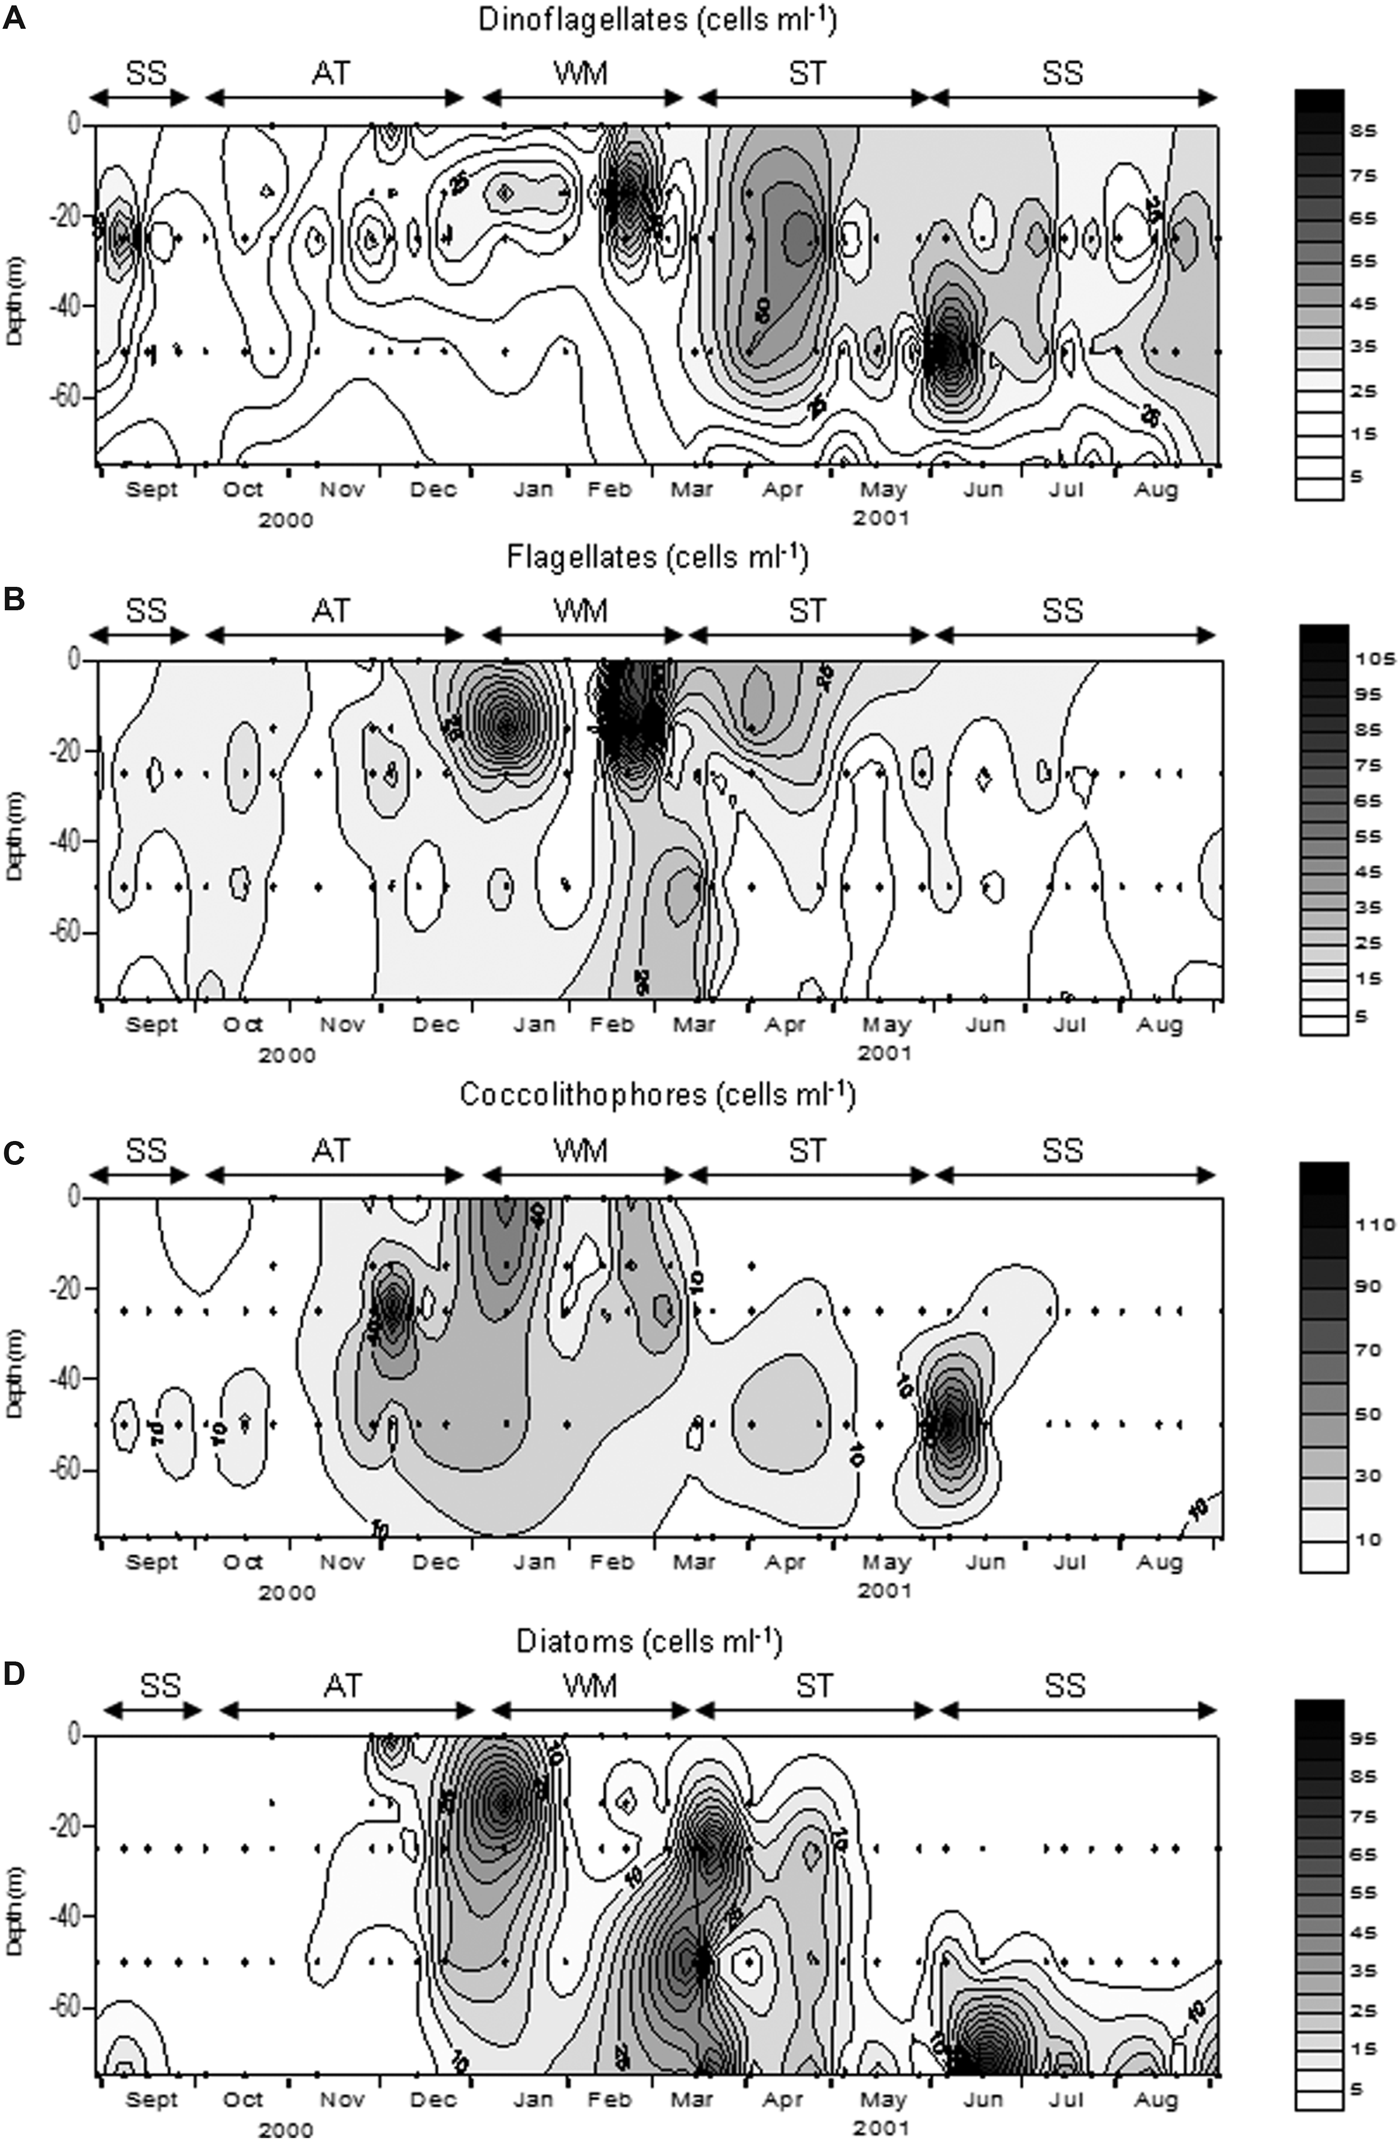
Fig. 6. Variation of dinoflagellates (A), undetermined flagellates (B), coccolithophores (C) and diatoms (D) during the study. Dots indicate the depths sampled for microscope counting. SS, Summer Stratification; AT, Autumn Transition; WM, Winter Mixing; ST, Spring Transition.
Table 1. Taxons with a frequency of occurrence >15%. Freq: percentage of samples with presence of each taxon. Mean: mean average (cell mL−1). SD: standard error. Max: maximum average (cell mL−1) and month of the maximum (in parentheses).
During the rest of March, the bloom conditions detected at the end of the Winter Mixing continued, with maxima >128 cells mL−1 mainly formed by diatoms, nanoflagellates and nanodinoflagellates. The diatoms during this bloom were represented by Pseudo-nitzschia ‘delicatissima group’, Thalassionema nitzschoides, Rhizosolenia spp. and Chaetoceros pseudocurvisetus. In April and May the community was dominated by dinoflagellates <20 µm, highlighting a marked decline in abundance in May to less than 62 cells mL−1.
At the beginning of the Summer Stratification another bloom took place with values of 352 cells mL−1 at 50 m. This peak was formed mainly by coccolithophores and nanodinoflagellates (Figure 6). During the rest of the Summer Stratification and in contrast to chlorophyll, the maximum abundance was not generally found near the bottom, but rather in the middle of the water column. In this period, phytoplankton abundance was usually under 62 cells mL−1. At the end of this period abundance was normally <50 cell mL−1. The typical summer situation was characterized by the clear dominance of nanodinoflagellates in most of the water column, except in the bottom where diatoms tended to be dominant (Figure 6). These diatoms were mainly formed by pennates >20 µm, Thalassionema nitzschoides and Pseudo-nitzschia ‘seriata group’.
During October and the first half of November phytoplankton abundance was usually under 50 cells mL−1 and consisted mainly of nanoflagellates, nanodinoflagellates and coccolithophores. From the end of November there was an increase in the abundance of phytoplankton, so that in early December values over 100 cells mL−1 were found. From late November to late December the phytoplankton community was dominated by coccolithophores, followed by nanoflagellates and nanodinoflagellates. During this period the number of diatoms increased, becoming the second most abundant group (after coccolithophores) at the end of December.
DISCUSSION
Environmental conditions
According to the description of water masses in the Balearic Sea made by López-Jurado et al. (Reference López-Jurado, García Lafuente and Álvarez1996), salinities over 37.5 indicate the presence of MW. Therefore, northern waters were dominant during most of the year studied. The recent AW, with a lower salinity, appeared mainly in August, September and October and in the surface layer in May–June.
The surface salinity suggests the absence of any important terrestrial influence, as was already observed for the area (Fernandez de Puelles et al., Reference Fernandez de Puelles, Jansá, Gomis, Gras and Amengual1997; Jansá, Reference Jansá2008). This is mainly due to the non-existence of permanent rivers in the Mallorca Island and the situation of the studied station in open waters.
Compared with the historical data in the sampled station (1994–2003; Fernández de Puelles et al., Reference Fernández de Puelles, Alemany and Jansá2007), autumn 2000 and winter 2001 were colder than average for these seasons. Moreover, salinity values and the concentration of nutrients during the year studied were higher than average (Fernández de Puelles et al., Reference Fernández de Puelles, Alemany and Jansá2007). Other studies stressed the importance of colder and saltier years for the primary production in the area (Estrada et al., Reference Estrada, Vives, Alcaraz and Margalef1985), since convective mixing reaches a deeper layer and the presence of MW in the Mallorca Channel is intensified (Fernández de Puelles & Molinero, Reference Fernández de Puelles and Molinero2007). In fact in 2000 and 2001 the maximum average of chlorophyll concentration of the data series was obtained (Fernández de Puelles et al., Reference Fernández de Puelles, Gras and Hernández-León2003, Reference Fernández de Puelles, Alemany and Jansá2007).
Phytoplankton
According to the historical data, the Mallorca Channel characteristically exhibits chlorophyll maxima in January–February and in May (Fernandez de Puelles et al., Reference Fernandez de Puelles, Jansá, Gomis, Gras and Amengual1997, Reference Fernández de Puelles, Alemany and Jansá2007). This is consistent with the blooms observed in January, February and June. However the March bloom found in this study is unusual in the area, and would probably be related to the great influence of MW in the Mallorca Channel during the thermocline formation. Before the January proliferation, a rise in air temperature and an absence of strong winds in the days prior to the event were observed (Valencia-Vila, Reference Valencia-Vila2013). These circumstances may have favoured the stability of the water column. The formation of a transient thermocline, in the middle of a mixing season with high nutrient concentrations, resulted in the bloom observed. Considering the prevalence of MW at that date, the bloom could have originated northerly from the sampling station. The sea conditions did not allowed an intensive sampling that month. At the next date no bloom conditions were found, as the return to the mixing conditions had probably interrupted the succession sequence. The February bloom was associated with a clear decrease in salinity, due to the input of southern waters which mix with northern waters. The proliferation could have been transported from the south or have developed in situ as a consequence of the mixing of the two water masses. This maximum coincided with a decline in NOx concentration. A rise in the zooplankton biomass was also observed at this time (Fernández de Puelles et al., Reference Fernández de Puelles, Alemany and Jansá2007; Valencia-Vila, Reference Valencia-Vila2013). This is typical of an advanced stage of the proliferation where the phytoplankton had depleted the nutrients and the zooplankton had had enough time to respond to the increase in microalgae. The dominance of flagellates and dinoflagellates during this proliferation also suggests a mature stage of the proliferation, although it must be taken into account that recent AW could host a different community. Variations in the environmental conditions (mainly salinity and NOx) after this bloom indicate another change in the water masses, and therefore, the phytoplankton succession sequence was interrupted. Finally, the June proliferation was associated with water cooling in the deep layer, along with an increase in salinity and nutrient concentration near the bottom, pointing to the input of northern waters. In May and June 2001 a clear front was observed south of the sampling station (Fernández de Puelles et al., Reference Fernández de Puelles, Valencia, Jansá and Morillas2004; Alemany et al., Reference Alemany, Quintanilla, Vélez-Belchí, García, Cortés, Rodríguez, Fernández de Puelles, González-Pola and López-Jurado2010), preventing the input of waters of Atlantic origin and allowing the presence of northern waters in the sampled area.
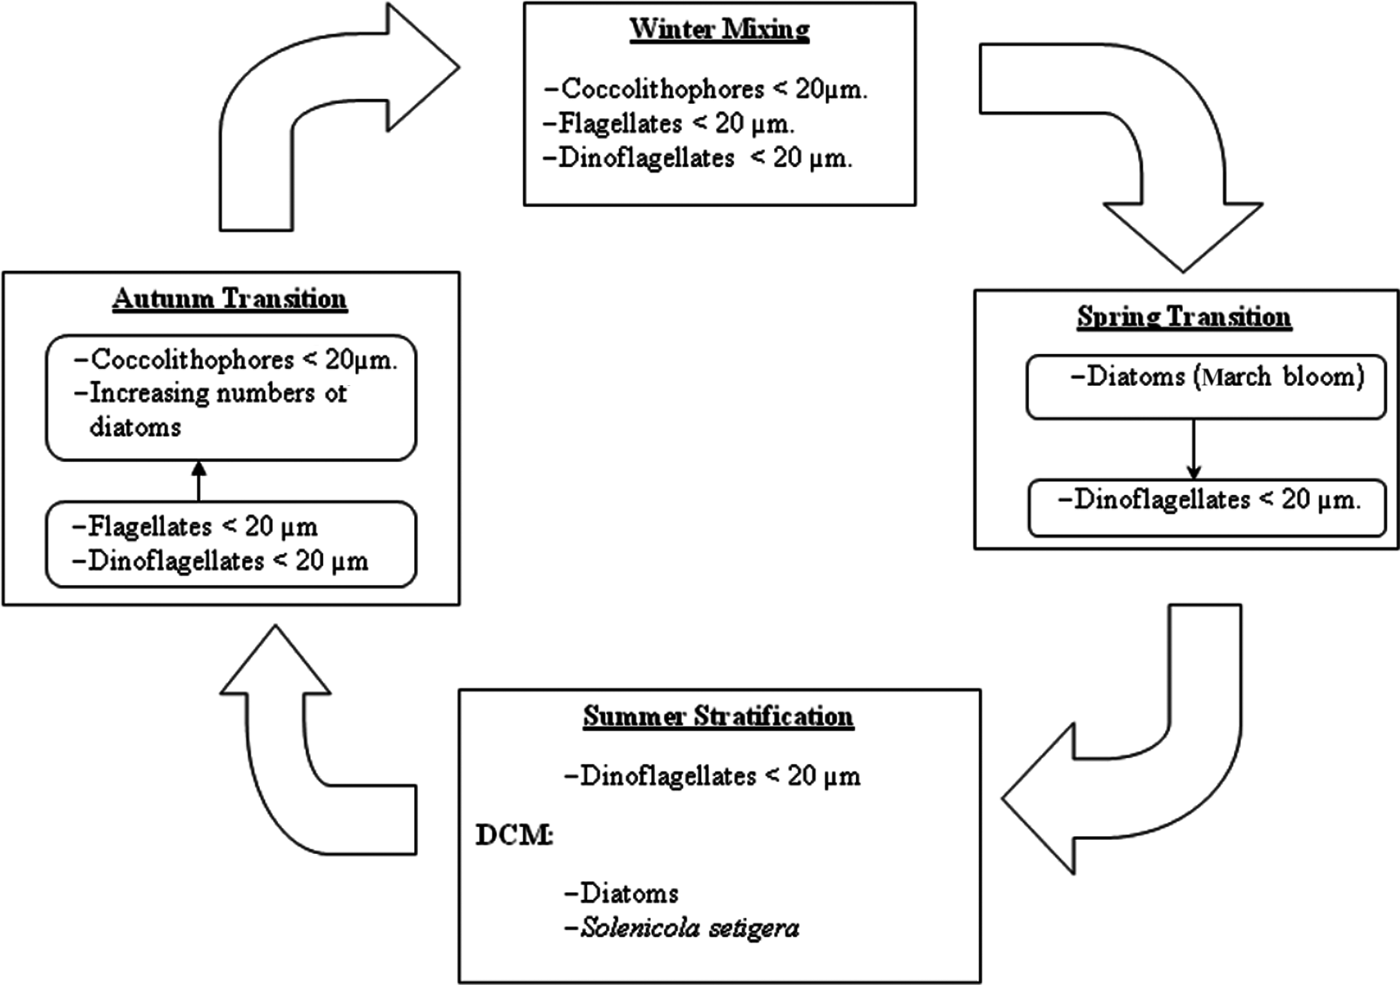
Defining the succession from a fixed point is always a problem (Margalef, Reference Margalef1963b), especially in the studied area where two different water masses pass through. In any case, the observed changes in phytoplankton composition are schematized in Figure 7. During no-bloom situations phytoplankton is dominated by nanoplanktonic flagellated forms. This circumstance suggests a prevalence of the microbial food web (sensu Legendre & Rassoulzadegan, Reference Legendre and Rassoulzadegan1995) during most of the year studied, as has already been highlighted for the entire Mediterranean Sea (Siokou-Frangou et al., Reference Smayda and Morris2009).
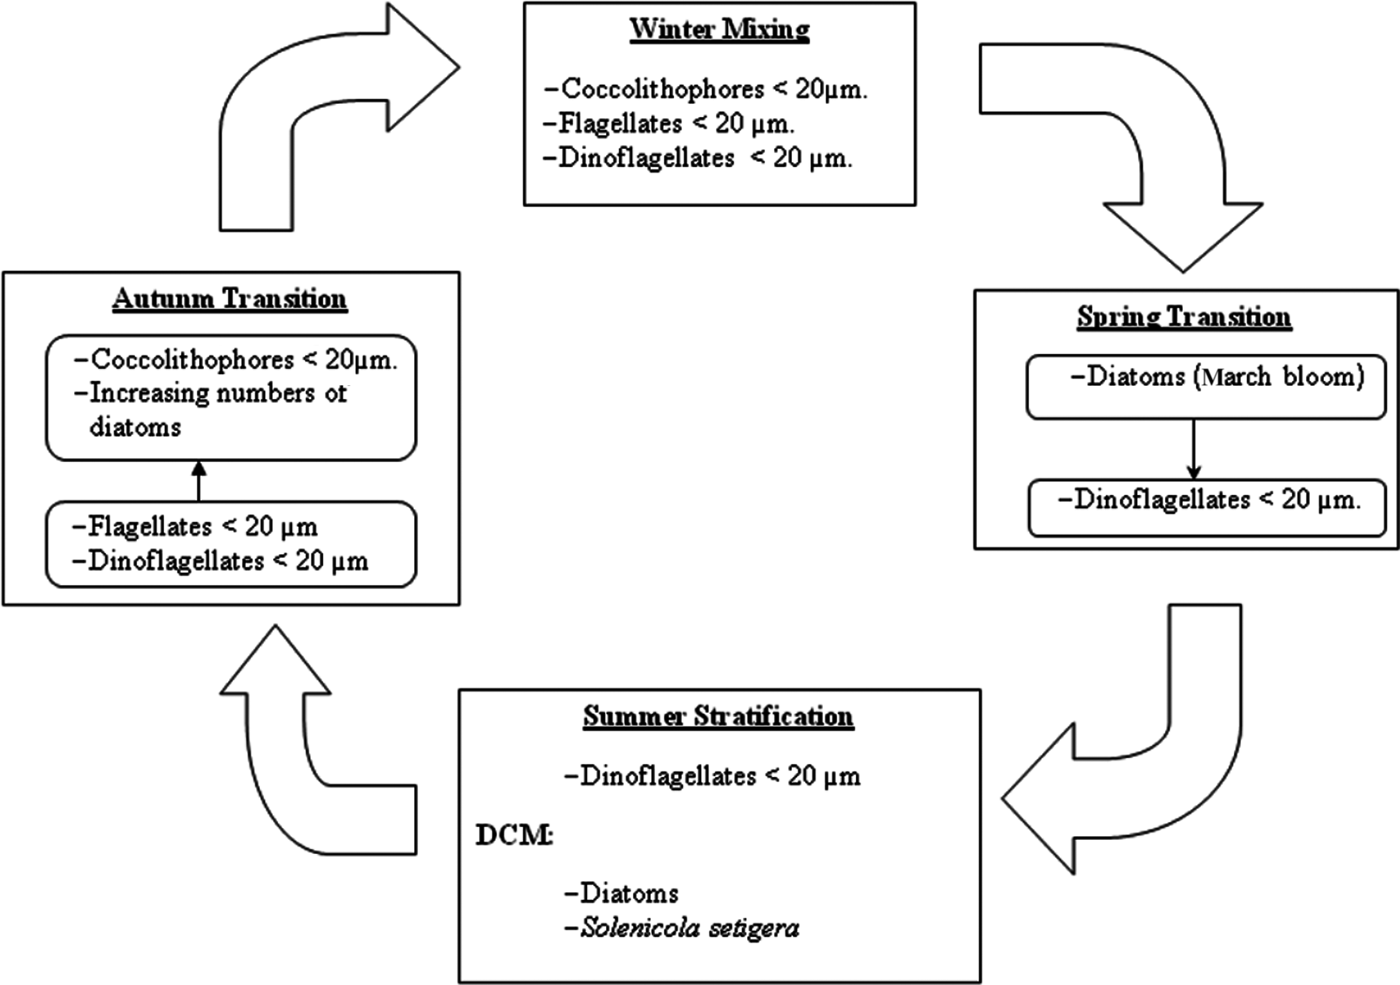
Fig. 7. Schematic representation of the variation of phytoplankton species and groups over the annual cycle.
The Winter Mixing was dominated by nanoflagellates (coccolithophores, undetermined flagellates and dinoflagellates). Among flagellates it is known, from HPLC studies, that prymnesophyceans often represent an important group in the Mediterranean (Siokou-Frangou et al., Reference Smayda and Morris2009). In fact, in the nearby Bay of Andratx the genus Chrysochromulina was dominant between December and April (Puigserver, Reference Puigserver2003). Moreover, the remarkable presence of coccolithophores, specifically Emiliania huxleyi, during winter in the Mediterranean has been observed in other studies (see compilation in Siokou-Frangou et al., Reference Smayda and Morris2009).
In the oligotrophic conditions (from Mid Spring Transition to Mid Autumn Transition) dinoflagellates were the most prevalent group. Estrada et al. (Reference Estrada, Latasa, Emelianov, Gutiérrez-Rodríguez, Fernández-Castro, Isern-Fontanet, Mouriño-Carballido, Salat and Vidal2014), in situations of post-bloom and summer stratification in MW, also found a dominance of dinoflagellates accompanied by coccolithophores, who also were important in our study. However, in a HPLC study in a post-bloom situation in recent AW a community dominated by Shynechococcus and primnesoficeans was found (Gutiérrez et al., Reference Gutiérrez-Rodríguez, Latasa, Estrada, Vidal and Marrasé2010). This discrepancy with our study can be attributed to methodological differences, together with spatial and temporal heterogeneity.
On the other hand, diatoms prevailed during the Summer Stratification in the DCM, as was already observed in Western Mediterranean in southern waters (Ros and Miracle, Reference Ros and Miracle1984) and northern waters (Estrada et al., Reference Estrada, Marrasé, Latasa, Berdalet, Delgado and Riera1993). The dominance of diatoms in the summer DCM was not continuous, probably due to the fluctuating concentrations of silicates which cause intermittent events of silicate limitation. Other studies also reported the irregular dominance of diatoms in the DCM (Estrada et al., Reference Estrada, Marrasé, Latasa, Berdalet, Delgado and Riera1993).
The increasing abundance in mid Autumn Transition and the change towards a coccolithophores prevalence was related with the higher concentration of nutrients, caused by the increasing convective mixing and the greater presence of WM. The importance of coccolithophores in late Autumn Transition has already been reported in the Mediterranean (Siokou-Frangou et al., Reference Smayda and Morris2009).
The influence of the water masses in the phytoplankton composition was masked by the annual cycle of phytoplankton, and it is not as clear as in the zooplankton (Fernández de Puelles et al., Reference Fernández de Puelles, Valencia, Jansá and Morillas2004). Even though, proliferations used to appear with the prevalence of WM, with the important exception of the February bloom. As recent AW was associated with oligotrophic conditions, its presence was normally related with the domain of small dinoflagellates, like in surface waters during the Summer Stratification and the Autumn Transition.
Regarding the proliferations, the importance must be highlighted of coccolithophores and other flagellates (including dinoflagellates) during the beginning of the blooms, when the nutrient concentrations were still relatively high. This was observed in January, early March and early June. During these proliferations, coccolithophores were most likely formed mainly by Emiliania huxleyi, as it is an important bloom-forming species (Tyrrell & Merico, Reference Tyrrell, Merico, Thierstein and Young2004), although the presence of other bloom-forming species such as Gephyrocapsa oceanica (Guerreiro et al., Reference Guerreiro, Oliveira, Stigter, Cachao, Sá, Borges, Cros, Santos, Fortuño and Rodrigues2013) cannot be ruled out. Other studies also found coccolithophores in early stages of the bloom. Some studies reported high quantities of settled coccoliths of Emiliania huxleyi and Gephyrocapsa oceanica during or just after upwelling pulses (Mergulhao et al., Reference Mergulhao, Mohan, Murty, Guptha and Sinha2006; Silva et al., Reference Silva, Palma and Moita2008). In central Portugal a late winter bloom was found with high densities of these E. huxleyi together with Margalef's Stage I diatoms genera (Chaetoceros, Thalassiosira and Skeletonema; Guerreiro et al., Reference Guerreiro, Oliveira, Stigter, Cachao, Sá, Borges, Cros, Santos, Fortuño and Rodrigues2013), similar to our January bloom. Consequently, considering these studies and our own results, the coccolithophores should be regarded as possible early successors, as was emphasized by Guerreiro et al. (Reference Guerreiro, Oliveira, Stigter, Cachao, Sá, Borges, Cros, Santos, Fortuño and Rodrigues2013).
Only in the January bloom did diatoms develop together with coccolithophores and flagellates. In the March and June blooms, the development of diatoms was detected later and it was characterized by relatively slow-growing diatoms belonging to Margalef's Stage II (Margalef, Reference Margalef1963a), such as the genera Thalassionema, Rhizosolenia or Pseudo-nitzschia. According to Estrada et al. (Reference Estrada, Latasa, Emelianov, Gutiérrez-Rodríguez, Fernández-Castro, Isern-Fontanet, Mouriño-Carballido, Salat and Vidal2014), in recent AW Phaeocystis sp. is an important contribution to the blooms where diatoms do not proliferate (Estrada et al., Reference Estrada, Latasa, Emelianov, Gutiérrez-Rodríguez, Fernández-Castro, Isern-Fontanet, Mouriño-Carballido, Salat and Vidal2014). But this was not our case, maybe because MW predominated in our early proliferations. A possible explanation for the absence of Stage I diatoms in our study in the beginning of the March and June blooms is that the sampling did not coincide with the proliferation of these species. However, at least in those two blooms, this is questionable because the silicate would have been depleted. Nevertheless, on these two dates the silicate concentrations in the chlorophyll maxima level were close to 2 µM, a concentration high enough for the development of diatom blooms (Egge & Aknes, Reference Egge and Aksnes1992; Brown et al., Reference Brown, Sanders, Savidge and Lucas2003). Presumably there was simply no development of this kind of species. Other studies found that E. huxleyi usually develops some time after the beginning of the bloom (Sprengel et al., Reference Sprengel, Baumann, Henderiks, Henrich and Neuer2002), especially after the development of diatoms (Iglesias-Rodríguez et al., Reference Iglesias-Rodríguez, Brown, Doney, Kleypas, Kolber, Kolber, Hayes and Falkowski2002; Tyrrell & Merico, Reference Tyrrell, Merico, Thierstein and Young2004; Oguz & Merico, Reference Oguz and Merico2006; Van Oostende et al., Reference Van Oostende, Harlay, Vannelslander, Vyverman and Sabbe2012). The appearance of E. huxleyi after the diatoms can be explained by the fact that it requires vitamin B1 or thiamine (Tyrrell & Merico, Reference Tyrrell, Merico, Thierstein and Young2004). Moreover, it is unable to compete with diatoms in high nutrient conditions, since coccolithophores have lower nutrient uptake capacities when the concentration is high (Iglesias-Rodríguez et al., Reference Iglesias-Rodríguez, Brown, Doney, Kleypas, Kolber, Kolber, Hayes and Falkowski2002). However, coccolithophores effectively compete with diatoms in semioligotrophic conditions (Iglesias-Rodríguez et al., Reference Iglesias-Rodríguez, Brown, Doney, Kleypas, Kolber, Kolber, Hayes and Falkowski2002), as the former have a higher affinity for nitrogen and phosphate (Eppley et al., Reference Eppley, Rogers and McCarthy1969). Therefore, the absence of fast-growing diatoms in the first stages of the March and June blooms were probably the result of a lack of sufficient nutrient concentration for its development, being substituted by coccolithophores, better adapted to a lower nutrient concentration. According to Bode et al. (Reference Bode, Álvarez-Ossorio, González, Lorenzo, Rodríguez, Varela and Varela2005) Skeletonema costatum and Thalassiosira spp. depend on the availability of silicate. Charles et al. (Reference Charles, Lantoine, Brugel, Chrétiennot-Dinet, Quiroga and Rivière2005) reported high nutrient requirements for Skeletonema costatum, especially phosphate (minimum >0.15 µM-P). Other studies (Nogueira et al., Reference Nogueira, Ibanez and Figueiras2000; Varela & Prego, Reference Varela and Prego2003; Aubry et al., Reference Aubry, Berton, Bastianini, Socal and Acri2004) found high densities of Skeletonema costatum associated with concentrations above 20 µM NO3 and 0.2 µM PO4, higher values than usual in our chlorophyll maxima of winter and spring. In addition to nutrient limitation, the absence of high turbulence, especially in June, could also explain the lack of diatoms during early blooms. High turbulence prevents the sedimentation of diatoms and hinders flagellate development due to cell damage (Smayda, Reference Smayda1997).
The presence of coccolithophores at the beginning of the proliferation raises interesting questions. Because of the vitamin B1 requirements, Emiliania huxleyi could not be a bloom precursor (early blooms) as they need previous biological activity (Tyrrell & Merico, Reference Tyrrell, Merico, Thierstein and Young2004). Nevertheless, the ecological importance of vitamin B1 has not yet been determined (Paasche, Reference Paasche2002). In fact this compound could originate from the nanoflagellates or bacteria that develop simultaneously with coccolithophores.
CONCLUSIONS
This is the first study on the annual cycle of phytoplankton on the Balearic Shelf, and was performed using an intensive sampling. We found the highest phytoplankton biomass for the period 1994–2003. This was related to the high convective mixing and the prevalence of northern waters during the cycle studied.
During the bloom conditions it highlights the presence of coccolithophores as bloom precursors. During no-bloom situations the phytoplankton community was mainly formed by small flagellates. In the most oligotrophic conditions dinoflagellates were dominant. During the Winter Mixing period different groups of nanoplanktonic flagellated forms prevailed, including coccolithophores, undetermined flagellates and dinoflagellates.
ACKNOWLEDGEMENTS
We would like to thank P. Sánchez, M. Serra, B. Salamanca and J.C. Alonso for their assistance during the sampling, and B. Amengual for the nutrient analysis. We are also grateful to Dr Antonio Bode and the anonymous referee for their valuable suggestions.
FINANCIAL SUPPORT
This work was supported by the Instituto Español de Oceanografía (project Hercule; J.V. fpi grant 2000) and the Spanish Ministry of Economy and Competitiveness (project MAFIA CTM2012-39587).


