INTRODUCTION
The Indo-Malayan Archipelago is geologically dynamic and is considered a hotspot of marine biodiversity and speciation (Benzie, Reference Benzie1999; Carpenter & Springer, Reference Carpenter and Springer2005). The region is also characterized by geographic and oceanographic complexity (Gordon & Fine, Reference Gordon and Fine1996), which played a major role in the evolution and ecology of various species (Benzie, Reference Benzie1999; Carpenter & Springer, Reference Carpenter and Springer2005). Molecular and phylogeographic studies on marine organisms have shown that this region is of undeniable biogeographic and evolutionary importance for marine biodiversity (Barber et al., Reference Barber, Palumbi, Erdmann and Moosa2000; DeBoer et al., Reference DeBoer, Subia, Ambariyanto, Kovitvongsa and Barber2008). Concurrent patterns of maximum species richness across multiple taxa from larger organisms, e.g. corals, fish and invertebrates (Carpenter & Springer, Reference Carpenter and Springer2005; Tittensor et al., Reference Tittensor, Mora, Jetz, Lotze, Richard, Berghe and Worm2010) to minute zooplankton (Fleminger, Reference Fleminger, Pierrot-Bults, van der Spoel, Zarhuranec and Johnson1986; Carpenter, Reference Carpenter, Carpenter and Niem1998) have been found in this region.
The studies of molecular phylogeography of marine animals in the Indo-Malayan Archipelago commenced in the early 1990s and have focused mostly on larger organisms such as fish (McMillan & Palumbi, Reference McMillan and Palumbi1995) and macrobenthos (Benzie & Williams, Reference Benzie and Williams1997; Benzie, Reference Benzie, Hall and Holloway1998; Williams & Benzie, Reference Williams and Benzie1998) with planktonic larval stages, but little attention has been paid to holoplankton. These studies have suggested a wide variety of population structures within and between biogeographic regions (Carpenter et al., Reference Carpenter, Barber, Crandall, Ablan-Lagman, Ambariyanto, Manjaji-Matsumoto, Junio-Meñez, Santos, Starger and Toha2011). Sharp intraspecific genetic breaks have been observed for a number of species broadly distributed across the region (Williams & Benzie, Reference Williams and Benzie1998; Benzie, Reference Benzie1999; Barber et al., Reference Barber, Moosa and Palumbi2002a, Reference Barber, Palumbi, Erdmann and Moosab), while apparent lack of such breaks has been shown for other species such as starfish Acanthaster planci (Benzie, Reference Benzie1999), pearl oyster (Lind et al., Reference Lind, Brad, Elphinstone, Taylor and Jerry2012), mantis shrimp (Barber et al., Reference Barber, Moosa and Palumbi2002a, Reference Barber, Palumbi, Erdmann and Moosab) and round scad mackerel (Borsa, Reference Borsa2003). The complex geological history of this region has been suggested as a major contributor to the observed phylogeographic patterns (Benzie, Reference Benzie, Hall and Holloway1998), such as the tectonic movements (Hall, Reference Hall2002), the recent emergence of the Philippines, and the formation and destruction of land bridges as a result of Pleistocene changes in sea level (Voris, Reference Voris2000). The genetic structuring within this region may also have been impacted by oceanographic factors, as represented by the immense passage of water conveyed by the Indonesian throughflow (ITF) (Lind et al., Reference Lind, Brad, Elphinstone, Taylor and Jerry2012). Such geological and climatic changes could provide opportunities for population vicariance on a relatively small spatial scale (McManus, Reference McManus1985), island-hopping (Williams & Benzie, Reference Williams and Benzie1997), range expansion by long-distance colonization across previously uncrossable barriers (Voris, Reference Voris2000), and extinction and recolonization of continental shelf areas as a result of sea-level changes (Voris, Reference Voris2000). Meanwhile, oceanographic factors could also drive diversification by either facilitating or restricting passive larval transport between populations and ultimately speciation in marine organisms in the region (Barber et al., Reference Barber, Moosa and Palumbi2002a, Reference Barber, Palumbi, Erdmann and Moosab).
The planktonic shrimp Lucifer hanseni Nobili, Reference Nobili1905 belongs to the family Luciferidae (Decapoda, Sergestidae) distributed widely in the Indo-Pacific region (Dakin & Colefax, Reference Dakin and Colefax1940; Huang & Fang, Reference Huang and Fang1987; Grabe & Lee, Reference Grabe and Lee1992; Goswami & Shrivastava, Reference Goswami and Shrivastava1996; Farfante & Kensley, Reference Farfante and Kensley1997; Hashizume & Omori, Reference Hashizume and Omori1998; Naomi et al., Reference Naomi, Geetha, George and Jasmine2006) and Atlanto-Mediterranean coast (Gurney, Reference Gurney1924; De Grave et al., Reference De Grave, Einav and Galil2012), and particularly abundant in the coastal waters of the Indo-West Pacific region (Omori, Reference Omori1977; Lin et al., Reference Lin, Chen, Lin and Dai1998; Tan et al., Reference Tan, Huang, Chen and Huang2004; Zhou & Xu, Reference Zhou and Xu2009). Because L. hanseni is an ecologically important component of the zooplankton, it is an ideal model to investigate intraspecific diversification, broad-scale patterns of genetic connectivity, and the extent of gene flow of zooplankton in this region. To our knowledge, there is no information available on genetic population structure of holoplanktonic metazoans in this region.
This study investigated the phylogeographic structure of L. hanseni in the Indo-Malayan Archipelago and the adjacent waters, encompassing the coastal waters of Andaman Sea, Malacca Strait, Gulf of Thailand, Borneo Island, Philippines, Celebes Sea, and the waters near islands in the Western Pacific including Palau, Papua New Guinea and Solomon Islands. In particular, we examined the genetic structure of L. hanseni using partial sequences of two mitochondrial genes, cytochrome c oxidase subunit I (COI) and 12S ribosomal RNA (12S rRNA), and one nuclear gene, 28S ribosomal RNA (28S rRNA). Both mitochondrial and nuclear DNA genes were utilized to gather more insight into the genealogical patterns evolving in genomes as a response to evolutionary history and processes that populations may have experienced (Hare, Reference Hare2001; Hudson & Coyne, Reference Hudson and Coyne2002; Brito & Edwards, Reference Brito and Edwards2009; Machida et al., Reference Machida, Miya, Nishida and Nishida2012).
MATERIALS AND METHODS
Sample collection and processing
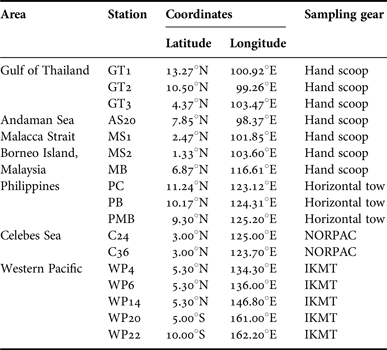
Lucifer hanseni were collected in bulk zooplankton samples from 17 stations across the Indo-Malayan Archipelago using various types of gears (Table 1, Figure 1), fixed in 95–100% ethanol and identified under a stereomicroscope. The stations were grouped into seven areas based on geography: Andaman Sea (AS), Malacca Strait (MS), Gulf of Thailand (GT), Borneo Island (BI), Philippines (PH) (for descriptive convenience, these areas are hereafter collectively referred to as Thailand-Malaysia-Philippine area, TMP), Celebes Sea (CS), and waters near islands in the Western Pacific (WP) including Palau, Papua New Guinea and Solomon Islands.

Fig. 1. Map showing sampling locations of Lucifer hanseni in the Indo-Malayan Archipelago. White dots represent collection sites presented in details in Table 1. Grey areas indicate the shoreline during the Pleistocene low sea-level stands (100 m below the present-day level, according to Voris, Reference Voris2000). Black arrows indicate major ocean currents across the region, and dotted arrows show seasonally reversing currents. Indonesian Throughflow (ITF), North Equatorial Current (NEC), North Equatorial Counter Current (NECC), New Guinea Coastal Current (NGCC), and South Equatorial Current (SEC).
Table 1. Sampling stations of Lucifer hanseni.

NORPAC (North Pacific) standard net, IKMT (Isaacs Kidd Midwater Trawl).
DNA extraction, amplification and sequencing
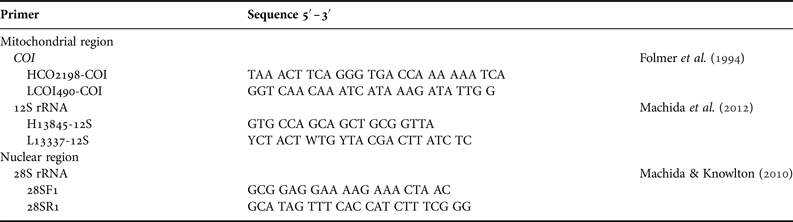
DNA was extracted from individual specimens using a QIAGEN DNeasy blood and tissue kit (QIAGEN, Venlo, Limburg, the Netherlands). Partial nucleotide sequences of COI, 12S rRNA and 28S rRNA genes were amplified by polymerase chain reaction (PCR) using primers listed in Table 2 (Folmer et al., Reference Folmer, Black, Hoeh, Lutz and Vrijenhoek1994; Machida & Knowlton, Reference Machida and Knowlton2010; Machida et al., Reference Machida, Miya, Nishida and Nishida2012). PCR amplifications were performed in 15-μL reactions containing 7.62 µL sterile H2O, 1.5 µL 10× buffer, 1.2 µL 2.5 µM dNTPs (2.5 mM each), 1.8 µL each primer (5 µM), 0.08 µL Z-taq (TaKaRa Bio, Ohtsu, Japan), and 1.0 µL template. The thermal cycle profile consisted of 35 cycles of denaturation at 94°C for 5 s, annealing at 50°C for 5 s, and extension at 72°C for 30 s. The PCR amplifications were carried out in an ABI 9700 Thermal Cycler (Applied Biosystems, Foster City, CA, USA). PCR-amplified products were electrophoresed on 2% TBE L03 agarose gel (TaKaRa Bio), stained with ethidium bromide for DNA band characterization using ultraviolet transillumination to check if the target regions could be amplified. The PCR products were purified with ExoSap-IT (USB Corporation, Cleveland, OH, USA). Subsequently, the PCR products were used for direct cycle sequencing with dye-labelled terminators (Applied Biosystems). The primers used in the sequencing reactions were the same as those used in the initial PCR amplification. Labeled fragments were analysed on an ABI 3130 DNA Sequencer (Applied Biosystems).
Table 2. List of PCR and sequencing primers used in the molecular analysis of Lucifer hanseni.

Sequence and phylogenetic analysis
DNA was extracted from at least 20 individuals per station and PCR amplifications were carried out for all sampled individuals using selected primers for each gene. Only the non-ambiguous amplified DNA sequences were included in the analysis.
A total of 127 consensus sequences for COI, 257 for 12S rRNA, and 194 for nuclear 28S rRNA were generated after the assembly of forward and reverse sequences using Geneious version 5.3.4 (Drummond et al., Reference Drummond, Ashton, Buxton, Cheung, Cooper, Duran, Field, Heled, Kearse, Markowitz, Moir, Stones-Havas, Sturrock, Thierrer and Wilson2010). Subsequently the consensus sequences were aligned using Clustal X (Thompson et al., Reference Thompson, Gibdon, Plewniak, Jeanmougin and Higgins1997). The aligned multiple-sequence matrix of each gene after trimming was 379 bp long for COI, 279 bp for 12S rRNA, and 326 bp for 28S rRNA. DNA sequences were submitted to GenBank (accession numbers: LC003313–LC003491, LC003528–LC003595).
Phylogenetic analyses were performed using maximum likelihood (ML) and Bayesian analyses. The Akaike Information Criterion in MrModeltest 2.3 (Nylander, Reference Nylander2004) was used to identify an appropriate nucleotide substitution model. The best fit substitution models were GTR + I + G for COI, HKY + G for 12S rRNA, and GTR + I for 28S rRNA. The ML analysis was performed using 1000 bootstrap replications for nodal support in PhyML version 3.0 (Guindon & Gascuel, Reference Guindon and Gascuel2003). A Bayesian approach to phylogeny reconstruction was applied using MrBayes v. 3.1.2 (Ronquist & Huelsenbeck, Reference Ronquist and Huelsenbeck2003). The Markov Chain Monte Carlo chains were run for 106 generations with trees sampled every 100 generations. The first 25% of the generated trees were discarded as burn-in. The shrimp Acetes chinensis, a species of the sister family Sergestidae family was used as outgroup (accession number JN689221). Both are the only two classified families of superfamily Sergestoidea (Farfante & Kensley, Reference Farfante and Kensley1997).
Population genetic analyses
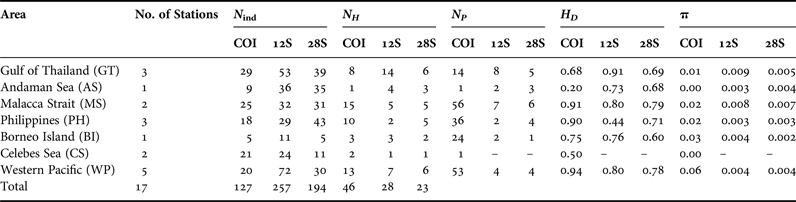
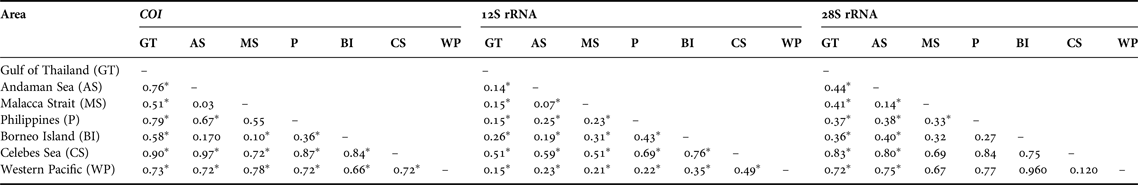
Unless stated otherwise, all the analyses were conducted using Arlequin v. 3.5.1.2 (Excoffier et al., Reference Excoffier, Laval and Schneider2007) and DNAsp 5.0. (Librado & Rozas, Reference Librado and Rozas2009). To explore genetic diversity, the standard measures of genetic diversity including the number of haplotypes (Hn), haplotype diversity (Hd) and nucleotide diversity (π) for each area and clade identified were calculated. In order to gain appreciation of gene flow between populations and characterize the population structure, we estimated pairwise ΦST among and within areas and clades which were determined by phylogenetic analysis, and tested significance of these values with 10,000 random permutations and applied standard Bonferroni corrections.
In order to visualize the diversity and phylogenetic relationships among the different haplotypes and provide qualitative assessment of their geographic distributions, the median-joining (MJ) networks were constructed using Network v. 4.6.1 (http://www.fluxus-engineering.com/) (Bandelt et al., Reference Bandelt, Forster and Röhl1999).
RESULTS
Mitochondrial COI and 12S rRNA
The COI sequences with length of 379 bp from 127 individuals collected from the seven areas yielded a total of 46 haplotypes (Table 3). Haplotype diversity within area ranged from 0.20 to 0.94, whereas nucleotide diversity ranged from 0.001 to 0.06 and the number of polymorphic sites ranged from 1 to 58. Phylogenetic analysis revealed two major clades: COI-A (with subgroups COI-A1 and COI-A2) and COI-B (Figure 2A). These clades were clearly shown in the phylogenetic tree (Figure 2A) and the haplotype network (Figures 3A and B), and with high bootstrap and posterior probability support in Bayesian and ML analyses. The largest group (COI-A) comprised 33 haplotypes and contained individuals from the TMP and CS (Table 4a) separated by one to five substitutions. Furthermore, this group exhibited the largest number of haplotypes, of which one to eight haplotypes were shared (COI: 2, 3, 5, 11, 13, 18 and 23) and the others were represented by a single individual. In contrast, only two haplotypes were found in the CS stations. These haplotypes were located near COI-B on the haplotype network but included in a highly supported monophyletic clade within COI-A on the phylogenetic tree. COI-B contained 13 haplotypes (Table 4) comprising individuals from the WP separated by one to three substitutions. All COI-B haplotypes appeared exclusive to each station.

Fig. 2. Bayesian tree based on sequences of COI (A) 12S rRNA (B) and 28S rRNA (C) of Lucifer hanseni. Numerical values are Bayesian posterior probabilities (left) and maximum likelihood bootstrap values (right). For easy visualization, we have displayed the tree based on mitochondrial gene COI as a phylogram and those based on mitochondrial gene 12S rRNA and nuclear gene 28S rRNA as ultrametric trees.

Fig. 3. Geographic distribution (A) and median joining network (B) of COI haplotypes of Lucifer hanseni. Shading indicates the frequency of occurrence of each haplotype. The numbers inside or at the side of each circle and the colour represent the unique haplotype corresponding to the legend. The circle size is proportional to the frequency of occurrence, ranging from 1–46. The black nodes denote the mutational step.
Table 3. Genetic diversity statistics and tests of selective neutrality for Lucifer hanseni (DNA regions: COI, 12S rRNA, 28S rRNA). Number of individuals sequenced (N ind), number of haplotypes (N H), number of polymorphic sites per population (N P ), haplotype diversity (H D ), and nucleotide diversity (π).

Table 4. Geographic distribution, frequency distribution and number of haplotypes of Lucifer hanseni for: (a) COI, (b) 12S rRNA, and (c) 28S rRNA. Shaded are haplotypes shared between stations and/or between areas.

Table 5. Pairwise ΦST distances between areas for Lucifer hanseni. Asterisks indicate significance level (P) calculated from 10,000 permutations: * for P < 0.001.
Mitochondrial 12S rRNA exhibited 28 haplotypes from 257 sequences 279-bp long. Haplotype diversity within area ranged from 0.44 to 0.91, while nucleotide diversity ranged from 0.003 to 0.009 (Table 3). The occurrence of polymorphic sites was low, with values ranging from two to eight and no polymorphic sites in the CS populations. Two distinct clades (12S-A and 12S-B) were revealed with strong statistical support in the Bayesian and ML analyses (Figure 2B). Clade 12S-A comprised eight haplotypes and consisted of individuals from the WP and CS (Figures 4A, B, Table 4b). Meanwhile, clade 12S-B comprised individuals from TMP with 20 haplotypes (Figures 4A, B). The majority of the individuals found in the two clades were separated by a single substitution. Sixteen haplotypes were private (found in more than one individual, but only in one population). Sharing of haplotypes was apparent in 12S-B with eight haplotypes (12S: 1, 10, 12, 16, 17, 18, 19 and 20) shared either within stations or within regions, while four haplotypes (12S: 23, 24, 27, and 28) were shared in 12S-A clade (Figures 4A, B).

Fig. 4. Geographic distribution (A) and median-joining network (B) of 12S rRNA haplotypes of Lucifer hanseni. Shading indicates the frequency of occurrence of each haplotype. The numbers inside or at the side of each circle and the colour represent the unique haplotype corresponding to the legend. The circle size is proportional to the frequency of occurrence, ranging from 1–28. The black nodes denote the mutational step.
Nuclear 28S rRNA
The sequences of the nuclear 28S rRNA yielded the lowest number of haplotypes (23, ranging from one to six) from 194 sequences 326-bp long (Table 3). The measure of genetic variability exhibited generally low diversity in both haplotypes and nucleotides compared with the mitochondrial genes (Table 3). The occurrence of polymorphic sites was also low, with values ranging from 1 to 7 sites. Phylogenetic reconstructions generated two clades, 28S-A and 28S-B, with high statistical support inferred by the Bayesian and ML analyses (Figure 2C). The haplotype network was similar to that of the mitochondrial 12S rRNA and separated only by a single substitution. 28S-A comprised populations from the CS and WP with six haplotypes, while 28S-B comprised 17 haplotypes that included individuals from the TMP (Figures 5A and B). Seven haplotypes were shared, three within 28S-A (28S: 2, 3 and 4), four within 28S-B (28S: 7, 8, 9 and 11), and 16 haplotypes were found to be private (Table 4c).

Fig. 5. Geographic distribution (A) and median-joining network (B) of 28S rRNA haplotypes of Lucifer hanseni. Shading indicates the frequency of occurrence of each haplotype. The numbers inside or at the side of each circle and the colour represent the unique haplotype corresponding to the legend. The circle size is proportional to the frequency of occurrence, ranging from 1–23.
Genetic and phylogeographic structure
The analyses of pairwise population genetic differentiation (ΦST) revealed highly significant differences between areas (Table 5) and clades (Table 6). All comparisons remained significant even after Bonferroni corrections were employed. The CS and WP are strongly isolated and most differentiated from the TMP areas, while the latter are closely related. Furthermore the haplotype composition was different between stations. For example, just one sequence was shared in MS for COI, although 15 haplotypes were found. Also, the genetic differentiation was observed between north and south in WP region based on COI and 28S haplotype composition.
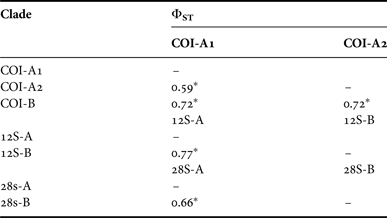
Table 6. Pairwise ΦST distances between major clades for Lucifer hanseni. DNA regions: COI, 12SrRNA, 28SrRNA. * Indicates significant differences for P < 0.001.
DISCUSSION
Marine holoplankton are often presumed to exhibit limited genetic structure and high gene flow among populations throughout their biogeographic range due to their extremely large population sizes, high dispersal potential and lack of obvious physical barriers in the pelagic realm (Palumbi, Reference Palumbi1992; Norris, Reference Norris2000). However, many empirical studies have detected genetic structure over a range of spatial scales including between basins, between gyres within ocean basin, regionally among coastal embayments and estuaries, and variation across different species even sometimes collected at the same site (Miyamoto et al., Reference Miyamoto, Machida and Nishida2010; Blanco-Bercial et al., Reference Blanco-Bercial, Alvarez-Marquez and Bucklin2011; Chen & Hare, Reference Chen and Hare2011; Goetze, Reference Goetze2011). These studies suggested that population genetic structure may be prevalent in marine zooplankton, contrary to prior predictions. It was suggested further that the observed genetic structures appeared to be linked to ecological and/or environmental requirements of the organisms as well as to biophysical and different oceanographic features.
This study presents the first phylogeographic and population-genetic analyses of a holoplanktonic metazoan species in the Indo-Malayan Archipelago, demonstrating the presence of a moderate to strong genetic population structure in L. hanseni. Possible factors contributing to the phylogeographic patterns observed in this study are discussed below with reference to the body of information from the previous studies.
The pattern of genetic structure along the TMP, which includes the Andaman Sea, Gulf of Thailand, Malacca Strait, Borneo Island and the Philippines, imprints a mixed pattern of isolation (high number of haplotypes and high haplotype diversity) yet an ongoing gene flow (haplotype sharing). The signal of isolation was supported by the analysis of gene flow patterns through pairwise ΦST values (Table 5), which show differentiation among populations across the three genes. Also genetic differentiation appears to have occurred between the neighbouring stations within the region on the basis of haplotype frequency in each station. For COI, the present study might be unable to grasp all the haplotypes that occurred in a station, because the local diversity of haplotype was remarkably high. However, the results from all genes suggest that gene flow might be limited between stations within TMP even though they were close to each other geographically. This implies that TMP might be a high potential region for allopatric speciation. Furthermore, the mixed occurrence of haplotypes in the MJ network (Figures 3–5) and monophyletic clade trees (Figure 2) indicates the presence of gene flow within this area (Table 4), while the observed shared haplotypes between areas, although scattered, may suggest maintenance of the widespread ancestral haplotypes. Thus, it is possible that this area harbours remnants of the oldest as well as recent variations of this species. Such variations have been observed in other marine organisms in the area, consistent with the notion that this area contains a large number of marine organisms and high speciation opportunity (Benzie, Reference Benzie, Hall and Holloway1998; Carpenter, Reference Carpenter, Carpenter and Niem1998; Carpenter & Springer, Reference Carpenter and Springer2005). The extensive, shallow, continental Sunda Shelf across the Gulf of Thailand is among the prominent marine biogeographic landmarks in the Indo-Malayan region (Kochzius et al., Reference Kochzius, Seidel, Hauschild, Kirchhoff, Mester, Meyer-Wachsmuth, Nuryanto and Timm2009) and most likely played a significant role in shaping population genetic patterns in this species. After the last ice age, seawater filled the Gulf of Thailand and connected the Java and the Andaman Sea with the South China Sea (Woodruff, Reference Woodruff2010). This provided a favourable habitat for rapid re-colonization of previously exposed land with rising sea levels and could have intensified genetic differentiation of populations in the region through the founder effect (Hanebuth et al., Reference Hanebuth, Stattegger and Grootes2000). The latter is considered a significant contributor to genetic patterns in several marine species throughout this region (Lind et al., Reference Lind, Brad, Elphinstone, Taylor and Jerry2012). The exposure of the Sunda Shelf during several Pliocene and Pleistocene glacial low sea-level stands may have consequently reduced the population size of the marine organisms. In contrast, the rising sea level in the interglacial periods initiated the colonization of new habitats, resulting in a demographic and spatial population expansion. Furthermore, the sharing of haplotypes in L. hanseni observed in the region may have been a result of a recent or ongoing migration process (range of dispersal or gene flow), which could have started only during the interglacial periods, while the contemporary oceanographic circulation may have contributed to the continuous connectivity of the populations in the region up to the present.
The CS population exhibited an interesting pattern with both unique haplotype and low nucleotide diversity (Table 3), while the other areas of TMP and WP exhibited moderate to high haplotype diversities. As mentioned above, the terrestrial area increased during the low sea level in the Pleistocene, suggesting that semi-enclosed seas, such as the Sulu and Celebes Seas, were more isolated from the adjacent seas during this period (Voris, Reference Voris2000). It appears that the populations in these areas may have undergone a bottleneck and/or founder effect, which is attributable to the unique geographic and hydrographic feature of this area. The founder effect has been a popular hypothesis of the origin of species featuring geographic isolation and population differentiation in many organisms (Coyne & Orr, Reference Coyne and Orr2004), such as the reef sponge Leucetta chagosensis (Wörheide et al., Reference Wörheide, Sole-Cava and Hooper2005) and stomatopod Haptosquilla pulchella (Barber et al., Reference Barber, Moosa and Palumbi2002a, Reference Barber, Palumbi, Erdmann and Moosab).
The clear isolation of WP from TMP and CS was indicated by haplotype frequency of mitochondrial and nuclear genes. Furthermore the monophyletic tree of TMP and WP populations was supported by high bootstrap values, suggesting highly limited gene flow between them. The observed low gene flow and genetic divergence suggests that the highly divergent WP clade evolved due to limited genetic exchange over an extended period of time and limited dispersal, which was attributed to low water transport from Papua New Guinea to the Asian region and Indian Ocean even at high sea levels (Lind et al., Reference Lind, Brad, Elphinstone, Taylor and Jerry2012). The low water transport is in turn attributable to the retroflection of the South Pacific waters by the Halmahera Eddy (Morey et al., Reference Morey, Shriver and O'Brien1999; Carpenter et al., Reference Carpenter, Barber, Crandall, Ablan-Lagman, Ambariyanto, Manjaji-Matsumoto, Junio-Meñez, Santos, Starger and Toha2011). The present results support the hypothesis of limited dispersal and connectivity because these regions belong to different current systems and the population might have been genetically segregated compared with those within the TMP area. The limited dispersal or gene flow in the areas, especially between CS and WP, has been reported in various marine organisms, e.g. stomatopod Haptosquilla pulchella (Barber et al., Reference Barber, Moosa and Palumbi2002a, Reference Barber, Palumbi, Erdmann and Moosab), starfish Protoreaster nodusus (Williams & Benzie, Reference Williams and Benzie1998), giant clams Tridacna crocea and Tridacna maxima (DeBoer et al., Reference DeBoer, Subia, Ambariyanto, Kovitvongsa and Barber2008), and gastropods Nerita albicilla and Nerita plicata (Crandall et al., Reference Crandall, Frey, Grosberg and Barber2008). However, dispersal is still possible between the WP and CS via the ITF (Williams & Benzie, Reference Williams and Benzie1998), albeit at a reduced rate.
In holoplankton, despite lack of obvious geographic barriers and dispersal capabilities, many molecular studies have revealed abundant cryptic species diversity such as chaetognaths (Peijnenburg et al., Reference Peijnenburg, Breeuwer, Pierrot-Bults and Menken2004; Miyamoto et al., Reference Miyamoto, Machida and Nishida2010) cnidarians (Dawson & Jacobs, Reference Dawson and Jacobs2001) and copepods (Blanco-Bercial et al., Reference Blanco-Bercial, Alvarez-Marquez and Bucklin2011; Chen & Hare, Reference Chen and Hare2011; Goetze, Reference Goetze2011). Among them, some species previously thought to be cosmopolitan were found to consist of multiple diversified genetic lineages. In the present study, the robust allopatric differentiation supported by mitochondrial and nuclear genes were found between WP and TMP. However a reproductive isolation might have not occurred between these populations because genetic distance was remarkably lower than those commonly observed between congeneric species of crustaceans (Herbert et al., Reference Herbert, Ratnasingham and deWaard2003).
CONCLUSIONS
In conclusion, molecular data of both nuclear and mitochondrial DNA of the holoplanktonic shrimp Lucifer hanseni is characterized by high genetic diversity, exhibiting different genetic lineages within the Indo-Malayan Archipelago and its vicinities, which is consistent with major patterns reported on various marine organisms in the region. The phylogeographic structure concords well with the geographic regions effectively isolated during the lowering of sea level associated with Pleistocene glaciation and by contemporary oceanographic circulations. The most salient genetic patterns are (1) high genetic diversity centred in the TMP area suggesting a high speciation opportunity for this species, (2) dramatic decrease in genetic diversity in the CS populations, which is probably due to a founder/bottleneck effect by the lowering of sea level associated with Pleistocene glaciation, and (3) distinct and highly divergent WP populations attributed to the historical and prevailing oceanographic conditions. The results show that genetic differentiation and isolation can be attained even in species with high dispersal capability and large population size in a seemingly continuous habitat. How these identified key features affect the genetic structure and pattern of gene flow across the Indo-Malayan Archipelago merits further study. In particular, the analysis of additional samples from Indonesia may provide a more comprehensive perspective of the pattern of gene flow and structure across the region.
ACKNOWLDGEMENTS
The authors thank the captains and crew members of the RVs Tansei Maru and Hakuho Maru, the plankton group of the Ocean Research Institute of the University of Tokyo, and the OceanBio and Marine Bio people of the University of the Philippines Visayas who assisted with field collections. We extend our gratitude to Professor Aoyama for the collection of samples in the South Pacific region.
FINANCIAL SUPPORT
This study was supported in part by grants from the Asian CORE Program of the Japan Society for the Promotion of Science and the Ministry of Education, Malaysia.