


Introduction
Since the early 1990s, the harbour porpoise (Phocoena phocoena) has made a significant return along the North Sea coasts of Europe due to a shift of their distribution from the northern to southern North Sea and it is currently the most abundant species of cetacean (Hammond et al., Reference Hammond, Berggren, Benke, Borchers, Collet, Heide-Jorgensen, Heimlich, Hiby, Leopold and Øien2002, Reference Hammond, MacLeod, Berggren, Borchers, Burt, Canadas, Desportes, Donovan, Gilles, Gillespie, Gordon, Hiby, Kuklik, Leaper, Lehnert, Leopold, Lovell, Oien, Paxton, Ridoux, Rogan, Samarra, Scheidat, Sequeira, Siebert, Skov, Swift, Tasker, Teilmann, Van Canneyt and Vazquez2013, Reference Hammond, Lacey, Gilles, Viquerat, Börjesson, Macleod, Ridoux, Santos, Scheidat, Teilmann, Vingada and Øien2017; Evans et al., Reference Evans, Anderwald and Baines2003; Reid et al., Reference Reid, Evans and Northridge2003; Camphuysen, Reference Camphuysen2004, Reference Camphuysen2011; Kiszka et al., Reference Kiszka, Haelters and Jauniaux2004, Reference Kiszka, Macleod, Van Canneyt, Walker and Ridoux2007; Gilles et al., Reference Gilles, Adler, Kaschner, Scheidat and Siebert2011). However, in this region and across European Atlantic waters, the species faces multiple threats, particularly from by-catch in fishing nets (Vinther & Larsen, Reference Vinther and Larsen2004; Siebert et al., Reference Siebert, Gilles, Lucke, Ludwig, Benke, Kock and Scheidat2006; ICES, 2008; Jauniaux et al., Reference Jauniaux, Berguerie, Camphuysen, Daoust, Drouguet, Ghisbain, Garcia- Hartmann, Grondin, Haelters, Jacques, Kiszka, Leopold, Pezeril, Schnitzler and Coignoul2008; Gilles et al., Reference Gilles, Adler, Kaschner, Scheidat and Siebert2011; Haelters et al., Reference Haelters, Kerckhof, Jacques and Degraer2011), chemical (Mahfouz et al., Reference Mahfouz, Henry, Courcot, Pezeril, Bouveroux, Dabin, Jauniaux, Khalaf and Amara2014a, Reference Mahfouz, Henry, Jauniaux, Khalaf and Amara2014b; Murphy et al., Reference Murphy, Barber, Learmonth, Read, Deaville, Brownlow, Davidson, Penrose, Pierce, Law and Jepson2015; Jepson et al., Reference Jepson, Deaville, Barber, Aguilar, Borrell, Murphy, Barry, Brownlow, Barnett, Berrow, Cunningham, Davison, Ten Doeschate, Esteban, Ferreira, Foote, Genov, Giménez, Loveridge, Llavona, Martin, Maxwell, Papachlimitzou, Penrose, Perkins, Smith, de Stephanis, Tregenza, Verborgh, Fernandez and Law2016) and noise pollution from commercial boat traffic and wind farm development (Gilles et al., Reference Gilles, Scheidat and Siebert2009, Reference Gilles, Adler, Kaschner, Scheidat and Siebert2011; Scheidat et al., Reference Scheidat, Tougaard, Brasseur, Cartensen, van Polanen Petel, Teilmann and Reijnders2011), as well as seismic surveys and explosions of military ordnance (Von Benda-Beckman et al., Reference Von Benda-Beckmann, Aarts, Sertlek, Lucke, Verboom, Kastelein, Ketten, van Bemmelen, Lam, Kirkwood and Ainslie2015). To maintain a favourable conservation status of the species (and other small cetaceans), a regional Agreement on the Conservation of Small Cetaceans in the Baltic and North Seas (ASCOBANS) was created in 1992, which was expanded over a wider region of the North-east Atlantic in 2008 (ASCOBANS, 2009; IJsseldijk et al., Reference IJsseldijk, ten Doeschate, Davison, Gröne and Brownlow2018). The harbour porpoise is also protected and listed as threatened or endangered in several international agreements (e.g. the European Habitats Directive, Bonn Convention, CITES and IUCN Red List; ASCOBANS, 2009).
The distribution and abundance of harbour porpoises in English Channel waters are still not fully understood, particularly the spatial and temporal variation of their occurrence and the ecological drivers explaining these variations. Three large-scale surveys (SCANS – Small Cetacean Abundance in the North Sea and adjacent waters) aimed at quantifying the abundance of small cetaceans in the North Sea and adjacent Atlantic waters in 1994, 2005 and 2016 (Hammond et al., Reference Hammond, Berggren, Benke, Borchers, Collet, Heide-Jorgensen, Heimlich, Hiby, Leopold and Øien2002, Reference Hammond, MacLeod, Berggren, Borchers, Burt, Canadas, Desportes, Donovan, Gilles, Gillespie, Gordon, Hiby, Kuklik, Leaper, Lehnert, Leopold, Lovell, Oien, Paxton, Ridoux, Rogan, Samarra, Scheidat, Sequeira, Siebert, Skov, Swift, Tasker, Teilmann, Van Canneyt and Vazquez2013, Reference Hammond, Lacey, Gilles, Viquerat, Börjesson, Macleod, Ridoux, Santos, Scheidat, Teilmann, Vingada and Øien2017). However, although these surveys cover a large geographic area (European continental shelf waters), they were conducted over a short period of time and during summer only (month of July), providing a snapshot of their abundance and distribution. In the English Channel, aerial surveys (SAMM – Suivi Aérien de la Mégafaune Marine) were also carried out to investigate the abundance, habitat and ecological preferences of harbour porpoises during the winters of 2011 and 2012 and the summer of 2012 (Lambert et al., Reference Lambert, Pettex, Dorémus, Laran, Stéphan and Van Canneyt2017; Laran et al., Reference Laran, Authier, Blanck, Dorémus, Falchetto, Monestiez, Pettex, Stephan, Van Canneyt and Ridoux2017). More recently, specific aerial surveys were undertaken to estimate marine mammal abundance and distribution in the eastern English Channel (Virgili et al., Reference Virgili, Authier, Dars, Dorémus, Laran, Van Canneyt and Spitz2018). All these studies reveal that both the abundance and encounter rates as well as densities of harbour porpoises were significantly higher during the winter (late November to mid-February) and showed clear preferences for shallow waters and strong hydrological activity. Conversely, during summer (mid-May to early August), harbour porpoises occurred at lower densities and further offshore (Lambert et al., Reference Lambert, Pettex, Dorémus, Laran, Stéphan and Van Canneyt2017; Laran et al., Reference Laran, Authier, Blanck, Dorémus, Falchetto, Monestiez, Pettex, Stephan, Van Canneyt and Ridoux2017; Virgili et al., Reference Virgili, Authier, Dars, Dorémus, Laran, Van Canneyt and Spitz2018). Other local studies conducted on a year-round basis also reveal high seasonality in abundance and strandings in UK (Leeney et al., Reference Leeney, Amies, Broderick, Witt, Loveridge, Doyle and Godley2008), French (Dars et al., Reference Dars, Dabin, Demaret, Dorémus, Meheust, Mendez-Fernandez, Peltier, Spitz and Van Canneyt2018), Belgian (Haelters et al., Reference Haelters, Kerckhof and Jauniaux2018), Dutch and German (Siebert et al., Reference Siebert, Gilles, Lucke, Ludwig, Benke, Kock and Scheidat2006) waters over the last 15 years. Overall, these studies showed that both the abundance and the number of strandings of harbour porpoises were higher in the southernmost part of the North Sea during the winter (Jauniaux et al., Reference Jauniaux, Berguerie, Camphuysen, Daoust, Drouguet, Ghisbain, Garcia- Hartmann, Grondin, Haelters, Jacques, Kiszka, Leopold, Pezeril, Schnitzler and Coignoul2008; Camphuysen, Reference Camphuysen2011; Scheidat et al., Reference Scheidat, Verdaat and Aarts2012; Geelhoed et al., Reference Geelhoed, Scheidat, van Bemmelen and Aarts2013; Dars et al., Reference Dars, Dabin, Demaret, Dorémus, Meheust, Mendez-Fernandez, Peltier, Spitz and Van Canneyt2018; Geelhoed & Scheidat, Reference Geelhoed and Scheidat2018) and higher in the central part of the North Sea in summer (Siebert et al., Reference Siebert, Gilles, Lucke, Ludwig, Benke, Kock and Scheidat2006; Gilles et al., Reference Gilles, Viquerat, Becker, Forney, Geelhoed, Haelters, Nabe-Nielsen, Scheidat, Siebert, Sveegaard, van Beest, van Bemmele and Aarts2016; Peschko et al., Reference Peschko, Ronnenberg, Siebert and Gilles2016; Geelhoed & Scheidat, Reference Geelhoed and Scheidat2018).
The present study uses platform-of-opportunity surveys to investigate spatial and temporal variations in harbour porpoise sightings and relative abundance in the Southern Bight of the North Sea (between France and England). This assessment is divided into two processes. First, we tested for temporal variations in harbour porpoise sightings and relative abundance amongst months and years. Second, we tested whether temporal and spatial variations in sightings could be explained by environmental conditions (monthly temperature, yearly temperature, seabed roughness, current speed) likely to influence prey abundance and availability in the study area. With this study, we also highlighted the effectiveness of using platform-of-opportunity surveys at a fine spatial and temporal scale, to collect data on harbour porpoises in an area of high levels of human threats (e.g. by-catch).
Materials and methods
Study area
The survey area focused upon the Dover Strait (southern North Sea), between France and England (Figure 1). This region is characterized by strong hydrodynamic features (Vaz et al., Reference Vaz, Carpentier, Loots and Koubbi2004). The very narrow width at its eastern end (34 km) and shallow waters not exceeding 65 m in depth, generate strong currents (Bahé et al., Reference Bahe, Sumser-Lupson, Rossiter, Kinch, Pardo and Lewey2007), which are reinforced by the strong winds that may occur in this region, especially during autumn and winter. The eastern English Channel is also characterized by a residual drift, which brings some Atlantic water to the North Sea (Gentilhomme & Lizon, Reference Gentilhomme and Lizon1998).

Fig. 1. Map of the study area and ferry routes (dashed lines).
With the passage of over 500 ships a day, this area is one of the busiest seaways in the world for maritime traffic (Acott & Urquhart, Reference Acott, Urquhart, Urquhart, Acott, Symes and Zhao2014), with several other anthropogenic activities including industrial, artisanal and recreational fisheries also occurring within the study area (Vinther & Larsen, Reference Vinther and Larsen2004; OSPAR, 2009; Scheidat et al., Reference Scheidat, Couperus and Siemensma2018).
Data collection
Sightings of harbour porpoise
Surveys were conducted using passenger ferry vessels operating between Dunkirk (France) and Dover (England), as platforms-of-opportunity. Three similar vessels (DFDS Seaways) of about 186 m long followed approximately the same route from Dunkirk to Dover at relatively constant speeds of around 16 knots (Figure 1). Surveys were carried out between November 2011 and June 2014 with one round trip survey (~4 h) per week on average and with the same departure time (10:00 h from Dunkirk). Because decisions to undertake ferry boat trips were made only two to three days beforehand according to the weather forecast, the data collection was only carried out under optimal conditions of observation to increase the likelihood that observers would detect harbour porpoises within the search area from both sides of the ferry transect (e.g. no rain or fog, wind speed of max 4 Beaufort). During every survey, data were collected by two experienced observers from the wheelhouse at 25 m above sea level, searching 180° ahead of the ship (90° either side of the track line for each observer), with continuous scanning using the naked eye to detect cetacean species and, in particular, harbour porpoises. Binoculars (10 × 42) were used to verify species identification when necessary. The survey effort (distance travelled) was recorded at the start and end of each survey leg using a handheld Global Positioning System (GPS Garmin Oregon 400t). For each sighting, the date, time, geographic position, the group size (best estimate number of individuals encountered in a group) and its composition (number of adults and/or calves encountered; individuals were classified as calves if their estimated size was less than half the size of the adult – Gilles et al., Reference Gilles, Scheidat and Siebert2009) were recorded. Groups of harbour porpoises were defined as individuals having the same activity and being in close proximity to each other (<100 m).
Environmental conditions
Two static environmental conditions were used to investigate possible drivers of spatial variations in sightings: (1) bathymetry from EMODnet in combination with a terrain ruggedness index (TRI) was used to quantify seabed roughness (in metres), identifying bathymetric features; and (2) mean surface current speeds were extracted from an existing FVCOM hydrodynamic model (Cazenave et al., Reference Cazenave, Torres and Allen2016), to assess the influence of the water velocity on harbour porpoises during the entire study period. Two dynamic environmental conditions were then used to investigate possible drivers of temporal variations in sightings: (1) yearly temperature, which was the mean temperature over the preceding 12 months across the study region; and (2) monthly temperature, which was the mean temperature in each month across the study period and region. Both were sourced from 7 km resolution FOAM AMM7 simulation models, available from the Marine Environmental Monitoring System (http://marine.copernicus.eu). Annual and monthly temperatures were chosen over concurrent temperatures because a species' biogeographic range could be determined by annual temperatures, whilst seasonal movement within this range is determined by monthly temperatures. For instance, a species could move south during cooler months, although their biogeographic range could shift north during warmer years. Dividing temperature values into annual and monthly components allows these scale-dependent relationships to be detected. To identify surveys when rough weather would have decreased the detectability of animals, daily-averaged wind speeds (m s−1) were obtained from the offshore buoy Westhinder (51.388°N 2.4378°E) (https://meetnetvlaamsebanken.be).
Data analysis
Data processing
We used the estimated number of harbour porpoises observed in groups to assess the seasonal and annual variations of the mean group size. Sightings of harbour porpoises and environmental conditions were quantified at 1 km and daily resolution using a grid system. The presence (no animals detected = 0, animals detected = 1) and aggregation size (the cumulative number of animals detected) of harbour porpoise per cell were calculated. Seabed roughness was resampled at 1 km resolution using bilinear interpolation in the ‘raster’ package in R (Hijmans & van Etten, Reference Hijmans and van Etten2012). Finally, mean surface current speeds were interpolated at 1 km resolution using kriging techniques in the ‘automap’ package of R (Hiemstra et al., Reference Hiemstra, Pebesma, Twenhofel and Heuvelink2009). As monthly and yearly temperatures represented mean values across the study area, these did not need processing at a fine resolution.
Temporal variations
Temporal variations in the encounter probability and aggregation size per cell were tested for significance using General Additive Models (GAMs) with a binomial and Poisson distribution, respectively. For the binomial model, the response variable was the presence (1) or absence (0) of a porpoise in a cell; for the Poisson model, it was the number of porpoises detected, when encountered. In both models, the explanatory variables were Julian date, year (2011–2014) and wind speed (m s−1). The latter was included to account for the strong likelihood of decreased sighting rates during surveys in rough seas. Wind speed was modelled as a continuous linear variable, and year as a categorical variable. Julian date was modelled as a continuous, non-linear and circular variable. The number of knots was constrained to six to provide ecologically interpretable relationships. The number of kilometres travelled was included as a statistical offset to account for unequal effort among cell visits.
Environmental drivers
Possible environmental drivers of temporal and spatial variations in encounter probabilities and aggregation size were identified using General Linear Models (GLMs) with binomial and Poisson distributions, respectively. The response variables were the same as above. The explanatory variables were yearly temperature (°C), monthly temperature (°C), seabed roughness (m), mean current speed (m s−1) and wind speed (m s−1): all were modelled as continuous and linear variables. Seabed roughness and mean current speed were modelled as interactions with monthly temperature to identify any seasonal variations in habitat-use. Wind speed was again included to account for decreased sightings during rough seas, and the number of kilometres travelled included as a statistical offset to account for unequal effort among cell visits. GLM were chosen over GAM because it was believed that relationships with temperature, speed and bathymetric roughness would be linear if these environmental conditions caused variations in encounter probabilities and aggregation sizes (Cox et al., Reference Cox, Embling, Hosegood, Votier and Ingram2018).
Model performance
Backwards model selection was performed, and only statistically significant explanatory variables (P < 0.05) were retained. When interactive terms were not significant, they were directly replaced with appropriate non-interactive terms, and model selection restarted. Residuals showed little evidence of spatiotemporal auto-correlation or heterogeneity (see Supplementary Figure S1). Analysis was performed using the ‘mgcv’ package in R Statistics (Wood, Reference Wood2017). Relationships between sightings and explanatory variables were illustrated using model parameters, whereby the focal explanatory variable was varied between its minimum and maximum value, and others were retained at their mean value. However, wind speed was retained at 0 to represent optimal conditions, whilst the number of kilometres travelled was retained at 1 km to provide probability of encounters and aggregation size per kilometre travelled.
Predicted encounter rates
Spatial and temporal variations in encounter rates (number of animals per km) were predicted using environmental associations with temperature, seabed roughness and current speed. In these predictions, the number of kilometres travelled was fixed at 1 km, and the wind speed at 0 for similar reasons to those mentioned above. For each cell, the probability of encountering porpoise was multiplied by the aggregation size if encountered, producing an estimate of the encounter rate. These maps were designed to illustrate general spatial and temporal variations in sightings, rather than predictions of absolute numbers or distributions of porpoise. Outputs were provided at monthly intervals between 2012 and 2014 and summarized using monthly and annual averages. Data processing and illustrations were performed using the ‘raster’ package in R Statistics (Hijmans & van Etten, Reference Hijmans and van Etten2012).
Results
Summary
Between November 2011 and June 2014, 100 round-trip ferry-boat surveys between Dunkirk and Dover were conducted, with a total of 504 h and 12,823 km of survey effort (Figure 2). The detailed survey effort and summary results are presented in Table 1. During this period, 1450 sightings (of 2652 individuals) were recorded. The mean encounter rate was 0.11 sightings km−1, although both seasonal and annual variations were observed. Encounter rates were larger in winter (mean = 0.23 sightings km−1) with a peak recorded in winter 2014 (0.31 sightings km−1), while lower during the spring (mean = 0.04 sightings km−1) and in particular in spring 2012 with only 0.01 sightings km−1 recorded. Encounter rates increased between 2012 and 2014; averaging 0.11 in 2012, 0.19 in 2013 and 0.45 in 2014 (Table 1).
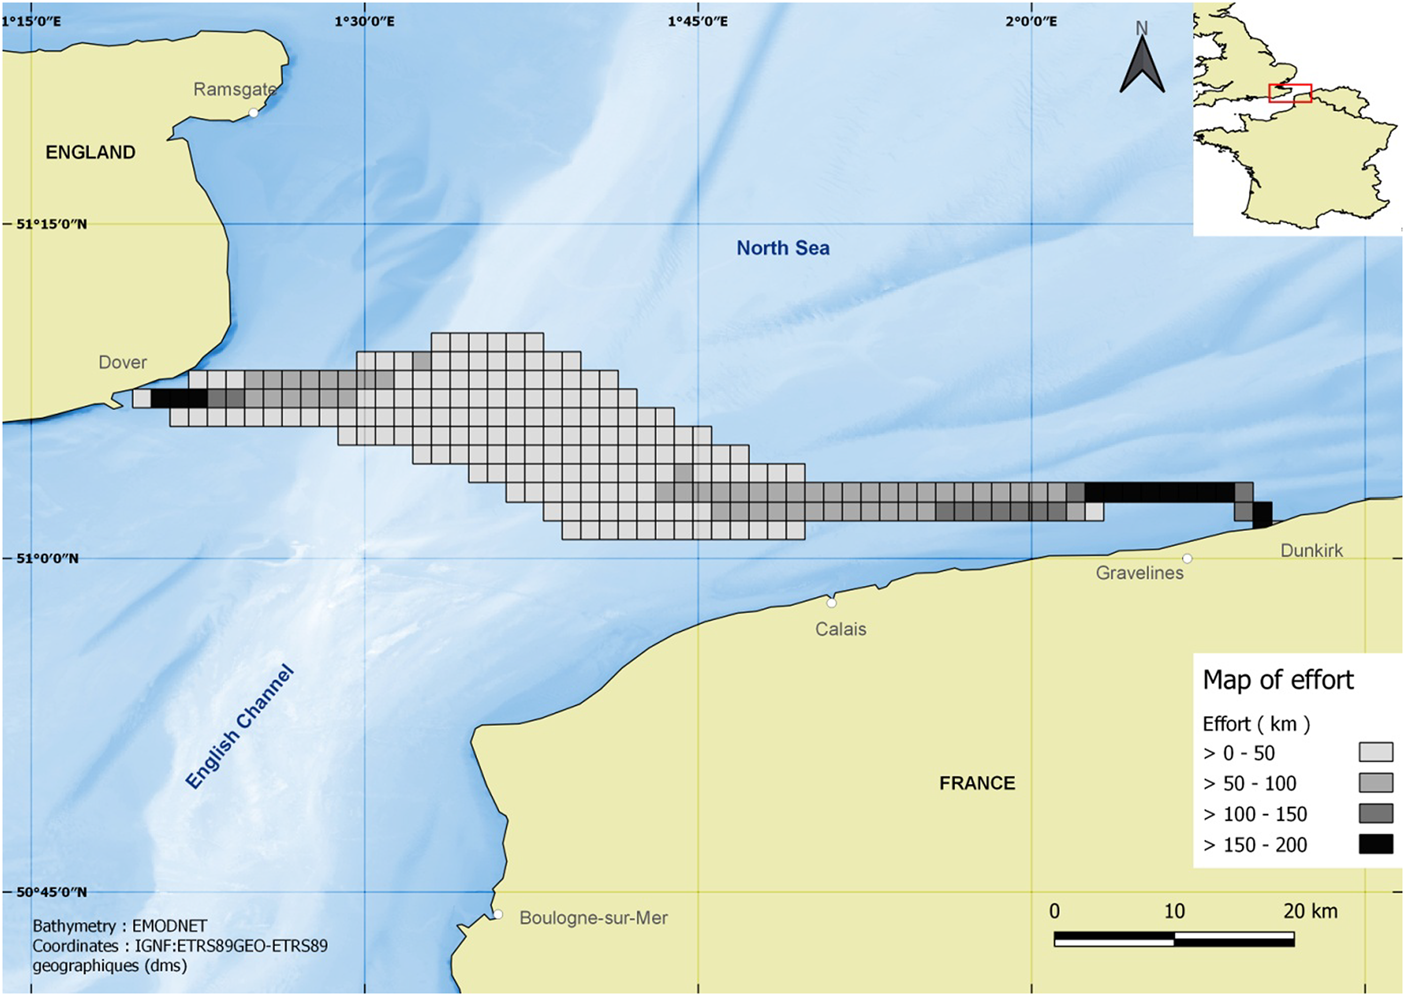
Fig. 2. Map representing the survey effort from ferries between Dunkirk and Dover and the presence (grey) and absence (white) of harbour porpoises in 1 × 1 km squares. Data from November 2011 to June 2014 have been pooled (N = 1450).
Table 1. Summary of survey effort conducted by season (Winter = January–March, Spring = April–June, Summer = July–September, Autumn = October–December) and year between 2011 and 2014, with the number of surveys, sightings of harbour porpoise and individuals, mean group size (SE: standard error) as well as the encounter rate (number of sightings per km) and relative abundance (number of animals seen per km). The numbers in bold font indicate the highest values for each year.

Temporal variations
Overall, when encountered, the mean group size of harbour porpoises was 1.83 (SE = 0.03, range = 1–15), although temporal variations were observed. Group sizes were larger in winter than summer, with an average of 2.32 in January (N = 156, SE = 0.14, range = 1–15) and 1.39 in September (N = 38, SE = 0.11, range = 1–4). Group size also increased between 2012 and 2014, with an average of 1.57 (SE = 0.05) individuals observed in 2012, 1.77 (SE = 0.05) in 2013 and 2.02 (SE = 0.06) in 2014 (Table 1).
Encounter probability (df = 6, χ2 = 316.2, P < 0.01) and aggregation size (df = 6, χ2 = 26.24, P < 0.01) also showed significant variations amongst months, with higher predicted values during winter (Figure 3). However, estimated variations from model parameters indicate a greater seasonal variation in the encounter probability than in aggregation size (Figure 3). Both encounter probability (df = 3, χ2 = 34.09, P < 0.01) and aggregation size (df = 3, χ2 = 38.34, P < 0.01) showed a significant increase between 2012 and 2014. In this case, relationships suggested that annual variation was similar for encounter probabilities and aggregation sizes. Wind speed had a negative impact on both encounter probability (df = 1, χ2 = 81.07, P < 0.01) and aggregation size (df = 1, χ2 = 45.95, P < 0.01; Figure 3).

Fig. 3. Estimated variations of encounter probability (probability of encountering animals per km travelled) and aggregation size of harbour porpoises (number of animals km−1 travelled, when encountered) according to month, year and wind speed (m s−1) (N = 1450).
Environmental drivers
Significant negative relationships with monthly temperature may explain variations in both encounter probability (interaction with current speed, df = 1, χ2 = 10.097, P < 0.01; interaction with seabed roughness, df = 1, χ2 = 7.060, P < 0.01) and aggregation size (df = 1, χ2 = 17.790, P < 0.01) amongst months (Figure 4). Similarly, significant positive relationships with yearly temperature could explain variations in encounter probabilities (df = 1, χ2 = 3.045, P = 0.02) and aggregation size (df = 1, χ2 = 11.470, P < 0.01) amongst years (Figure 4); yearly temperatures generally increased over the study period. However, 2012 and 2013 showed similar yearly temperatures (2012 = 11.96°C; 2013 = 11.85°C; 2014 = 13.14°C), whilst relationships with yearly temperature were weak in comparison to those with year (Figure 4). Therefore, other environmental drivers may better explain annual variations in sightings.

Fig. 4. Functional plots of environmental variables relative to the encounter probability (probability of encountering animals per km travelled) and the relative abundance of harbour porpoise (number of animals km−1) (N = 1450).
The encounter probability showed a significant interaction with monthly temperature and mean current speed; sightings were more likely in stronger currents during cooler months while they were more frequent in weaker currents during warmer months (df = 1, χ 2 = 10.097, P < 0.01; Figure 5), indicating seasonal shifts between slower coastal waters in summer to faster deeper waters in winter respectively. A similar change was seen between flatter seabed in winter months to rougher seabed in summer months (df = 1, χ2 = 7.060, P < 0.01), although seabed roughness had a much smaller influence than mean current speed (Figure 4). Aggregation size showed a significant positive relationship with current speed across months (df = 1, χ2 = 55.530, P < 0.01) (Figure 4) but no relationship with seabed roughness. Wind speed had a negative impact on encounter probability (df = 1, χ2 = 100.115, P < 0.01) and aggregation sizes (df = 1, χ2 = 23.240, P < 0.01).

Fig. 5. Spatio-temporal variation in the prediction of the relative abundance of harbour porpoises (number of animals km−1) in the Southern Bight of the North Sea (N = 1450).
Predicted encounter rates
The predicted encounter rate of harbour porpoises (number of animals per km) was highly heterogeneous (Figure 5). During the study period, the encounter rates increased during winter months (January–April) and over the years (maximum in 2014). Seasonal changes in habitat use is observed amongst months, with the highest encounter rates occurring in offshore habitats during the winter months and inshore habitats during summer months. On closer inspection, encounter rates suggest variable occupancy of offshore areas, but relatively consistent occupancy of coastal habitats (Figure 5).
Discussion
Several large-scale studies have been conducted previously in the North Sea and surrounding waters. For instance, SCANS surveys I, II and III conducted at a very large scale over a short period of time, have provided high quality snapshots of the abundance and distribution of cetaceans (Hammond et al., Reference Hammond, Berggren, Benke, Borchers, Collet, Heide-Jorgensen, Heimlich, Hiby, Leopold and Øien2002, Reference Hammond, MacLeod, Berggren, Borchers, Burt, Canadas, Desportes, Donovan, Gilles, Gillespie, Gordon, Hiby, Kuklik, Leaper, Lehnert, Leopold, Lovell, Oien, Paxton, Ridoux, Rogan, Samarra, Scheidat, Sequeira, Siebert, Skov, Swift, Tasker, Teilmann, Van Canneyt and Vazquez2013, Reference Hammond, Lacey, Gilles, Viquerat, Börjesson, Macleod, Ridoux, Santos, Scheidat, Teilmann, Vingada and Øien2017). However, these large-scale surveys were only conducted during the month of July, whereas in the southern part of the North Sea, several studies reported higher abundance, occurrence and densities of harbour porpoises in winter and spring (Sveegaard et al., Reference Sveegaard, Andreasen, Mouritsen, Jeppesen, Teilmann and Kinze2012; Geelhoed et al., Reference Geelhoed, Scheidat, van Bemmelen and Aarts2013; Evans et al., Reference Evans, Pierce, Veneruso, Weir, Gibas, Anderwald and Santos2015; Gilles et al., Reference Gilles, Viquerat, Becker, Forney, Geelhoed, Haelters, Nabe-Nielsen, Scheidat, Siebert, Sveegaard, van Beest, van Bemmele and Aarts2016; Peschko et al., Reference Peschko, Ronnenberg, Siebert and Gilles2016; Lambert et al., Reference Lambert, Pettex, Dorémus, Laran, Stéphan and Van Canneyt2017; Geelhoed & Scheidat, Reference Geelhoed and Scheidat2018).
From data collected using platforms of opportunity, this study describes at a fine-scale, the spatiotemporal distribution patterns, the encounter probability and relative abundance of the harbour porpoise in the Southern Bight of the North Sea. We also investigate the environmental parameters influencing the distribution and abundance of the species in this region. This is the first dedicated boat-based study focusing on the abundance and distribution of the harbour porpoise along this part of the English Channel, and it highlights the current importance of the area for this species. Indeed, this study demonstrates that the species is present on a year-round basis, and that a significant increase in group size, encounter probability and relative abundance has occurred across the area since 2012, at least until 2014. Mean group size in the Dover Strait has also increased since 2012 (1.57 animals in 2012 to 2.03 animals in 2014), which is consistent with the suggested continued increase in abundance of this species in the southern North Sea (Hammond et al., Reference Hammond, Berggren, Benke, Borchers, Collet, Heide-Jorgensen, Heimlich, Hiby, Leopold and Øien2002, Reference Hammond, MacLeod, Berggren, Borchers, Burt, Canadas, Desportes, Donovan, Gilles, Gillespie, Gordon, Hiby, Kuklik, Leaper, Lehnert, Leopold, Lovell, Oien, Paxton, Ridoux, Rogan, Samarra, Scheidat, Sequeira, Siebert, Skov, Swift, Tasker, Teilmann, Van Canneyt and Vazquez2013, Reference Hammond, Lacey, Gilles, Viquerat, Börjesson, Macleod, Ridoux, Santos, Scheidat, Teilmann, Vingada and Øien2017). Group size was on average slightly higher (mean = 1.83, SE = 0.03, range = 1–15) than in neighbouring countries such as Belgium (between 1 and 1.35 animals; see Haelters et al., Reference Haelters, Kerckhof, Jacques and Degraer2011), the Netherlands (mean = 1.21; see Geelhoed & Scheidat, Reference Geelhoed and Scheidat2018; mean = 1.3 animals; see IJsseldijk et al., Reference IJsseldijk, Camphuysen, Nauw and Aarts2015) and Germany (mean = 1.21, SD 0.52; Peschko et al., Reference Peschko, Ronnenberg, Siebert and Gilles2016). The most recent aerial surveys that were conducted in the English Channel also indicated a small seasonal variation in the mean group size between the summer and winter, with respectively 1.4 and 1.6 animals observed in groups (Laran et al., Reference Laran, Authier, Blanck, Dorémus, Falchetto, Monestiez, Pettex, Stephan, Van Canneyt and Ridoux2017).
Harbour porpoises were significantly more abundant during winter, especially in February and March, and the encounter probability also increased during this season. Lower abundance and encounter probability were observed during spring and summer, with the lowest abundance recorded in June. Similar patterns were also found off the coasts of Germany, the Netherlands, Belgium and France, where a seasonal peak of abundance and/or in the number of sightings extends from February to May (Camphuysen, Reference Camphuysen2004; Gilles et al., Reference Gilles, Adler, Kaschner, Scheidat and Siebert2011, Reference Gilles, Viquerat, Becker, Forney, Geelhoed, Haelters, Nabe-Nielsen, Scheidat, Siebert, Sveegaard, van Beest, van Bemmele and Aarts2016; Haelters et al., Reference Haelters, Kerckhof, Jacques and Degraer2011; Peschko et al., Reference Peschko, Ronnenberg, Siebert and Gilles2016; Lambert et al., Reference Lambert, Pettex, Dorémus, Laran, Stéphan and Van Canneyt2017; Laran et al., Reference Laran, Authier, Blanck, Dorémus, Falchetto, Monestiez, Pettex, Stephan, Van Canneyt and Ridoux2017; Virgili et al., Reference Virgili, Authier, Dars, Dorémus, Laran, Van Canneyt and Spitz2018). Our results also indicate that during the winter, the Dover Strait had one of the highest relative abundance values of harbour porpoises of the southern North Sea (max. 2.8 animals km−1 in February). Aerial surveys conducted in the southern part of the North Sea have revealed similar seasonal patterns in densities, with ~2 animals km−2 recorded during winter and spring in German and Dutch waters (2.45 animals km−2 in Germany and between 2 and 3.08 animals km−2 in the Netherlands; Gilles et al., Reference Gilles, Scheidat and Siebert2009; Scheidat et al., Reference Scheidat, Verdaat and Aarts2012; Geelhoed & Scheidat, Reference Geelhoed and Scheidat2018), and higher densities in April (1.03 animals km−2) along the Belgian coast (Haelters et al., Reference Haelters, Kerckhof, Jacques and Degraer2011). During the summer, recent aerial surveys show that harbour porpoise densities decrease significantly in the southern part of the North Sea (from 0.277 animals km−2 in German waters and 0.837 animals km−2 in Dutch waters) compared with winter, although they still have the highest densities in this region compared with the northern part (Hammond et al., Reference Hammond, Lacey, Gilles, Viquerat, Börjesson, Macleod, Ridoux, Santos, Scheidat, Teilmann, Vingada and Øien2017).
Our results also highlight a strong increase in the relative abundance and encounter probability from 2011 to 2014. The predicted spatiotemporal distribution of the relative abundance of harbour porpoises also indicates inter-annual variations. Over the past two decades, an increase in abundance has been recorded in the southern part of the North Sea, off Germany and the Netherlands (Siebert et al., Reference Siebert, Gilles, Lucke, Ludwig, Benke, Kock and Scheidat2006; Geelhoed et al., Reference Geelhoed, Scheidat, van Bemmelen and Aarts2013; Hammond et al., Reference Hammond, MacLeod, Berggren, Borchers, Burt, Canadas, Desportes, Donovan, Gilles, Gillespie, Gordon, Hiby, Kuklik, Leaper, Lehnert, Leopold, Lovell, Oien, Paxton, Ridoux, Rogan, Samarra, Scheidat, Sequeira, Siebert, Skov, Swift, Tasker, Teilmann, Van Canneyt and Vazquez2013; Peschko et al., Reference Peschko, Ronnenberg, Siebert and Gilles2016). Harbour porpoise distribution is mainly influenced by the distribution and availability of their prey (Reijnders, Reference Reijnders1992; Evans & Borges, Reference Evans and Borges1995; Borges & Evans, Reference Borges and Evans1997; Johnston et al., Reference Johnston, Westgate and Read2005; Sveegaard et al., Reference Sveegaard, Andreasen, Mouritsen, Jeppesen, Teilmann and Kinze2012; Gilles et al., Reference Gilles, Viquerat, Becker, Forney, Geelhoed, Haelters, Nabe-Nielsen, Scheidat, Siebert, Sveegaard, van Beest, van Bemmele and Aarts2016). In the southernmost part of the North Sea, diet analyses showed that the main prey of harbour porpoises are cod (Gadus morhua), gobies (Gobiidae), herring (Clupea harengus) and sandeel (Ammodytes marinus) (Sveegaard et al., Reference Sveegaard, Andreasen, Mouritsen, Jeppesen, Teilmann and Kinze2012; Leopold & Meesters, Reference Leopold, Meesters and Leopold2015). In the northern North Sea, changes in oceanographic conditions resulting from climate change (MacLeod et al., Reference MacLeod, Begona Santos, Reid, Scott and Pierce2007; Evans & Bjørge, Reference Evans and Bjørge2013; Hammond et al., Reference Hammond, MacLeod, Berggren, Borchers, Burt, Canadas, Desportes, Donovan, Gilles, Gillespie, Gordon, Hiby, Kuklik, Leaper, Lehnert, Leopold, Lovell, Oien, Paxton, Ridoux, Rogan, Samarra, Scheidat, Sequeira, Siebert, Skov, Swift, Tasker, Teilmann, Van Canneyt and Vazquez2013) coupled with fisheries (overfishing and seabed trawl disturbance) have reduced the total biomass of these important prey items for the harbour porpoise by over 50% since early 1970 (Hiddink et al., Reference Hiddink, Jennings, Kaiser, Queirós, Duplisea and Piet2006; ICES, 2019). In addition to the reduced food availability, the quality of lipid content of fish was also lower than normal (ICES, 2008; Frederiksen et al., Reference Frederiksen, Elston, Edwards, Mann and Wanless2011; Peschko et al., Reference Peschko, Ronnenberg, Siebert and Gilles2016; Booth, Reference Booth2019). Therefore, this reduced food availability and the lower energy content of prey in the northern North Sea may have resulted in the southward shift of harbour porpoises in the North Sea. Harbour porpoises have a limited capacity to store energy and may rapidly suffer from fasting (Kastelein & van Battum, Reference Kastelein and van Battum1990; Koopman et al., Reference Koopman, Iverson and Gaskin1996, Reference Koopman, Pabst, McLellan, Dillaman and Read2002; Lockyer, Reference Lockyer2007; MacLeod et al., Reference MacLeod, Begona Santos, Reid, Scott and Pierce2007; Wisniewska et al., Reference Wisniewska, Johnson, Teilmann, Rojano-Donate, Shearer, Sveegaard, Miller, Siebert and Teglberg Madsen2016; Kastelein et al., Reference Kastelein, Helder-Hoek, Jennings, van Kester and Hulsman2019). A recent diet assessment of dead stranded harbour porpoises collected along French and Belgian coasts between 2010 and 2013 indicates that in addition to the most abundant and widely distributed fish species present in the area, they were also preying significantly upon sardines, Sardina pilchardus (Mahfouz et al., Reference Mahfouz, Meziane, Henry, Abi-Ghanem, Spitz, Jauniaux, Bouveroux, Khalaf and Amara2017). The recent re-establishment of spawning populations of sardines in the southern North Sea (see Kanstinger & Peck, Reference Kanstinger and Peck2009), are likely providing opportunities to have new prey items for the harbour porpoise and thus may partially explain its return in the region.
Finally, our results reveal that current speed seems to be the predominant factor affecting the abundance of harbour porpoises, as stronger currents can promote primary productivity and prey abundance (Evans & Borges, Reference Evans and Borges1995; Johnston et al., Reference Johnston, Westgate and Read2005; Pierpoint, Reference Pierpoint2008; Embling et al., Reference Embling, Gillibrand, Gordon, Shrimpton, Stevick and Hammond2010; Gilles et al., Reference Gilles, Adler, Kaschner, Scheidat and Siebert2011; Diaz-Lòpez & Methion, Reference Diaz-Lòpez and Methion2018). In the northern part of the Netherlands, the number of harbour porpoises observed increased with current speed (IJsseldijk et al., Reference IJsseldijk, Camphuysen, Nauw and Aarts2015). Recent winter aerial surveys in the English Channel and along the French coasts also confirm that harbour porpoises have a strong preference for shallow waters and areas with strong tidal currents (Lambert et al., Reference Lambert, Pettex, Dorémus, Laran, Stéphan and Van Canneyt2017), which support our findings where greater abundance was recorded in waters of stronger currents during winter.
Overall, our study reveals a continued increase in the encounter probability and relative abundance of harbour porpoises in the southern North Sea from 2012 to 2014, especially during winter. Predictions suggest a steady increase in harbour porpoise abundance in offshore habitats, in particular during winter months. Lower abundances are also highlighted close to the shores of both countries, with a further offshore distribution along the French coast. This study therefore should help to better define the fine-scale patterns of the seasonal distribution, encounter rates, relative abundance and habitat preference in a region where porpoises are at high risk of disturbance and threats from anthropogenic activities, especially by-catch from fisheries, both acoustic and chemical pollution and habitat degradation. Therefore, given that the harbour porpoise is a protected species, exposed to relatively high levels of by-catch in this region, we suggest using these results in management plans, and for long-term monitoring of the species in this region.
Platforms-of-opportunity such as ferries have provided, at a low cost, year-round data on fine-scale distribution and relative abundance of the smallest cetacean species occurring in European waters. Such platforms of opportunity have also been useful in monitoring offshore marine megafauna (e.g. Marques, Reference Marques2001; Kiszka et al., Reference Kiszka, Macleod, Van Canneyt, Walker and Ridoux2007). They can be very helpful to initiate pilot studies and provide preliminary information in under-studied areas, or to conduct cheap long-term monitoring to investigate trends in abundance, distribution, seasonality, proportion of calves, and habitat use patterns of marine megafauna (see for example, Williams, Reference Williams2003; OSPAR, 2009; Leeney et al., Reference Leeney, Witt, Broderick, Buchanan, Jarvis, Richardson and Godley2012). In addition, as highlighted by the Convention for the Protection of the Marine Environment of the north-East Atlantic (the OSPAR Convention, OSPAR, 2009), such finer scale surveys conducted using dedicated survey platforms are still required to fill the spatial and temporal gaps in the distribution and abundance of harbour porpoises relative to larger-scale aerial surveys that have been conducted at intervals in the English Channel and southern North Sea (e.g. SCANS).
Supplementary material
The supplementary material for this article can be found at https://doi.org/10.1017/S0025315420000326
Acknowledgements
We are very grateful to DFDS Seaways, as well as all their captains, who invited us every week in the wheelhouse of their vessels. Thanks also to all the volunteers for their assistance in data collection. Finally, we are also grateful to Meetnet Vlaamse Banken for providing hydrographic data recorded in the area. This is contribution #184 of the Coastlines and Oceans Division in the Institute of Environment at Florida International University.
Financial support
This research was supported by the Direction Régional de l'Environement, de l'Aménagement et du Logement (DREAL – Nord-Pas-de-Calais, les Hauts-de-France) and Total Foundation.


