Introduction
Nephrops norvegicus (Linnaeus, 1758) is a benthic-dwelling, decapod crustacean that inhabits burrows in patches of soft, muddy sediment between ~4–800 m depth (Holthuis, Reference Holthuis1991; Johnson et al., Reference Johnson, Lordan and Power2013). The species’ distribution ranges from Iceland and northern Norway in the North Atlantic, to Morocco and the Mediterranean in the south (Maltagliati et al., Reference Maltagliati, Camilli, Biagi and Abbiati1998; Bell et al., Reference Bell, Redant, Tuck and Phillips2006; Johnson et al., Reference Johnson, Lordan and Power2013). Nephrops norvegicus is dioecious, with mating occurring following a brief courtship shortly after females moult (Powell & Eriksson, Reference Powell and Eriksson2013). Females produce 900–6000 eggs in a brood (Powell & Eriksson, Reference Powell and Eriksson2013), with dispersal occurring in the larval phase, which can last up to 50 days (Hill, Reference Hill1990; Dickey-Collas et al., Reference Dickey-Collas, Briggs, Armstrong and Milligan2000). Survival of the larvae depends on a combination of factors including suitable temperature, food availability and access to suitable substrate (Dickey-Collas et al., Reference Dickey-Collas, Briggs, Armstrong and Milligan2000; Aguzzi & Sardà, Reference Aguzzi and Sardà2008; Pochelon et al., Reference Pochelon, Calado, Dos Santos and Queiroga2009). Upon settling, juveniles occupy or create burrows to avoid predation (Powell & Eriksson, Reference Powell and Eriksson2013). Adult N. norvegicus do not migrate or leave their mud patch at any point (Aguzzi & Sardà, Reference Aguzzi and Sardà2008).
Commonly sold as Norway lobster, Dublin Bay prawn, scampi or langoustine, N. norvegicus is a commercially important fisheries species (Thorpe et al., Reference Thorpe, Sole-Cava and Watts2000), with the most recent global landing estimates at 54,000 tonnes in 2014 (FAO 2017; Thorpe et al., Reference Thorpe, Sole-Cava and Watts2000). Within the EU, 2017's N. norvegicus landings are estimated to be worth over €278 million (Marine Institute, 2017). For management purposes the species is currently divided into approximately 40 geographic groups, known as functional units (FUs) and geographical survey areas (GSAs), across its distribution (Relini et al., Reference Relini, Bertrand and Zamboni1999; Ungfors et al., Reference Ungfors, Bell, Johnson, Cowing, Dobson, Bublitz and Sandell2013).
Effective management relies on accurate and reliable information on how species are distributed over time and space. Current assessment of N. norvegicus is largely based on underwater video surveys (Johnson et al., Reference Johnson, Lordan and Power2013; Marine Institute, 2016). Although the species has a relatively long larval stage (50 days), the low mobility of adults may increase the vulnerability of stocks to local overfishing relative to other highly mobile commercial species. Commercial fishing has been suggested as the principal driver of population dynamics for the species (Thorpe et al., Reference Thorpe, Sole-Cava and Watts2000). Despite the substantial economic value of N. norvegicus fisheries, there is limited knowledge of the species’ genetic population structure and whether it aligns with existing functional, biological or management units (Stamatis et al., Reference Stamatis, Triantafyllidis, Moutou and Mamuris2006).
Population genetics has proven highly suited for identifying biological populations by quantifying the connectivity (gene flow/isolation) among them. Population genetics can also assess vital demographic parameters, such as effective population size, evolutionary history and recent demographic expansion (Beissinger & McCullough, Reference Beissinger and McCullough2002). Mitochondrial DNA (mtDNA) has several advantages in population genetic studies. For example, as a maternally inherited haploid marker there is a lack of genetic recombination which is ideal for studying deep-historical population dynamics (Held et al., Reference Held, Koenemann and Schubart2016). Zane et al. (Reference Zane, Ostellari, Maccatrozzo, Bargelloni, Cuzin-Roudy, Buchholz and Patarnello2000) used single strand conformation polymorphism analyses of mtDNA in populations of Northern krill, Meganyctiphanes norvegica (M. Sars, 1857) to reveal at least three distinct populations in the North-east Atlantic and an Atlantic–Mediterranean divide. Yuhara et al. (Reference Yuhara, Kawane and Furota2014) utilized mtDNA cytochrome c oxidase subunit I (COI) analyses to clarify the genetic diversity and connectivity among local coastal populations of the saltmarsh sesarmid crab, Clistocoeloma sinense (Shen, 1933) around the Japanese coastline.
With respect to N. norvegicus, allozyme analyses on 110 individuals from one Scottish and two Mediterranean localities (Aegean Sea and Adriatic Sea) failed to reveal genetic differentiation (Passamonti et al., Reference Passamonti, Mantovani, Scali and Froglia1997). Maltagliati et al. (Reference Maltagliati, Camilli, Biagi and Abbiati1998) performed allozyme analyses with 15 enzyme systems in N. norvegicus, examining one Atlantic and eight Mediterranean samples, with ~100 individuals from each site. While genetic variability was detected, there was no evident population structure. Stamatis et al. (Reference Stamatis, Triantafyllidis, Moutou and Mamuris2006) used 10 allozyme systems to investigate samples from the North Sea and the Aegean Sea, finding no significant genetic differentiation among 366 examined individuals. Streiff et al. (Reference Streiff, Guillemaud, Alberto, Magalhaes, Castro and Cancela2001) did not recover evidence for population structure among 40 individuals from two Portuguese locations for five microsatellite loci. Stamatis et al. (Reference Stamatis, Triantafyllidis, Moutou and Mamuris2004) performed a restriction fragment length polymorphism analysis on mitochondrial COI DNA segments in 370 individuals and reported significant but low levels of genetic differentiation. No structure between the Mediterranean Sea and the Atlantic was discovered. Recent population expansion after the Last Glacial Maximum (LGM) was proposed as an explanation. Similarly, no population genetic structure was found using 12 microsatellite loci on 549 individuals from a small geographic range around Iceland (Pampoulie et al., Reference Pampoulie, Skirnisdottir, Hauksdottir, Olafsson, Eiriksson, Chosson, Hreggvidsson, Gunnarsson and Hjorleifsdottir2011).
Previous studies have yet to recover population differentiation either across the geographic range of N. norvegicus, or at finer scales. The mtDNA D-loop has proven hypervariable in other crustacean species with high levels of polymorphism that can be used to discriminate amongst populations (McMillen-Jackson & Bert, Reference McMillen-Jackson and Bert2003, Reference McMillen-Jackson and Bert2004). The current study explores the efficacy of this region to determine the presence of population structure across a subsample of the species’ distribution.
Materials and methods
Sampling
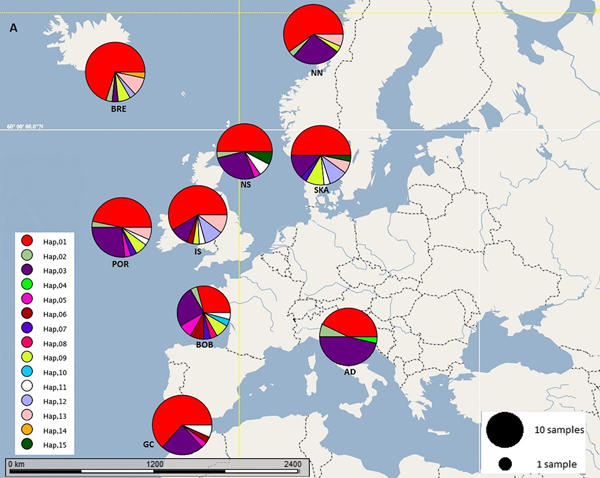
Samples were collected from commercial fishing or research vessels from across the geographic distribution of N. norvegicus including Iceland, northern Norway, Skagerrak, North Sea, Irish Sea, Porcupine Bank, Bay of Biscay, Gulf of Cadiz and Ancona in the Adriatic Sea (Figure 1). Sex and length were recorded, and first and second pereiopods were removed from each individual before being stored in 80% EtOH. Whole samples that were collected were stored at −20 °C before tail tissue was removed and stored in 80% EtOH. Both males and females (~2:1) with carapace lengths encompassing an equal number (N = 15) of individuals of two length groups (6–35 & 35–70 mm) were selected to minimize the risk of only including a single cohort that could cause family effects and skew the genetic data (Haynes et al., Reference Haynes, Browne, Fullbrook, Graham, Hancox, Johnson, Lauria and Power2016).

Fig. 1. Map of the geographic distribution and frequency of haplotype groups in nine sample sites of N. norvegicus. AD: Adriatic, BOB: Bay of Biscay, BRE: Breiðamerkurdjúp, GC: Gulf of Cadiz, IS: Irish Sea (west), NN: Northern Norway, NS: North Sea, POR: Porcupine, SKA: Skagerrak haplotypes.
DNA analysis
Total genomic DNA was extracted using a modified chloroform/isoamyl alcohol protocol (Petit et al., Reference Petit, Excoffier and Mayer1999). Primers (NN3DF 5′-ACA GCG TTA AGA YAC CAT AG-3′ and NnDR 5′-GCT CTC ATA AAC GGG GTA TGA-3′) were designed initially using Primer-3 as implemented in Geneious® 7 (https://www.geneious.com, Kearse et al., Reference Kearse, Moir, Wilson, Stones-Havas, Cheung, Sturrock, Buxton, Cooper, Markowitz, Duran, Thierer, Ashton, Meintjes and Drummond2012) and the D-loop N. norvegicus mitochondrial genome (GenBank accession: LN681403.1). The resulting amplicons were relatively larger (~880 bp) than had been designed for (~600 bp) and were sequenced to discover a ~280 bp fragment of the D-loop area missing from within the GenBank data (Appendix 1). Subsequently, new primers JG2 F 5′-CTA CAG ATT TCG TCT ATC AAC-3′ and NnD R 5′-GCT CTC ATA AAC GGG GTA TGA-3′ were designed on these returning sequences to incorporate the newly discovered ~280 bp for a ~680 bp amplicon. Primer sequences’ specificity was confirmed using BLAST (Basic Logical Alignment Search Tool; Zhang et al., Reference Zhang, Schwartz, Wagner and Miller2000). Optimal annealing temperature was determined using a gradient PCR.
PCR amplifications were performed in a Biometra T3000 thermocycler (Biolabo, SA) with lid temperature of 95 °C, using a thermal cycling profile of initial heating of 95 °C for 2 min, followed by 30 cycles of 95 °C for 30 s, 61.2 °C for 30 s, and 72 °C for 1 min, followed by a final extension step of 72 °C for 2 min. Completed reactions were held at 4 °C. PCR products were visualized on 1.5% agarose gels to verify amplifications, and purified using ExoSap-IT (Affymetrix Ltd, Santa Clara, CA) prior to Macrogen sequencing.
COI data
In total, 35 N. norvegicus COI sequences were downloaded from GenBank covering four different areas: the North Sea, Paris (unknown), Portugal and Turkey (Appendix 2).
Data and statistical analyses
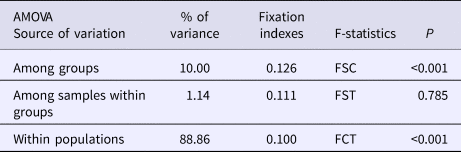
Forward and reverse sequences were aligned and edited in Geneious® v 7.0, using the K80 substitution model (Kimura, Reference Kimura1980), as determined in JMODELTEST v 2.1.4. (Guindon & Gascuel, Reference Guindon and Gascuel2003; Darriba et al., Reference Darriba, Taboada, Doallo and Posada2012). Spatial analysis of molecular variance, SAMOVA v 2.0 (Dupanloup et al., Reference Dupanloup, Schneider and Excoffier2002) was used to define groups of populations that are geographically homogenous and maximally differentiated from each other. Analysis of molecular variance (AMOVA; Excoffier et al., Reference Excoffier, Smouse and Quattro1992) was performed in ARLEQUIN v 3.5 (Excoffier & Lischer, Reference Excoffier and Lischer2010) to generate F-statistics, ΦST, θ, and (τ), the K80 substitution model and 10,100 replicates. Fu's F S tests whether mutations are selectively neutral. Theta (θ) is defined as 2 Nμ for haploid mitochondrial DNA, where N is the effective population size and μ is mutation rate per sequence per generation (Fu, Reference Fu1997). Tau (τ) can measure relative time since a population expansion using T = τ/2u, where u is per-nucleotide rate of mutation multiplied by the number of nucleotides in the sequence (Gaggiotti & Excoffier, Reference Gaggiotti and Excoffier2000). Harpending's raggedness index (Harpending, Reference Harpending1994) and mismatch distributions (SSD) were both used to test whether the data deviated significantly from a population expansion model. DNASP v 6.10.01 (Rozas et al., Reference Rozas, Ferrer-Mata, Sánchez-DelBarrio, Guirao-Rico, Librado, Ramos-Onsins and Sánchez-Gracia2017) was used to calculate haplotype (h) and nucleotide diversity (π) and to estimate the nearest neighbour statistic S nn (Hudson, Reference Hudson2000) with 10,000 permutations. This statistic uses a symmetric island model on haplotype data to measure sequential ‘neighbours’ from the same geographic space. In all cases involving multiple comparisons significance levels were adjusted for multiple tests using the sequential Bonferroni correction technique (Rice, Reference Rice1989). A map of N. norvegicus haplotypes was constructed using POPART v 1.7 (Leigh & Bryant, Reference Leigh and Bryant2015). Unweighted Pair Group Method with Arithmetic Mean (UPGMA) dendrograms of ΦST pairwise distance values for both D-loop and GenBank retrieved COI sequences (Appendix 2) were created in PAST v 3.20 with 1000 bootstrap replicates (Hammer et al., Reference Hammer, Harper and Ryan2001). All software was used with default setting unless specified otherwise.
Results
DNA analysis
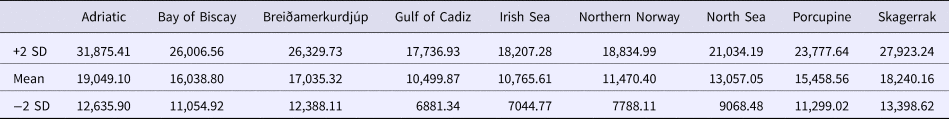
Sequence alignments for the D-loop region were trimmed for maximum length and quality using individual sequence chromatograms. Only regions of the D-loop for which both forward and reverse strands yielded unambiguous sequences were included for a fragment of 375 bp. Of the 270 sequenced samples, 13 were excluded due to poor quality sequence reads. A total of 15 haplotypes were resolved (GenBank accession nos. MG972769–MG972783) with nucleotide diversity (π) ranging from 0.008 in the Gulf of Cadiz to 0.019 in the Bay of Biscay, and haplotype diversity ranging from 0.508 in Breiðamerkurdjúp to 0.859 in the Bay of Biscay (Table 1). Frequency and location of the haplotypes were displayed on a haplotype map (Figure 1).
Table 1. Mitochondrial sequence variability in the D-loop for N. norvegicus from the nine sample sites; number of individuals (N), number of haplotypes (Nh), haplotype diversity (h), nucleotide diversity (π), tau (τ), theta for times 0 and 1 (θ0 and θ1), Fu's FS, Harpending's Raggedness index (Hri), and sum of squared differences from mismatch analyses (SSD)
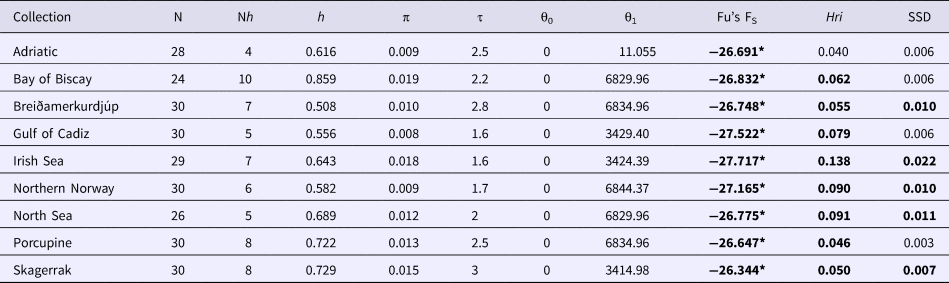
Values in bold are significant at P < 0.05, *P < 0.001.
Data and statistical analyses
Population differentiation
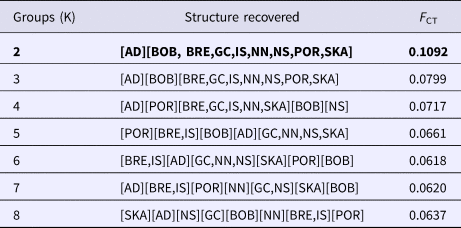
The SAMOVA analysis indicated that the best-supported F CT value (F CT = 0.109) was achieved when the samples were clustered into two groups. The first group contained only individuals derived from the east Mediterranean (Adriatic) while the second group comprised of individuals from all other sampled areas (Table 2).
Table 2. SAMOVA results table for N. norvegicus. K corresponds to the number of populations. Optimal F CT and groupings (K = 2) are highlighted in bold
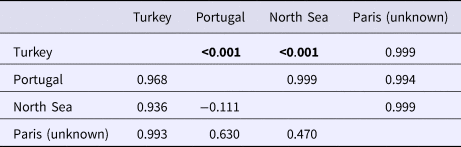
An AMOVA analysis, using the SAMOVA structure and the K80 distance model (Kimura, Reference Kimura1980) revealed significant heterogeneity among the nine samples (ΦST = 0.107, P < 0.001). Within-sample variation accounted for 88.86% of the variance (F CT = 0.100, P < 0.001; Table 3). Pairwise ΦST values revealed population structure between the eastern Mediterranean (Adriatic) sample and each of the eight other samples from the North Atlantic (Table 4). Significant pairwise ΦST values for the D-loop sequences ranged from 0.057 (Adriatic/Porcupine) to 0.152 (Adriatic/Breiðamerkurdjúp; Table 4). The nearest-neighbour statistic (S nn) indicated a significant association between sequence similarity and geographic location (S nn = 0.1250, P = 0.032). Significant pairwise ΦST values for COI data ranged from 0.968 (Portugal/Turkey) to 0.936 (North Sea/Turkey; Table 5). A UPGMA dendrogram was constructed using sample pairwise ΦST values to visualize genetic distances for both D-loop and COI data (Figures 2 and 3).
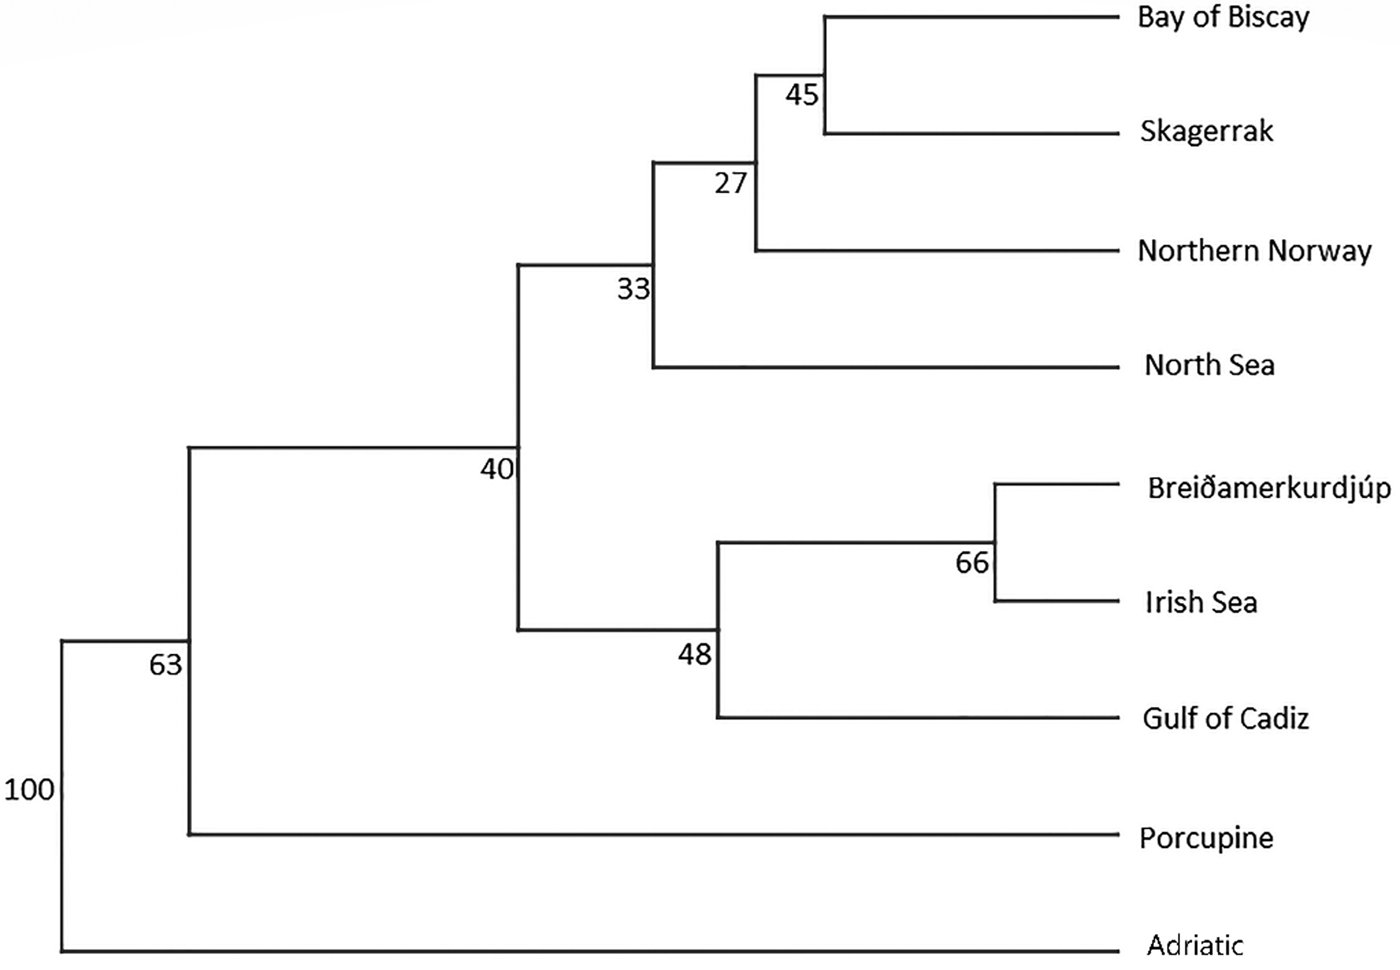
Fig. 2. D-Loop UPGMA dendrogram based on ΦST pairwise distance values calculated from frequency data among N. norvegicus individuals sampled.
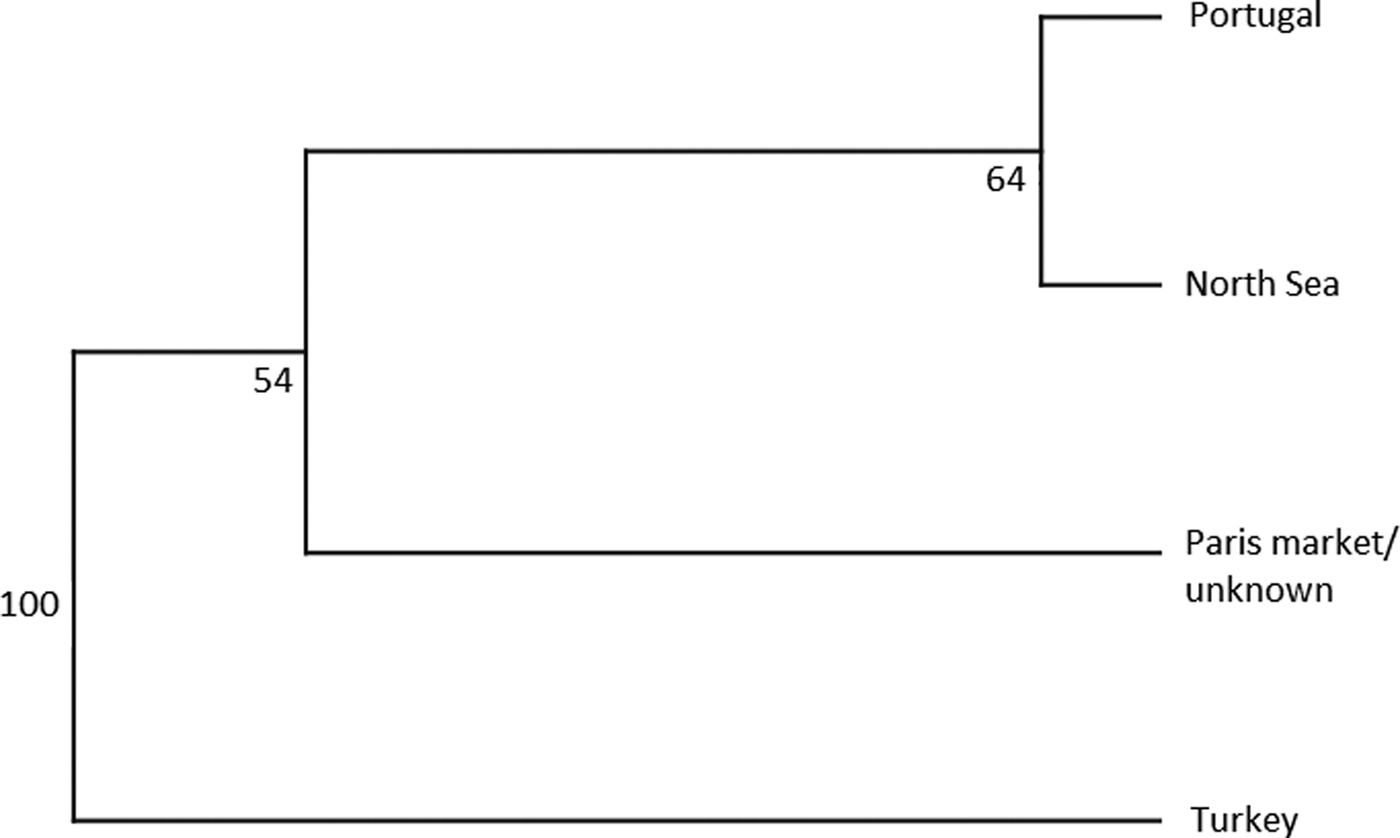
Fig. 3. COI UPGMA dendrogram based on ΦST pairwise distance values calculated from frequency data of N. norvegicus individuals taken from GenBank.
Table 3. AMOVA table of temporal and spatial genetic variation of N. norvegicus from sites sampled

Table 4. Pairwise ΦST estimates (below diagonal) for D-loop mtDNA data among N. norvegicus samples. P-values (upper diagonal) in bold were significant after Sequential Bonferroni correction (initial α = 0.05/8 = 0.00625)
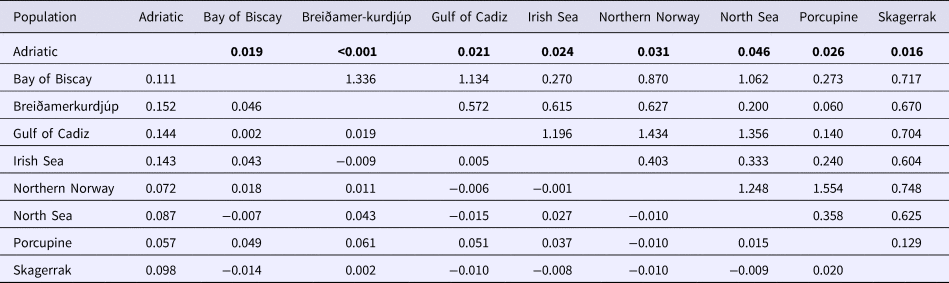
Table 5. Pairwise ΦST estimates (below diagonal) for COI mtDNA data among GenBank N. norvegicus samples. P-values (upper diagonal) in bold were significant after Sequential Bonferroni correction (initial α = 0.05/8 = 0.016)

Population expansion
Demographic analyses in ARLEQUIN showed pronounced differences between θ0 and θ1 suggesting rapid population expansion in all samples, with less pronounced differences in the Adriatic sample (Table 1). All Fu's F S values were negative and deviated significantly from zero. Mismatch distributions differed significantly from the distributions expected under population expansion in four of the nine sample sites (Table 1). Harpending's raggedness index ranged from 0.040 to 0.138 from the Adriatic to the Irish Sea respectively and was significant for all except the Adriatic sample (Table 1).
Using the population expansion formula T = τ/2u with u = μk, where μ = per nucleotide substitution rate and k = sequence length, population expansion times were estimated between 10,500 to 19,000 ybp. Due to the uncertainty around the point estimate of τ in the ARLEQUIN analyses, 1000 bootstrap replicates were performed drawing random values for tau from between 2.5 and 97.5 percentiles returned by ARLEQUIN. Population expansion times were estimated using μ = 19%/My from the penaeid prawn and pink shrimp D-loop mutation rate (McMillen-Jackson & Bert, Reference McMillen-Jackson and Bert2003, Reference McMillen-Jackson and Bert2004). From the 1000 bootstrap iterations the mean estimate and upper and lower two standard deviation confidence intervals were calculated (Table 6).
Table 6. Estimated expansion times for N. norvegicus with upper and lower two standard deviation confidence intervals
Discussion
This study recovered a previously undocumented 280 bp segment of the N. norvegicus mitochondrial genome (GenBank accession no. MG917720). In addition, genetic structure between the North Atlantic and eastern Mediterranean N. norvegicus samples was detected in both the mtDNA D-loop and COI region.
Eleven haplotypes are shared among multiple N. norvegicus samples, with four haplotypes unique to a single sample: two unique haplotypes are found in the Bay of Biscay, and one each are found in Breiðamerkurdjúp and the Adriatic. SAMOVA revealed distinct population genetic differences between the Atlantic samples and the eastern Mediterranean sample, and the nearest neighbour statistic (S nn) suggests a significant association between D-loop sequence similarity and geographic location. Average ΦST estimates are at least twice as large between the Adriatic and each Atlantic sample than ΦST estimates among all Atlantic samples. This suggests that the eastern Mediterranean sample is genetically differentiated from the Atlantic samples. A UPGMA cluster analysis on the D-loop ΦST distance matrix demonstrated that the largest genetic differentiation exists between the east Mediterranean and all other samples with 100 bootstrap support. The same result was also achieved using GenBank COI data where samples from Turkey in the eastern Mediterranean were genetically differentiated from Atlantic samples. While an Atlantic–Mediterranean divide has been recorded for many highly mobile species (Bargelloni et al., Reference Bargelloni, Alarcon, Alvarez, Penzo, Magoulas, Reis and Patarnello2003; Carlsson et al., Reference Carlsson, McDowell, Díaz-Jaimes, Carlsson, Boles, Gold and Graves2004; Farrell et al., Reference Farrell, Carlsson and Carlsson2016), it has not been previously reported for N. norvegicus. This could be due to small sample sizes leading to lack of statistical power. Alternatively, certain regions of mtDNA are more variable than others, with D-loop being a hypervariable region never-before explored for this species. The relatively recent expansion time of 10,500 to 19,000 ybp reported in this study could be another reason why differentiation has not been discovered previously in less variable mtDNA regions.
An Atlantic–Mediterranean divide has also been reported for European lobster Homarus gammarus (Linnaeus, 1758), which also inhabits a similar distribution range to N. norvegicus (Triantafyllidis et al., Reference Triantafyllidis, Apostolidis, Katsares, Kelly, Mercer, Hughes, Jørstad, Tsolou, Hynes and Triantaphyllidis2005). Along with this divide, significant substructuring was also found within the Mediterranean. Zane et al. (Reference Zane, Ostellari, Maccatrozzo, Bargelloni, Cuzin-Roudy, Buchholz and Patarnello2000) also reported this Atlantic–Mediterranean divide in decapod Northern krill and suggested the Oran-Almeria oceanic front as a barrier to gene flow. A sample of krill east of the straits of Gibraltar was found to be an intermediate genetically between the Atlantic and Ligurian Sea samples. Ladoukakis et al. (Reference Ladoukakis, Saavedra, Magoulas and Zouros2002) also discovered an Atlantic–Mediterranean differentiation in blue mussel, Mytilus galloprovincialis (Lamarck, 1819) and a further differentiation between Mediterranean and Black Sea populations. Marine invertebrate chaetognath Sagitta setosa (J. Müller, 1847) is also reported as having an Atlantic–Mediterranean divide, with a sharp division within the Mediterranean basin between the Adriatic sea and other areas (Peijnenburg et al., Reference Peijnenburg, Fauvelot, Breeuwer and Menken2006). Sanna et al. (Reference Sanna, Cossu, Dedola, Scarpa, Maltagliati, Castelli, Franzoi, Lai, Cristo, Curini-Galletti, Francalacci and Casu2013) also reported a genetic divergence across the Mediterranean in bivalve, Pinna nobilis (Linnaeus, 1758). Results revealed genetic divergence among three distinguishable areas: the western Mediterranean/Ionian Sea, the Adriatic Sea, and Aegean Sea/Tunisian coastal areas. Within the Mediterranean the Adriatic, as a semi-closed sea, appears to be genetically divergent from other areas (Patarnello et al., Reference Patarnello, Volckaert and Castilho2007). This is further supported by studies on vertebrates (Stefanni & Thorley, Reference Stefanni and Thorley2003; Rossi et al., Reference Rossi, Perrone and Sola2006; Gaspari et al., Reference Gaspari, Azzellino, Airoldi and Hoelzel2007; Matić-Skoko et al., Reference Matić-Skoko, Šegvić-Bubić, Mandić, Izquierdo-Gomez, Arneri, Carbonara, Grati, Ikica, Kolitari, Milone, Sartor, Scarcella, Tokaç and Tzanatos2018).
Negative Fu's F S values suggest recent demographic expansion (Fu, Reference Fu1997), and the large difference between θ0 and θ1 for all Atlantic sites suggests rapid population expansion. In contrast, the difference in theta values for the Mediterranean sample are two orders of magnitude smaller. When considered with the non-significant Raggedness index, this suggests a less-pronounced population expansion in the Mediterranean.
Estimates of time since expansion ranged from 10,500 to 19,000 ybp. Large confidence intervals around all of the point estimates for the expansion time overlap, indicating that expansion likely occurred within the same time frame for all sampled locations. These time estimates are consistent with those for European lobster, which is believed to have established around 15,000 ybp (Triantafyllidis et al., Reference Triantafyllidis, Apostolidis, Katsares, Kelly, Mercer, Hughes, Jørstad, Tsolou, Hynes and Triantaphyllidis2005). These time estimates are also in agreement with those for the LGM in Europe (16,000–31,000 ybp; Ashton et al., Reference Ashton, Lewis and Stringer2010), and likely represent population expansion into newly available habitat as the ice retreated.
Observed haplotype diversity was highest in the Bay of Biscay, suggesting this region represents a potential glacial refugium for the Atlantic distribution of the species. The area north of the Bay of Biscay has previously been hypothesized as a refugium for other marine species such as the common mussel Mytilus edulis (Linnaeus, 1758) (Śmietanka et al., Reference Śmietanka, Burzyński, Hummel and Wenne2014). These results also support species-distribution models for several other marine invertebrates, including the common starfish Asterias rubens (Johnston, 1836), amphipod crustacean Gammarus duebeni (Liljeborg, 1852), flat periwinkle Littorina obtusata (Linnaeus, 1758), dogwhelk Nucella lapillus (Linnaeus, 1758) and barnacle Semibalanus balanoid (Linnaeus, 1767) around the LGM (Waltari & Hickerson, Reference Waltari and Hickerson2013).
This study is the first to reveal a significant genetic differentiation between Atlantic and east Mediterranean samples of N. norvegicus, which supports a divide found in other marine species. Further divisions within the Mediterranean basin may be found, and future studies should include samples from these areas to examine this. These results support a post-glacial expansion, with Atlantic N. norvegicus continuing to expand rapidly. In terms of commercial fisheries management, these results do not support current management practices, as no significant genetic differentiation was found among Atlantic samples that cross several functional units. Utilizing genetic markers (e.g. microsatellites or SNPs) in future studies might provide fisheries management with more information on Atlantic N. norvegicus. These results may be important for management within the eastern Mediterranean, as populations experiencing isolation can be more vulnerable to commercial over-exploitation and recovery may be more difficult in the event of population collapse.
Acknowledgements
We would like to thank the scientists and researchers from the Irish Marine Institute, Ifremer, Marine Research Institute Iceland, Spanish Institute of Oceanography, ISMAR Institute of Marine Sciences, Havforskningsinstituttet Norwegian Institute of Marine Research, Marine Scotland and AFBI for the collection and donation of samples involved in this study. We would also like to thank E. Farrell for his assistance and comments on the manuscript.
Financial support
J.G. acknowledges funding from the Irish Research Council (IRC) (GOIPG/2015/2977). This project has received funding from the European Union's Horizon 2020 research and innovation programme under Grant agreement No. 678760 (ATLAS). This output reflects only the authors' view and the European Union cannot be held responsible for any use that may be made of the information contained therein.
Appendix 1
Nephrops norvegicus D-loop sequence (GenBank accession no. MG917720) with ~280 bp fragment (shown in bold) missing from within the GenBank data.
ATATACACAGATCAGTAAAAATATATTTTTAAGGCTAATCTAAAAAGTAAACTTATATAATTTCATTGAAATTCATTACARTCTGAAAGTCAATGATTTAATTTTATAAATCGACTAAATAAGATCTATAAATAAAATCTTACCCCTTCAAAAGGTCACTTTCTCCTGAGGGGAGCTCCCTTTTCCCAACGGGGTAAGATTTCTATTGGGAGAGCAGGATTATAATTATAGAGAGTTGGGTATAAGGCTTCATTGTTTACACATATATACTATTAAATTAATTATATACATTTATATGTATATATATATATATATATATACTATTTAAATAATATTTTCTTAACTTTWTATTTTGTTAACATWTAAATTATTAATAATGTTTTATAAATTTTATATATTAAAATAAAATACAGTAAAAAAGGTTTTTAGATAAATTTCTACGAATATTATACTATTATACACAATGGAATTCCACCAATTCTTTAAAGATCAAAACTTTTCGTGCCGTTTACACTAGTATACAAAAGAGAAGCTAATTCTAAGCTAATGG
Appendix 2