INTRODUCTION
Mangroves are defined as forests consisting of trees, palms, shrubs, vines and ferns that occupy the inter-tidal region between sea and land throughout (sub)-tropical regions (Polidoro et al., Reference Polidoro, Carpenter, Collins, Duke, Ellison, Ellison, Farnsworth, Fernando, Kathiresan, Koedam, Livingstone, Miyagi, Moore, Ngoc Nam, Ong, Primavera, Salmo, Sanciangco, Sukardjo, Wang and Hong Yong2010; Giri et al., Reference Giri, Ochieng, Tieszen, Zhu, Singh, Loveland, Masek and Duke2011). Mangrove trees are the major, highly specialized components of these ecosystems and attract a rich associated fauna and flora (Tomlinson, Reference Tomlinson1986). Like many other forests in the world, the coverage of mangroves is decreasing: 20–35% of mangrove forest area has been lost worldwide since 1980 (Valiela et al., Reference Valiela, Bowen and York2001). This decrease is largely due to deforestation and degradation by human activities (e.g. urban development, aquaculture or salt extraction) (Ewel et al., Reference Ewel, Twilley and Ong1998; Abuodha & Kairo, Reference Abuodha and Kairo2001; Rönnbäck et al., Reference Rönnbäck, Crona and Ingwall2007). Given the high anthropogenic pressure on mangrove ecosystems, understanding their roles is of crucial importance for future management.
Mangroves are part of the ‘tropical coastal seascape’ comprising coral reefs, seagrass beds and mud/sand flats (Moberg & Rönnbäck, Reference Moberg and Rönnbäck2003). The connectivity between mangrove forests and the adjacent ecosystems for the ichthyofauna has already been elucidated by several studies and evidence from the overlaps in carbon and nitrogen signatures of fish collected in these different environments (Nagelkerken et al., Reference Nagelkerken, Grol and Mumby2012; Igulu et al., Reference Igulu, Nagelkerken, van der Velde and Mgaya2013; Kimirei et al., Reference Kimirei, Nagelkerken, Mgaya and Huijbers2013). These isotopic signatures suggest that juvenile and/or adult fish probably choose more than one habitat to feed, find shelter or both (Lugendo et al., Reference Lugendo, Nagelkerken, van der Velde and Mgaya2006, Reference Lugendo, Nagelkerken, Kruitwagen, van der velde and Mgaya2007). Their movements may be triggered by several factors: tides, food availability, variation in salinity and/or ontogeny (Cocheret de la Morinière et al., Reference Cocheret de la Morinière, Pollux, Nagelkerken, Hemminga, Huiskes and van der Velde2003; Lugendo et al., Reference Lugendo, Pronker, Cornelissen, de Groene, Nagelkerken, Dorenbosch, van der Velde and Mgaya2005, Reference Lugendo, Nagelkerken, van der Velde and Mgaya2006; Nakamura et al., Reference Nakamura, Horinouchi, Shibuno and Tanak2008; Kimirei et al., Reference Kimirei, Nagelkerken, Mgaya and Huijbers2013). Mangroves may, therefore, be designated as potential nurseries for pelagic and demersal coral reef fish and crustaceans (Laegdsgaard & Johnson, Reference Laegdsgaard and Johnson2001; Nagelkerken et al., Reference Nagelkerken, Roberts, van der Velde, Dorenbosch, van Riel, Cocheret de la Morinière and Nienhuis2002; Nagelkerken, Reference Nagelkerken and Nagelkerken2009). A ‘nursery’ is defined as a habitat for immature fish where density, growth, survival of juveniles and movement to adult habitats are enhanced compared to adjacent habitats (Beck et al., Reference Beck, Heck, Able, Childers, Eggleston, Gillanders, Halpern, Hays, Hoshino, Minello, Orth, Sheridan and Weinstein2001; Dahlgren et al., Reference Dahlgren, Kellison, Adams, Gillanders, Kendall, Layman, Ley, Nagelkerken and Serafy2006). According to that definition, three hypotheses emerge to explain the attractiveness of the mangrove environment (Sheridan & Hays, Reference Sheridan and Hays2003):
1. A mangrove environment supports greater food availability allowing a faster growth or greater population survival rates (Lugendo et al., Reference Lugendo, Nagelkerken, Kruitwagen, van der velde and Mgaya2007; Nagelkerken, Reference Nagelkerken and Nagelkerken2009).
2. The turbid waters in mangroves lower the effectiveness of predators (Primavera, Reference Primavera1997).
3. The heterogeneity of mangrove sub-habitats (e.g. root complex) leads to a decreased rate of predation (Nagelkerken et al., Reference Nagelkerken, Blaber, Bouillon, Green, Haywood, Kirton, Meynecke, Pawlik, Penrose, Sasekumar and Somerfield2008; Nagelkerken, Reference Nagelkerken and Nagelkerken2009).
All these hypotheses have not really been tested, but evidence suggests that the presence of roots appears to be one of the most important criteria in attracting fish larvae (Nagelkerken et al., Reference Nagelkerken, De Schryver, Verweij, Dahdouh-Guebas, van der Velde and Koedam2010). Concerning food availability, the potential proliferation of both primary producers and secondary consumers on the substratum may be essential in the diet of fish. In fact, the muddy or sandy sediments are colonized by epibenthic and infaunal invertebrates which represent suitable prey (Lugendo et al., Reference Lugendo, Nagelkerken, Kruitwagen, van der velde and Mgaya2007; Nagelkerken, Reference Nagelkerken and Nagelkerken2009). This concept of nursery function has been illustrated by Laegdsgaard (Reference Laegdsgaard1996) in Australia and experimentally described by Kimirei et al. (Reference Kimirei, Nagelkerken, Mgaya and Huijbers2013) in Tanzania, but still needs to be tested in mangrove ecosystems of the Kenyan coast. Indeed, most Kenyan ecological studies have been focused on identifying the fish composition and diversity of mangrove forests, fish diets and trophic interactions. All of these researches partially tackled one or two aspects of the nursery concept, either the feeding function and/or the role of shelter. In addition, Kenyan studies have mainly been conducted in swamp forests located in the south (e.g. Gazi Bay, Tudor Creek and Mtwapa Creek) (Kimani et al., Reference Kimani, Mwatha, Wakwabi, Ntiba and Okoth1996; De Troch et al., Reference De Troch, Mees, Papadopoulos and Wakwabi1996, Reference De Troch, Mees and Wakwabi1998; Wakwabi, Reference Wakwabi1999; Wakwabi & Mees, Reference Wakwabi and Mees1999; Huxham et al., Reference Huxham, Kimani and Augley2004; Mavuti et al., Reference Mavuti, Nuynja and Wakwabi2004; Nyunja et al., Reference Nyunja, Ntiba, Onyari, Mavuti, Sotaert and Bouillon2009), and only one major study has been performed in the mangroves of Ungwana Bay on the north coast (Mirera et al., Reference Mirera, Kairo, Kimani and Waweru2010).
The present study aims at identifying the fish assemblage of Mida Creek, and the functions provided by mangroves to the ichthyofauna. Three main objectives were identified:
(1) To describe the fish assemblage.
(2) To determine the population structure of the ichthyofauna.
(3) To unravel the trophic interactions within the mangrove system using stable isotopes and stomach content analysis.
MATERIALS AND METHODS
Description of the study area
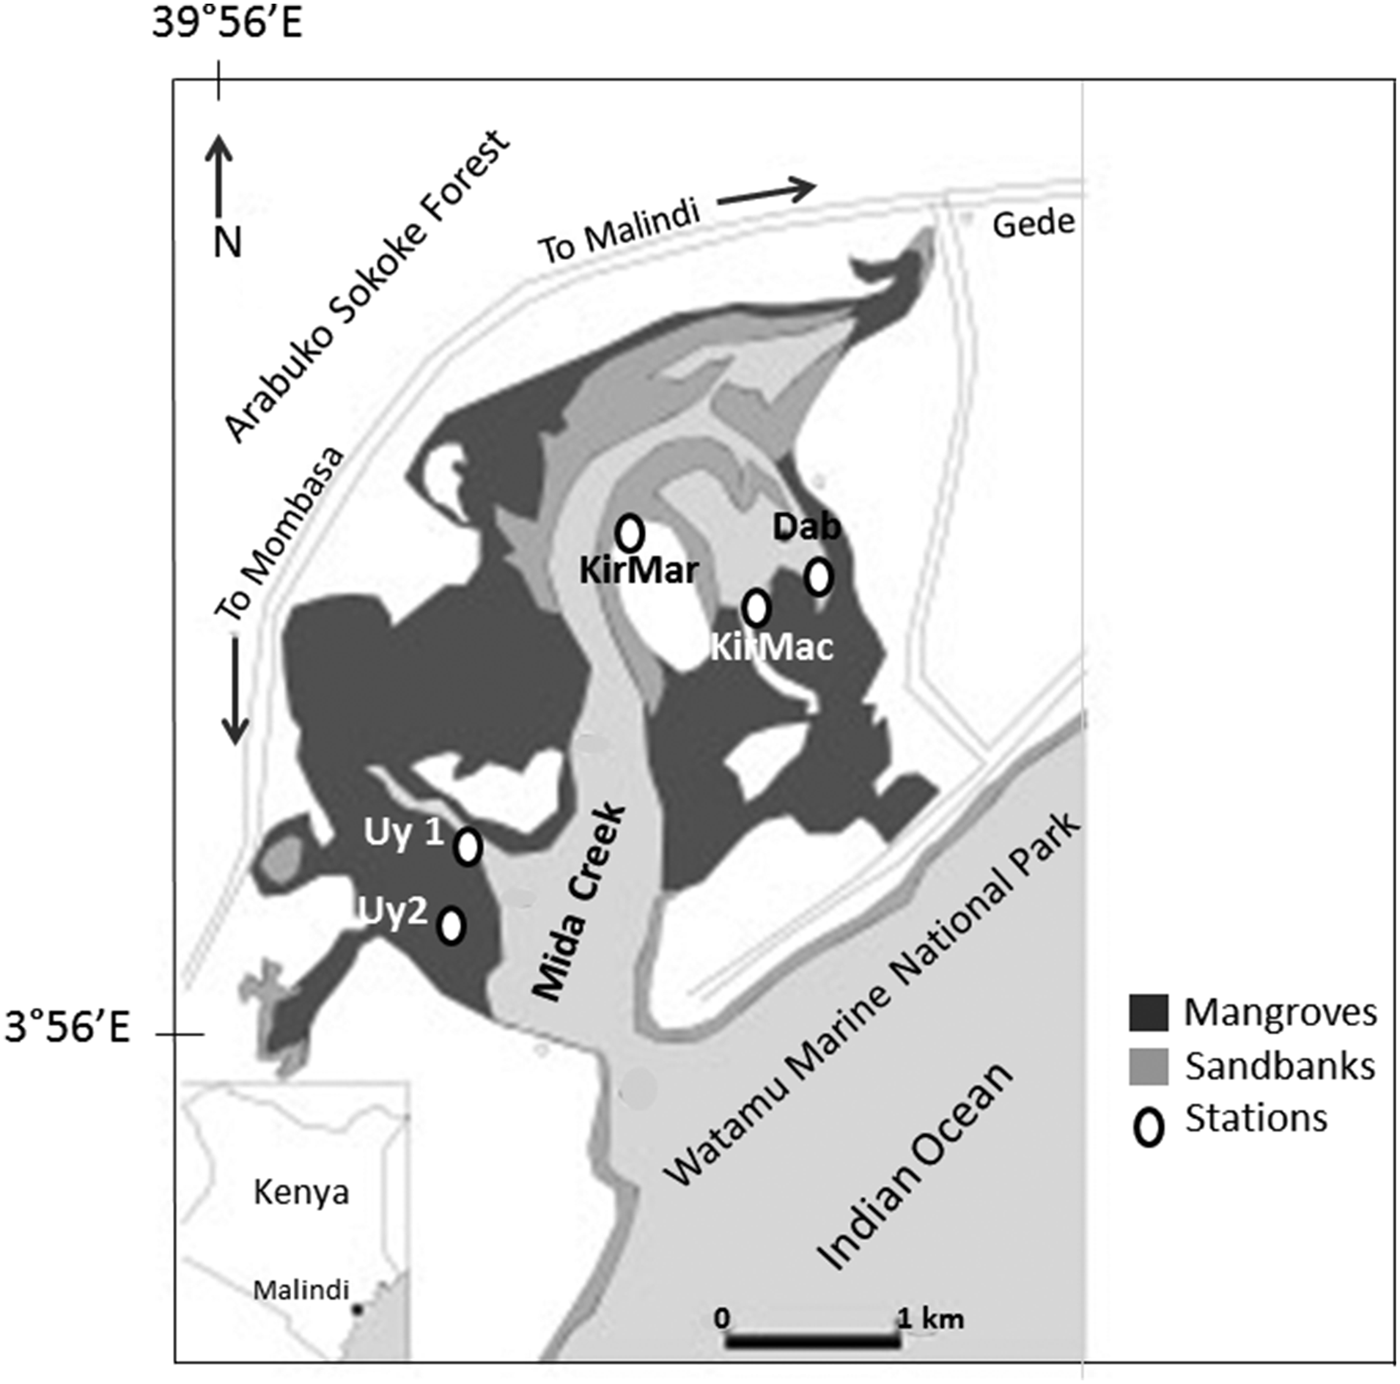
Mida Creek (3°22′S 39°58′E) is located 88 km north of Mombasa and approximately 25 km south of Malindi (Kairo & Bosire, Reference Kairo and Bosire2009) (Figure 1). The area is covered by 32 km2 of mangroves which border several villages such as Majaoni, Uyombo and Dabaso. Two dominant tree species in the whole area are Rhizophora mucronata and Ceriops tagal (Kairo et al., Reference Kairo, Dahdouh-Guebas, Gwada, Ochieng and Koedam2002; Kathiresan & Rajendran, Reference Kathiresan and Rajendran2005). The Creek consists of a channel 11 km long which is narrower at the mouth and further inland (width 500 m), while it is wider in the middle part (1500–2000 m). The depth varies between 4 m and 7 m maximum (Osore et al., Reference Osore, Mwaluma, Fiers and Daro2004). The climate is dominated by the monsoon, and the rainfall delivers annually a quantity of 600–1000 mm of freshwater (GOK, 1989; Mwaluma et al., Reference Mwaluma, Osore, Kamau and Wawiye2003). In May, there is the highest rate of precipitation of about 760 mm, with a typical rainy season extending from May to September. The tidal range is about 3.2 m at the mouth of the Creek and 2.0 m in the mid-section (Mwaluma et al., Reference Mwaluma, Osore, Kamau and Wawiye2003). Lower temperatures are recorded in July–October, with an average of 24°C, and the highest in November–March, with an average of 32°C (Osore et al., Reference Osore, Mwaluma, Fiers and Daro2004).

Fig. 1. Map of Mida Creek, adapted from Osore et al. (Reference Osore, Mwaluma, Fiers and Daro2004), with all five stations indicated: Uy1 (Uyombo 1); Uy2 (Uyombo 2); KirMar (Kirepwe Mark); KirMac (Kirepwe Macho); and Dab (Dabaso).
Mida Creek is part of Watamu Marine National Reserve. This area, which comprises a mangrove forest, sandflats, rock platforms, seagrass beds and coral gardens, received the status of a UNESCO Biosphere Reserve in 1979 (Kennedy, Reference Kennedy1988; Dahdouh-Guebas et al., Reference Dahdouh-Guebas, Mathenge, Kairo and Koedam2000). Biosphere reserves are considered as sites of excellence where optimal techniques to manage nature and human activities are tested and demonstrated (http://www.unesco.org/new/en/natural-sciences/environment/ecological-sciences/biosphere-reserves/). Therefore, limited human activities are allowed, but their impacts on the flora and fauna in Mida Creek needs to be ascertained. A main issue that requires further attention is the knock-on effect within the ecosystem of overfishing and exploitation of the marine environment, as stated in Jackson (Reference Jackson2010). In the past, local human populations have frequently exploited mangroves (e.g. harvesting wood) (Jackson, Reference Jackson2010). Given the indigenous rights and property ownership, conflicting issues with authorities have emerged (Taylor et al., Reference Taylor, Ravilious and Green2003). However, local initiatives to conserve and implement sustainable management of the natural resources have been successfully launched by the Mida Creek Conservation Community Group.
Across the mangroves, five stations were selected at Mida Creek (Figure 1). These stations represented different environmental conditions, and were considered to be representative for some of the variability in the area. At the entrance of the main channel of Mida Creek (near Sudi Island), station Uyombo 1 was chosen because of its situation deep in the mangrove forest where permanent pools are formed. Uyombo 2 station was situated at the border of swamp forests, closer to the village and potentially more disturbed by human activities. Around Kirepwe Island, sampling sites within the mangrove forests offered a connection with other valuable ecosystems. Station Kirepwe Mark was situated in front of sand banks and seagrass beds, while station Kirepwe Macho was located on a large muddy area. The last station selected was Dabaso at the end of the mangrove Creek within the wider village infrastructure and so potentially more disturbed by anthropogenic activities.
Sampling
Sample collections were carried out in July 2011 at the five stations in Mida Creek (Uyombo 1, Uyombo 2, Kirepwe Mark, Kirepwe Macho and Dabaso). This campaign was conducted during a spring tide, when a tidal range of 3.0–3.6 m was prevailing, for a period of 5–6 consecutive days. All types of passive fishing gears were set during low tide (in the morning) and retrieved after 24 h (after dawn, before the incoming spring tide), except for Kirepwe Mark. At that station fish were caught using a beach seine (mesh size 2.54 cm) because all other nets (removed after 24 h) were empty. The passive fishing gears consisted of three large and four small fyke nets, for which mesh sizes were, respectively, 15 mm and 5 mm with an outer cone of 30 mm and an inner cone of 15 mm. The nets were always placed at the entrance of the main water channel at each station, in front of the mangrove border, and also in smaller channels present inside the mangrove forest. Four gill nets (mesh sizes: 2.54 cm, 3.81 cm, 5.08 cm and 6.35 cm) were additionally placed to catch more fish in the permanent pools. Fish were, therefore, caught after two tidal cycles (24 h) per station. In the field, they were placed on ice and preserved in a coolbox. Fish specimens were measured (standard length (SL) = the distance from the tip of the mouth to the basis of the caudal fin) and their stomachs were removed and preserved in a formaldehyde solution (8%) for dissection. Tissue samples of lateral muscles of two or three specimens per species were collected and fixed into an ethanol solution (99%) for stable isotope analysis. In the laboratory, all specimens were identified to species level according to Richmond (Reference Richmond2002) and FishBase (Froese & Pauly, Reference Froese and Pauly2011). Various primary producers (e.g. mangrove leaves, seagrass leaves, macroalgae, etc.) and some invertebrates (i.e. sponges and jellyfish) were, in an unselective manner, collected in some parts of the study area and preserved in formaldehyde (8%) to investigate their isotopic signatures. There are no replicates available for all the potential food sources found in the mangrove environment.
SAMPLE PROCESSING
Stable isotopes analysis
All types of primary producers were treated according to the protocol described in Nyunja et al. (Reference Nyunja, Ntiba, Onyari, Mavuti, Sotaert and Bouillon2009). Samples of each food item were thoroughly and carefully washed with milli-q water two to three times. A small portion of each sample was placed on a pre-combusted Whatman GF/F filter with a pore-size of 0.7 mm. Milli-q water was added to the filtration apparatus. Then the GF/F filters were transferred to Petri dishes and kept in a freezer at −20°C for 24 h. Then, these samples were freeze-dried for 3 h. The acidification step for 50% of the samples was done by HCl fumes into HCl vacuum for 4 h. The filters were also re-dried at 60°C for 24 h prior to analysis (Lorrain et al., Reference Lorrain, Savoye, Chauvaud, Paulet and Naulet2003). For sponge and jellyfish tissues, a few drops of HCl (0.25 N) were added to the silver cups, in which invertebrate tissues were put, in order to remove carbonates. Samples were re-dried on a pre-heated plate at 60–70°C (Nieuwenhuizen et al., Reference Nieuwenhuizen, Maas and Middelburg1994).
A total of 41 fish tissue samples were also thoroughly and carefully washed with milli-q water. Per species, three replicates from three different individuals (except for Platycephalus indicus, for which only two individuals were caught, and for Acentrogobius nebulosus and Leiognathus equulus, for which no samples were used as they were too degraded) were separately placed into pre-combusted glass Petri dishes to avoid any contamination. All samples were oven-dried at 60°C for 48 h. The dry tissues were weighed according to sample type (0.5 mg for fish, 1.2 mg for sponges and 1.0 mg for jellyfish) and the appropriate amount of material was placed in silver cups (previously combusted at 450°C for 4 h).
Samples of both food sources and fish tissues were analysed using a Flash Elemental Analyzer (EA) 1112 HT coupled through Conflo IV to Thermo Delta V Advantage Isotope Ratio Mass Spectrometer. Carbon and nitrogen isotope ratios were expressed in the conventional delta notation (δ13C, δ15N) relative to standard reference materials and the results from the formula:
where X is either 13C or 15N and R is the ratio of the heavy to the light isotope (Nyunja et al., Reference Nyunja, Ntiba, Onyari, Mavuti, Sotaert and Bouillon2009).
Potential food sources were fixed with a formaldehyde solution and resulted in an average depletion of 1.65‰ of δ13C values (Sarakinos et al., Reference Sarakinos, Johnson and Zanden2002) in comparison with fish tissues which were preserved in ethanol. Our results for δ13C were, therefore, corrected with consideration of the depletion due to the use of formaldehyde. For each trophic transfer between a consumer and its diet, we assumed that δ13C values increase on average by 1.0‰ (Fry & Ewel, Reference Fry and Ewel2003; Nyunja et al., Reference Nyunja, Ntiba, Onyari, Mavuti, Sotaert and Bouillon2009), whereas δ15N is typically cited to increase by 3.4‰ (Nyunja et al., Reference Nyunja, Ntiba, Onyari, Mavuti, Sotaert and Bouillon2009). By taking into account the respective enrichments in carbon and nitrogen isotopes, it is possible to determine the food range values of the prey which were preyed upon by fish.
Stomach content analysis
The stomachs of individuals belonging to eight fish species of greatest length (on average more than 4 cm) were opened and all dietary constituents were released in petri dishes (except for Lutjanus ehrenbergii, A. nebulosus, Archamia mozambiquensis, Atherinomorus lacunosus and Periophthalmus argentilineatus, for which samples were not well preserved). These contents were further microscopically investigated for their composition by means of binocular magnifiers. These food items were identified to the lowest taxonomic level possible according to Richmond (Reference Richmond2002), but given the numerous taxonomic uncertainties, we restricted our identifications to classes and families. We were not able to apply the gravimetic method (Hyslop, Reference Hyslop1980) reliably as the stomach contents of each individual were too digested and the remaining fish species were represented by either very small or very few individuals for which no stomach dissection was performed. So we used our data as a presence/absence matrix.
Statistical analysis
Differences in fish assemblages between stations using different fishing gears were tested by creating a non-multi-dimensional scale plot (nMDS) based on a Bray–Curtis similarity matrix of relative fish abundance in the software PRIMER, v.6.1.6 (Plymouth Routines in Multivariate Ecological Research Ltd, UK). After removal of two outliers (i.e. two gill nets that each gathered one specimen), no significant differences were found. Therefore, data of fish abundance have been pooled together in the analysis regardless of the type of nets.
In order to compare isotope ratios between the different fish species and the food, one-way ANOVA was performed using R with a lattice package (Deepayan, Reference Deepayan2008; R Development Core Team, 2008). All assumptions were fulfilled (Shapiro test for normality and Levene test for homogeneity of variances). As ANOVA results revealed that significant differences were found (P ≤ 0.001), a Tukey post-hoc test was performed for pairwise comparisons between species.
Stomach content data were analysed using the PRIMER software. The stomach data of each fish individual were treated as units. These data were firstly transformed into presence/absence values before creating a Bray–Curtis similarity matrix to quantify the compositional dissimilarity. Similarities among stomach content of each individual were tested by ANOSIM (analysis of similarity), using species as a grouping factor. A SIMPER (similarity percentage) method was used to determine which variables (i.e. food items) were mostly influencing fish species groups and leading to differences within and between these groups (Clarke & Green, Reference Clarke and Green1988; Clarke, Reference Clarke1993).
RESULTS
Species composition of the fish assemblage in Mida Creek
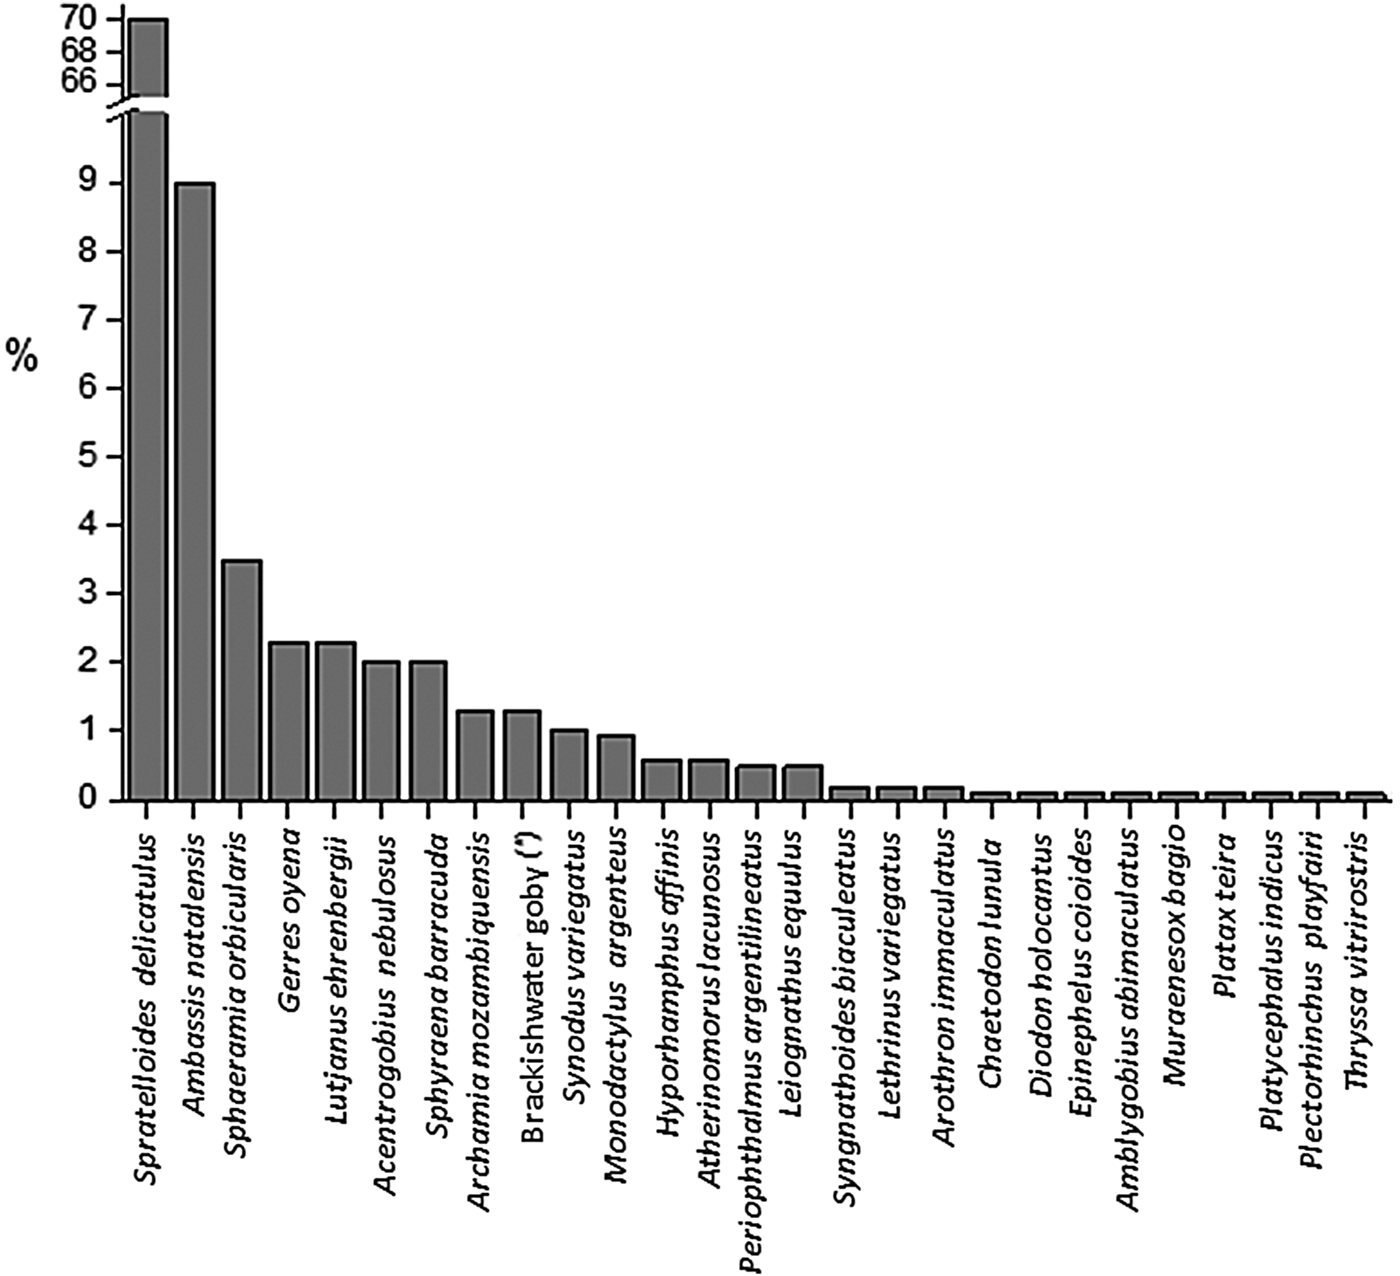
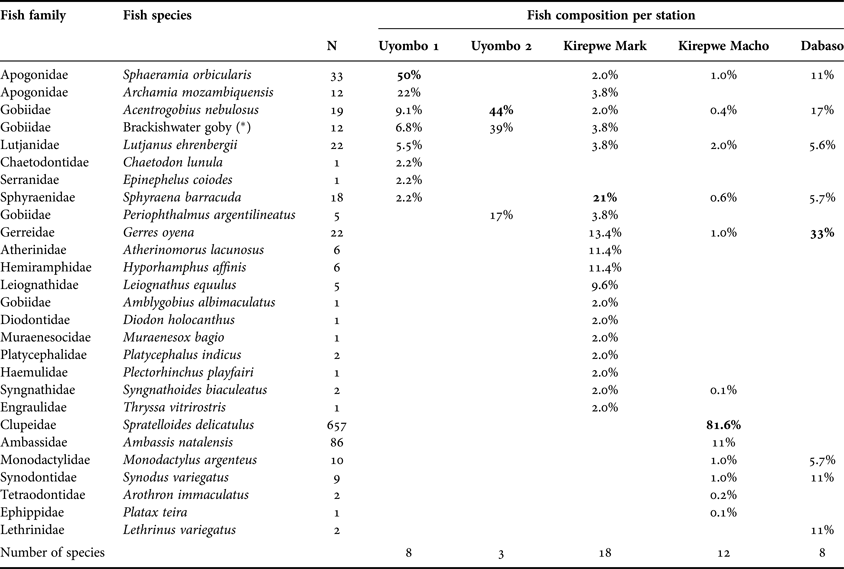
During our survey, 27 teleost species were encountered in Mida Creek with 16 species contributing each <1% to the total catch of 938 specimens (Figure 2 and Table 1). The gregarious species, Spratelloides delicatulus, represented 70% of total fish composition followed by Ambassis natalensis (9%). Both species were present in large cohorts and uniquely caught at Kirepwe Macho. Sphaeramia orbicularis constituted 50% of the fish assemblage at Uyombo 1, where eight species were caught, whereas at the adjacent station (Uyombo 2), A. nebulosus individuals represented 44% of the fish assemblage, with three species encountered in total. On Kirepwe Island (Kirepwe Mark), Sphyraena barracuda represented 20% of the assemblage found. At this station the highest number of species (18 species) was encountered. Twelve fish species were caught in the second station on the island, Kirepwe Macho, where the most abundant species (S. delicatulus) constituted 81.6% of the assemblage. In Dabaso, eight species were recorded with Gerres oyena as the dominant species. Two dead mongooses (Mungos mungo) were found in the nets, and they had probably eaten some of the fish.

Fig. 2. Histogram of the fish composition of Mida Creek. Fish specimens were caught in July 2011 by means of passive fishing gears (fyke nets, gill nets and beach seine). The sampling period specifically took place during spring tide for 5–6 consecutive days. (*) indicates that the vernacular name is used because of problems of identification down to a species name.
Table 1. Overview of the fish composition per sampling site in Mida Creek. Nomenclature is according to Richmond (Reference Richmond2002) and to Froese & Pauly (Reference Froese and Pauly2011). (*) indicates that the vernacular name is used because of problems of identification down to a species name. The total number of individuals (N) per species is presented in a separate column.

Length distribution results
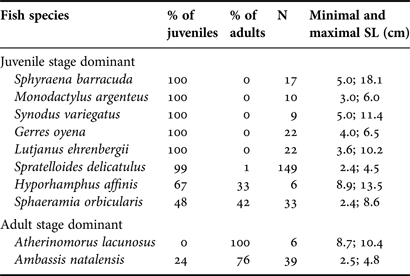
Standard length was measured for 10 species, for which at least six individuals were caught over all stations (Table 2). The proportion of juveniles and adults was identified based on the first maturity length found in Conand (Reference Conand1993), Mees et al. (Reference Mees, Mwamsojo and Wakwabi1999) and Froese & Pauly (Reference Froese and Pauly2011), except for Archamia mozambiquensis, A. nebulosus and the brackishwater goby, for which no data about maturity length were available. Data showed that six species (i.e. S. barracuda, Monodactylus argenteus, Synodus variegatus, G. oyena, L. ehrenbergii and S. delicatulus) were (almost) exclusively represented by juveniles. Two other species with the juvenile stage dominant, Hyporhamphus affinis and S. orbicularis, had a greater proportion of adults (33% and 42%, respectively). The last two species, A. lacunosus and A. natalensis, showed a high abundance of adults, with percentages varying from 76% to 100%.

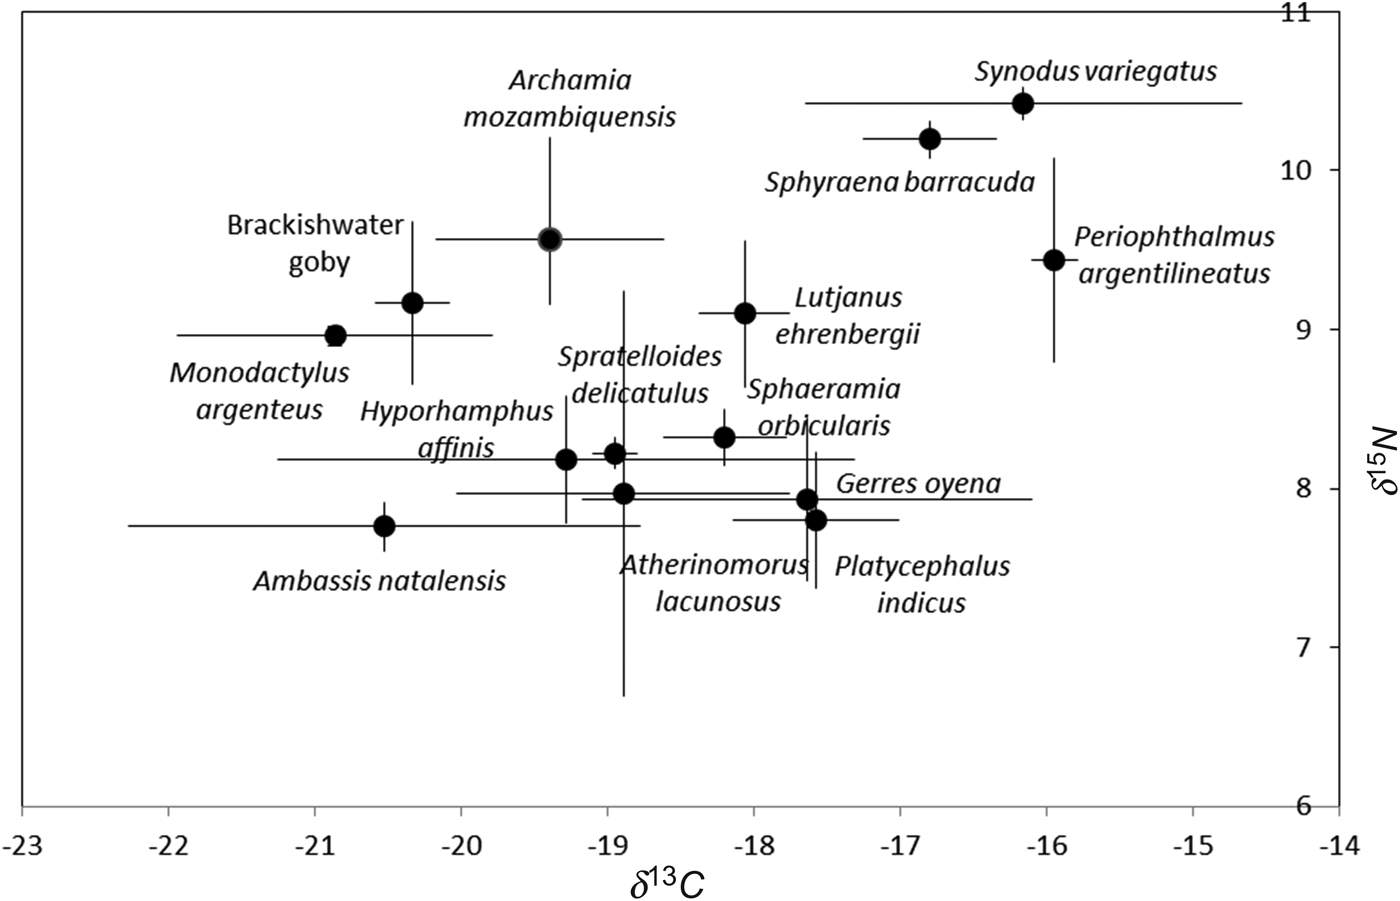
Fig. 3. Plot of δ13C and δ15N (average ± standard deviation) showing spatial variation of 14 fish species caught in Mida Creek (July 2011). Three replicates per species were used (except for Platycephalus indicus, for which only two individuals were caught).
Table 2. Percentage of juveniles and adults and the total number of individuals measured (N) for ten fish species having at least six individuals with minimal and maximal standard length. All individuals were caught in Mida Creek in July 2011.

Stable isotopes ratios of potential food sources and some invertebrates
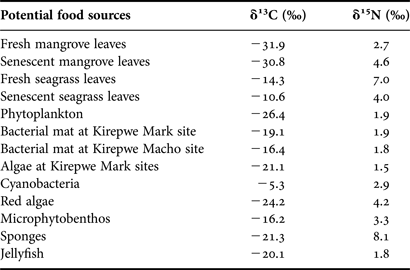
Carbon and nitrogen isotope signatures have been calculated for 13 potential food sources (Table 3). Values of δ13C and δ15N showed a high variability. Fresh and senescent mangrove leaves showed the most depleted δ13C values (−31.9‰ to −30.8‰), while both degradation states of seagrass leaves (−14.3‰ to −10.6‰) were more enriched. Phytoplankton (−26.4‰) had the third most depleted δ13C values, but its δ15N result was in the same range as other organisms. The δ13C signatures of all different bacteria films varied from −19.1‰ for bacterial mats (Kirepwe Mark) to −5.3‰ for cyanobacteria, whereas δ15N remained similar. The algae group exhibited diverse δ13C signatures (−24.2‰ for red algae and −16.2‰ for microphytobenthos) as well as for δ15N (1.5–4.2‰). Some invertebrate organisms (i.e. sponges and jellyfish) differed from each other in δ15N signatures. Sponge nitrogen signature (8.1‰) was higher than jellyfish (1.8‰).
Table 3. Stable carbon and nitrogen isotopic signatures of 11 potential food sources and some invertebrates in Mida Creek mangroves (July 2011).

Stable isotopes ratios of fish species
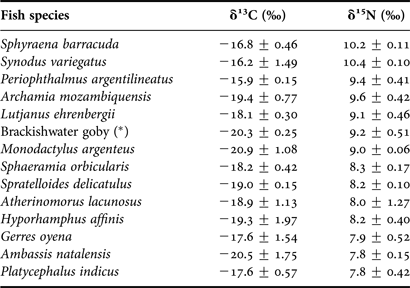
Carbon and nitrogen isotope signatures for 14 fish species (three replicates per species, except for P. indicus where only two individuals were caught, and for A. nebulosus and L. equulus, for which no samples were used as they were too degraded) from Mida Creek are summarized in Table 4 and Figure 3.
Table 4. Average carbon and nitrogen stable isotope signatures (± standard deviation) for 14 fish species with at least two individuals caught in a mangrove environment (Mida Creek) in July 2011. (*) indicates that vernacular name is used because of problems of identification down to a species name.

There was a wide range in consumer δ13C values, varying from −20.9 ± 1.08‰ for M. argenteus to −15.9 ± 0.15‰ for P. argentilineatus. In addition, average δ13C ratios significantly differed between three species on one hand and the remaining species on the other (ANOVA; P < 0.001; Df: 13; 27; F = 6.34). This resulted in two major groups: (1) highly enriched δ13C values for S. barracuda, S. variegatus and P. argentilineatus; and (2) intermediate δ13C values ranging from −20.9‰ (±1.08) to −17.6‰ (±1.54) for the remaining 11 species.
These findings were assessed using the δ15N results. Stable nitrogen ratios, indicative of trophic levels, ranged from 7.8‰ (±0.15) for A. natalensis to 10.4‰ (±0.1) for S. variegatus. There were significant differences in δ15N values between the species (ANOVA; P < 0.001; d.f.: 13; 27; F = 9.25) and two separate groups could be identified: (1) species with higher and similar nitrogen values, S. barracuda and S. variegatus (10.2 ± 0.11‰ and 10.4 ± 0.1‰, respectively); and (2) all other species showing lower δ15N values (from 7.8 ± 0.42‰ to 9.6 ± 0.42‰).
Considering a differential fractionation of −3.4‰ for δ15N and −1.0‰ for δ13C, graphically represented by an arrow for each group in Figure 4, the presumed food range values can be identified for the two groups of fishes that significantly differed in δ15N signatures (see dotted light grey and dark boxes, respectively). This figure shows that the ichthyofauna of Mida Creek is not directly feeding on primary producers. Moreover the sponges' dual signature is situated in the carbon and nitrogen values of fish group 2, meaning that these organisms are not included in the diet of fish.
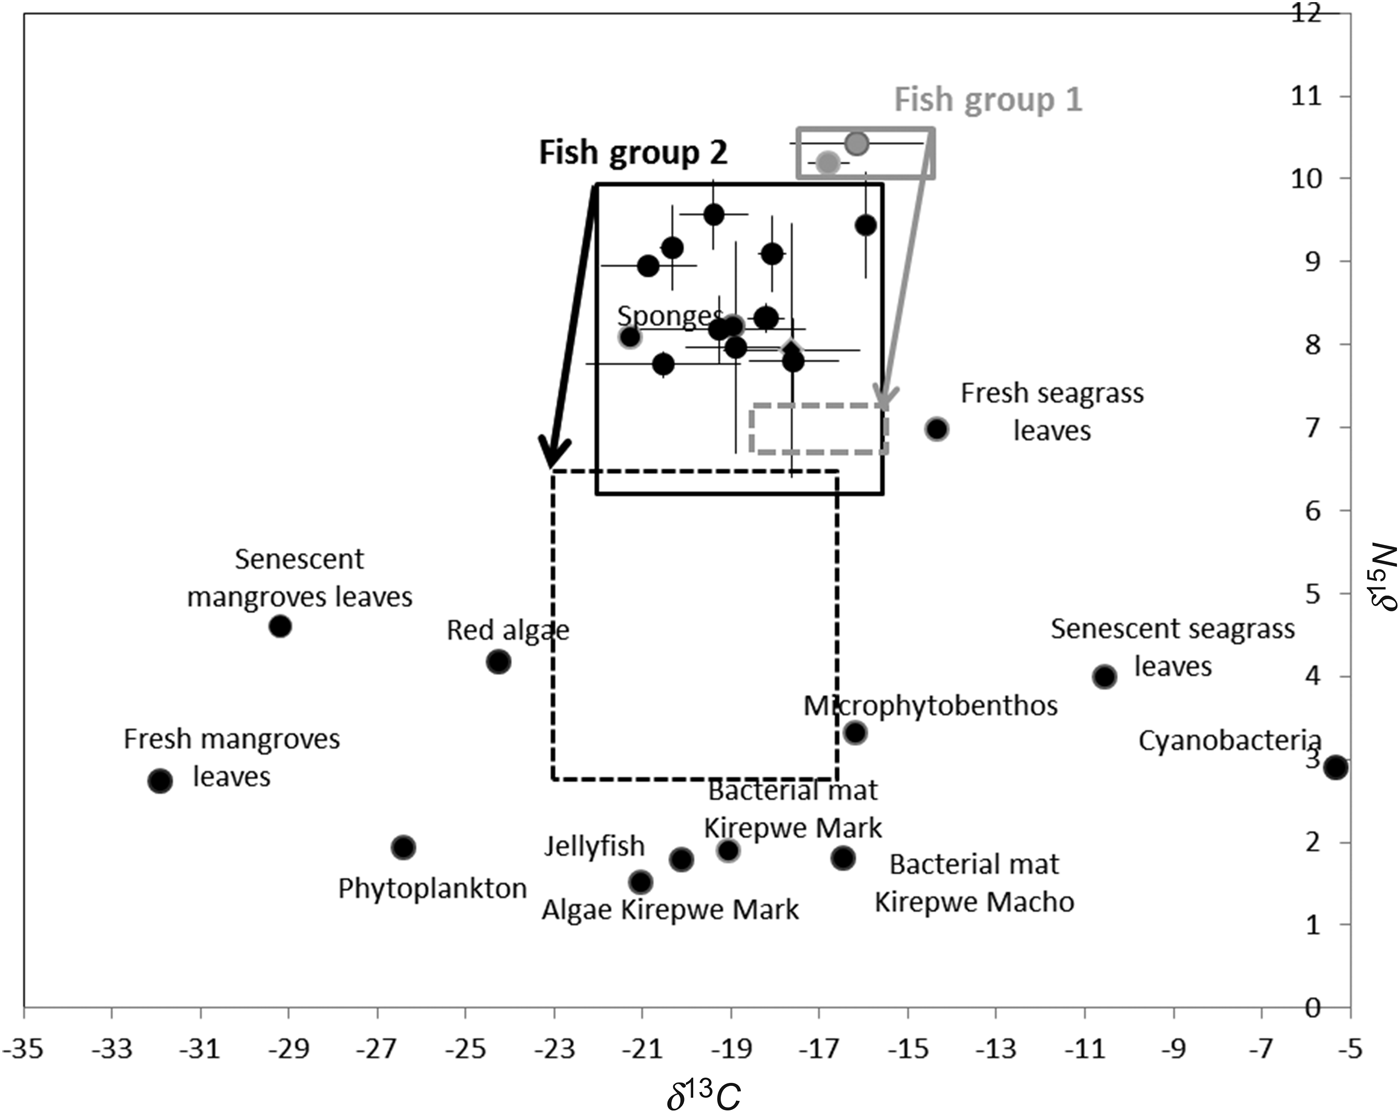
Fig. 4. Plot of δ13C and δ15N of potential food sources, some invertebrates and fish species caught in Mida Creek (July 2011), based on significant differences in δ15N values. The solid lines encircle all fish specimens of each group and the dashed lines represent the potential feeding ranges of both fish groups. The arrows represent the differential fractionation of −3.4‰ and −1.0‰ for, respectively, δ15N and δ13C.
Stomach contents
The results of stomach contents of eight fish species show that fish were feeding on 20 different food items (Table 5). Detritus were present in stomachs of seven species (except S. variegatus) and contributed between 50% (e.g. H. affinis or M. argenteus) and 100% (e.g. L. equulus) of the diet (SIMPER results). Crustaceans also were part of the diet of seven species.
Table 5. Presence/absence matrix of stomach contents of individuals belonging to eight different fish species caught in a mangrove environment (Mida Creek) in July 2011 indicating on which food items they were feeding. (*) indicates that vernacular name is used because of problems of identification down to a species name. N, the number of individuals.
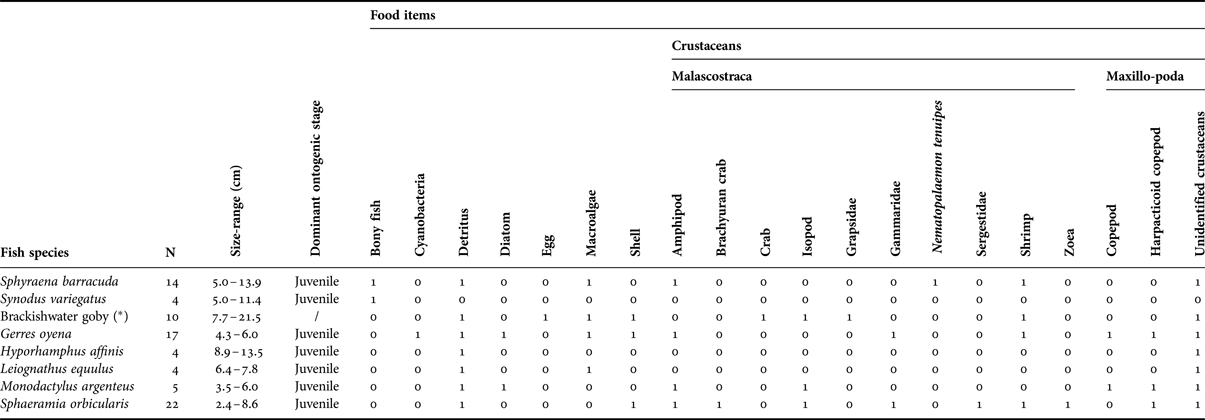
Significant differences in stomach content composition between species were found (ANOSIM global test statistic R = 0.315; P < 0.001). The stomach contents of juveniles belonging to S. barracuda species differed from S. orbicularis and G. oyena; while S. variegatus significantly differed from the brackish water goby, G. oyena and S. orbicularis. Sphyraena barracuda and S. variegatus individuals differed largely from the others by the consumption of bony fish, which prey was, respectively, present in the stomachs of 50% of individuals and 100% of individuals (SIMPER results). These results confirm the solely piscivorous diet of S. variegatus and the partial piscivorous feeding regime of S. barracuda when individuals are immature. Significant differences were also found between S. orbicularis and the brackish water goby and G. oyena. This difference is due to the absence of macroalgae in all stomachs of S. orbicularis individuals, whereas the average occurrence of this food item in the stomachs of the brackishwater goby and G. oyena reached, respectively, 50% and 65% (SIMPER results). Moreover, the stomachs of all individuals of S. orbicularis showed preferences for crustaceans, especially Gammaridae (the average abundance of all dissected stomachs reached 55%, SIMPER results); whereas they were not present in any stomachs of the brackish water goby and only in 18% of G. oyena individuals (SIMPER results).
DISCUSSION
The species composition of the fish assemblage of Mida Creek
Although Mida Creek has been a protected area since 1979, there are no published data on its ichthyofauna. Indeed most of the ecological studies on fish assemblages from Kenyan mangroves focus on Gazi Bay and other forests situated on the south coast, in the vicinity of Mombasa. At a regional scale, the fish composition of mangroves along the Kenyan coast seems quite variable. In Gazi Bay, over a year, 129 teleost species were identified, of which Gerreidae and Atherinidae were the dominant families, with their individuals composing 77% of the total catch (Kimani et al., Reference Kimani, Mwatha, Wakwabi, Ntiba and Okoth1996). However, based on two recent inventory studies, respectively 42 and 50 fish species were found in Gazi Bay (Crona & Rönnbäck, Reference Crona and Rönnbäck2007; Nyunja et al., Reference Nyunja, Ntiba, Onyari, Mavuti, Sotaert and Bouillon2009). In another Kenyan mangrove forest, Ungwana Bay on the Rasi Ngomeni peninsula, the maximum number of species recorded was 35 species for a sampling effort covering a year, with Clupeidae, Engraulidae, Leiognathidae, Sillaginidae and Gerreidae being the most abundant families in terms of number of species (Mirera et al., Reference Mirera, Kairo, Kimani and Waweru2010). In Mida Creek, 27 fish species were recorded, with the highest numbers of a Clupeidae species, S. delicatulus. Clupeids are fish of relatively small size (i.e. a total length of maximum 7 cm) which form large cohorts (Froese & Pauly, Reference Froese and Pauly2011) and can be caught in large numbers with one haul of a net. Several authors have previously singled out the Clupeidae as the main contributor to the mangrove fish assemblage (Mirera et al., Reference Mirera, Kairo, Kimani and Waweru2010) including Gazi Bay (Huxham et al., Reference Huxham, Kimani and Augley2004).
Mida, Gazi and Ungwana mangroves exhibit different physico-chemical features that possibly explain the differences between their fish communities, although difference in sampling strategy and intensity may cause differences as well. Mida has only a freshwater input through groundwater and precipitation, whereas the main Gazi channel drains the Kidogoweni River (Nyunja et al., Reference Nyunja, Ntiba, Onyari, Mavuti, Sotaert and Bouillon2009). The major physical feature differing between Ungwana and Mida is the freshwater discharge from the Tana and Sabaki rivers, and the influence of the colder waters from the Somali Current in Ungwana Bay (Obura, Reference Obura2001). For instance, one fishing ground, Formasa, in front of Ungwana, shows an abundance of freshwater fish families (i.e. Cichlidae and Clariidae), whereas, in another known fishing place closer to Mida, the more abundant families recorded occur in saltwater (Munga et al., Reference Munga, Ndegwa, Fulanda, Manyala, Kimani, Ohtomi and Vanreusel2012). The season of sampling may also contribute to a shift in fish species composition. As illustrated by Wakwabi & Mees (Reference Wakwabi and Mees1999) for Tudor Creek, the period from May to August is the typical long rainy season during which the fish species number is the smallest. In fact, fish mortality seemed to increase during that period of the year but did not affect the major taxa (Mwandya et al., Reference Mwandya, Gullstrom, Andersson, Ohman, Mgaya and Bryceson2010). Our field sampling was done in July, during the south-east monsoon which brings considerable rainfall and likely also explains the low number (27) of species recorded.
The composition of fish catches can also strongly depend on the technique used. All studies performed in Mida Creek, Gazi Bay and Ungwana Bay used diverse passive fishing gears (e.g. beach seine or stake-nets) with different sizes of mesh and also with various sizes of opening.
A general trend in the decrease of abundance of species richness along the Kenyan coastline is also observed. In the 1990s the sizes of the total catch were bigger (e.g. up to 19,000 fish) and the species number greater (e.g. from 75 to 128 teleost species) (De Troch et al., Reference De Troch, Mees, Papadopoulos and Wakwabi1996; Kimani et al., Reference Kimani, Mwatha, Wakwabi, Ntiba and Okoth1996), while in the most recent surveys, only 40–50 species as a maximum have been recorded, and total catches are lower (Crona & Rönnbäck, Reference Crona and Rönnbäck2007; Nyunja et al., Reference Nyunja, Ntiba, Onyari, Mavuti, Sotaert and Bouillon2009; Munga et al., Reference Munga, Mohamed, Obura, Vanreusel and Dahdouh-Guebas2010). This observed decline needs further confirmation by standardized comparisons between past and future inventories. To conclude, the results of the fish species composition of Mida Creek represent the typical situation for a tropical ecosystem, with one or two dominant species and many less abundant ones (Kimani et al., Reference Kimani, Mwatha, Wakwabi, Ntiba and Okoth1996; Mirera et al., Reference Mirera, Kairo, Kimani and Waweru2010). Nevertheless, the relatively low number of species recorded compared with older studies from adjacent areas is probably also influenced by the period of sampling (i.e. season) and/or by the sampling technique, but this has to be further investigated. A continuous survey conducted throughout the year might give the exact picture of available teleost fish species.
The population structure of the ichthyofauna
Most of the individuals caught during our survey were juveniles, while adult specimens were represented by individuals of small size (maximum 10 cm). In Mida Creek, the immature fish were more abundant than adults, as the population of the numerically more abundant species (i.e. S. delicatulus) was represented by 99% juveniles, and contributed to 70% of the total fish composition (Table 2; Figure 2). Our results indicate that mangroves may serve as a nursery ground. Most individuals of S. barracuda, M. argenteus, S. variegatus, G. oyena, L. ehrenbergii, S. delicatulus and H. affinis were found at juvenile stage in the studied mangroves. All these species would probably occupy the mangrove waters for a very limited period, to feed or to escape from predators. These species could be so-called transient species because they may spend an important part of their time in mangrove creeks during low tide when no other suitable protective habitats are available in the neighbourhood, and/or migrate to other ecosystems (e.g. coral reefs) due to a shift in ontogeny (Mwandya et al., Reference Mwandya, Gullstrom, Andersson, Ohman, Mgaya and Bryceson2010; Kimirei et al., Reference Kimirei, Nagelkerken, Griffioen, Wagner and Mgaya2011, Reference Kimirei, Nagelkerken, Mgaya and Huijbers2013). For instance, they may migrate to mudflat areas as they become less vulnerable to predation and are able to forage safely in more open and less protected habitats (Laegdsgaard & Johnson, Reference Laegdsgaard and Johnson2001). Nagelkerken et al. (Reference Nagelkerken, Roberts, van der Velde, Dorenbosch, van Riel, Cocheret de la Morinière and Nienhuis2002) have already suggested that S. barracuda is a species with possible dependence on mangrove and/or seagrass as nursery habitat, and our study supports their statement. The juveniles of this circumtropical species were only encountered in the mangrove environment, while adults were present on coral reefs. Given our restricted sampling strategy (i.e. net removal after 24 h), our assumptions about fish migration toward other ecosystems need to be taken with caution. Besides, a trade-off seems to exist between food abundance/growth rate and predation pressure/mortality risk, where fish specifically chose habitats which minimize the ratio of mortality risk to growth rate (Grol et al., Reference Grol, Dorenbosch, Kokkelmans and Nagelkerken2008).
The population of S. orbicularis in Mida Creek consisted of almost 50% adults. Results from research performed by Mees et al. (Reference Mees, Mwamsojo and Wakwabi1999) suggested that this species is a permanent resident in swamp forests, forming small aggregations resting in the rhizophores. The cohort of both juveniles and adults at Uyombo 1 constituted the dominant species. This station is the most remote place in the mangrove forest, where permanent pools are formed, suggesting that they probably live into the root complex of mangrove forests throughout their ontogeny.
Two species, A. natalensis and A. lacunosus, were represented, respectively, by 76 and 100% of adult individuals in Mida Creek. Atherinomorus lacunosus form large schools along sandy shorelines and reef margins (Froese & Pauly, Reference Froese and Pauly2011). The few adult individuals caught in Mida Creek (six specimens; Table 2) may indicate that, when maturity is reached, young adults move to other less protected environments, such as coral reefs. Juveniles of A. natalensis as well as young adults were found in mangroves, but along the south coast of Africa (Mvoti estuary), it has been reported that this ambassid fish is an eurytopic species which is able to live in freshwater (Whitfield, Reference Whitfield1998; Froese & Pauly, Reference Froese and Pauly2011; Swemmer, Reference Swemmer2011). This species is, thus, well adapted to live in the dynamic mangrove ecosystem where environmental conditions (e.g. salinity) vary substantially.
The trophic interactions of fish in mangroves
Mangrove forests are often considered as ecosystems offering important provision of food sources for the ichthyofauna (Lugendo et al., Reference Lugendo, Nagelkerken, Kruitwagen, van der velde and Mgaya2007), but this role still remains controversial. In the present study, we used dual isotopic signatures of 13C and 15N, which is a technique applied as an indicator of the trophic level. Stable isotope analysis is based on two assumptions: (1) different primary producers may exhibit diverse δ13C values due to different pathways of photosynthesis (C3 or CAM for crassulacean acid metabolism species) or the diverse potential inorganic carbon sources; and (2) a consistent degree of fractioning occurs between the isotopic signal of the prey and the consumer (Bouillon et al., Reference Bouillon, Koedam, Raman and Dehairs2002; Layman, Reference Layman2007).
Stable isotope results highly suggest that the fish assemblage of Mida creek can be separated into two functional groups reflecting their trophic mode: (1) the mainly piscivorous species; and (2) a more heterogeneous group of zoobenthivorous/omnivorous species.
Synodus variegatus and S. barracuda are found higher in the food web, given their high δ15N values, and are considered as fish predators due to the presence of bony fish in their stomachs. The piscivorous diet of S. barracuda through all life stages has already been identified by De Troch et al. (Reference De Troch, Mees, Papadopoulos and Wakwabi1996, Reference De Troch, Mees and Wakwabi1998) in Gazi Bay, but crustaceans, amphipods and shrimps were also found in the guts of juveniles collected in this present study and also in individuals from research conducted by Lugendo et al. (Reference Lugendo, Nagelkerken, van der Velde and Mgaya2006). Synodus variegatus feeds on small fish from passing schools (Froese & Pauly, Reference Froese and Pauly2011). These fish were mainly present in Kirepwe Macho, where large groups of clupeids (i.e. S. delicatulus) were encountered.
The group of zoobenthivorous/omnivorous species is a heterogeneous one, which encompasses fish which do not significantly differ in their diet, except for S. orbicularis, the brackish water goby and G. oyena. Our results indicate that the orbiculate cardinalfish (S. orbicularis) mainly feed on crustaceans confirming previous findings in Mees et al. (Reference Mees, Mwamsojo and Wakwabi1999). All the other species show overlaps in diet, partially feed on crustaceans (e.g. shrimps, crabs and copepods) or on macroalgae. A study carried out in Mtwapa Creek indicated that the trophic niches of S. delicatulus and A. lacunosus highly overlapped because they utilized the same food source, copepods (Mavuti et al., Reference Mavuti, Nuynja and Wakwabi2004).
The values of δ13C in collected fish do not show any direct feeding link with primary producers, including the mangrove leaves at different stages of degradation. Mangrove associated primary producers (e.g. phytoplankton, seagrass and algae) do not appear to be direct food sources for the fish species studied. Fish group 1, only composed of two predatory species, seems to feed on fish group 2, comprising 12 species. Through data in the literature we found that the presumed feeding range values of the fish group 2 (−16‰ to −23‰ for δ13C and 3–6.5‰ for δ15N) fitted into the data for molluscs and crabs of Bouillon et al. (Reference Bouillon, Moens, Overmeer, Koedam and Dehairs2004) from similar and adjacent mangrove ecosystems. The observed feeding range of fish group 2 in Mida Creek includes the typical mangrove bottom invertebrates, non-benthic fish larvae and zooplankton. It supports the idea that the fish diet relies on the secondary consumers living within this ecosystem. In a perspective to assess the feeding function of mangroves, albeit in an indirect manner through invertebrates, evidence of direct consumption of leaves by these invertebrates has to be investigated in the future.
Only a limited number of studies using stable isotope signatures have included mangrove-inhabiting invertebrates (Newell et al., Reference Newell, Marshall, Sasekumar and Chong1995; Loneragan et al., Reference Loneragan, Bunn and Kellaway1997; Bouillon et al., Reference Bouillon, Koedam, Raman and Dehairs2002; Pape et al., Reference Pape, Muthumbi, Kamanu and Vanreusel2008; Kruitwagen et al., Reference Kruitwagen, Nagelkerken, Lugendo, Mgaya and Wendelaar Bonga2010). Their results suggest that most crustaceans show a high dependence on microphytobenthos (e.g. Littoraria scabra or Terebralia palustris) growing on mangrove substratum or on epiphytes from seagrass beds (e.g. juvenile prawns), while Sesarma crabs directly feed on mangrove products (i.e. leaves and detritus) (Newell et al., Reference Newell, Marshall, Sasekumar and Chong1995; Loneragan et al., Reference Loneragan, Bunn and Kellaway1997; Pape et al., Reference Pape, Muthumbi, Kamanu and Vanreusel2008; Kruitwagen et al., Reference Kruitwagen, Nagelkerken, Lugendo, Mgaya and Wendelaar Bonga2010). There is still a scarcity of knowledge about the overall marine community of invertebrates, especially from East Africa. Future research comparing isotopic values of carbon sources found in mangroves with invertebrate signatures from Mida Creek should assess this concept and enlighten the essential trophic role of mangroves.
CONCLUSION
The present study explored the ichthyofauna of Kenyan mangrove forests at Mida Creek.
Small-sized fish with a wide geographical distribution (belonging to Clupeidae and Ambassidae) are the dominant species in Mida Creek. The ichthyofauna in these mangroves mainly consist of transient species (e.g. coral or seagrass associated). Juveniles were numerically more abundant in the Creek than adults, supporting the hypothesis of a nursery function for mangrove forests. By using stable isotopes and stomach content analyses we showed that the fish assemblage can be divided into two functional groups: (1) mainly piscivorous species (S. barracuda and S. variegatus); and (2) zoobenthivorous/omnivorous species (mostly belonging to Ambassidae, Clupeidae and Apogonidae families) feeding on small benthic and pelagic invertebrates.
ACKNOWLEDGEMENTS
The authors would like to thank Professor Dr Steven Bouillon and Zita Kelemen (University of Leuven) for giving us access to IRMS facilities, Francesca Pasotti (University of Ghent) for her help during the preparation process of stable isotope samples, Dixon Odongo (Kenyan Marine and Fisheries Research Institute) for his help in fieldwork and fish identification and also to Dr Bruno Frédérich (University of Liège) for his help during the process of drafting this paper.
FINANCIAL SUPPORT
This study was financially supported by the Kenya–Belgium IUC-RIP Project implemented at the University of Nairobi (Kenya) and by the VLIR-UOS travel grant (L.G., 2011) for students in the Flemish Community.


