INTRODUCTION
Habitat composition is a significant environmental factor that structures assemblages of reef fishes (Pereira et al., Reference Pereira, Moraes, dos Santos, Lippi, Feitosa and Pedrosa2014). Studies on coral reef habitats have mainly proposed and focused on quantification of benthic reef variables encompassing corals (hard, soft and dead corals), invertebrates and algae (calcareous, coralline, turf and fleshy algae) (Obura & Grimsditch, Reference Obura and Grimsditch2009; McClanahan et al., Reference McClanahan, Baker and Ateweberhan2011). Of particular interest has been the empirical quantification of the relationship between percentage cover of benthic reef variables, reef fish assemblages and the impacts of fishing (Jennings et al., Reference Jennings, Grandcourt and Polunin1995; Bergman et al., Reference Bergman, Öhman and Svensson2000). A strong relationship does exist between benthic habitat structure and fish community and most importantly, the benthic structure influences the relative abundance of fish functional groups (Khalaf & Kochzius Reference Khalaf and Kochzius2002a; Garpe & Ohman, Reference Garpe and Ohman2003; Pittman et al., Reference Pittman, Caldow, Hile and Monaco2007). Moreover, benthic habitat composition and distribution, and its link with fish abundances and biomass are important in understanding the ecological status of marine environments (Jennings et al., Reference Jennings, Grandcourt and Polunin1995).
Few functional-based fish studies have been reported within the WIO region (e.g. Jennings et al., Reference Jennings, Grandcourt and Polunin1995; Khalaf & Kochzius, Reference Khalaf and Kochzius2002a; Samoilys & Randriamanantsoa, Reference Samoilys, Randriamanantsoa, Obura, Di Carlo, Rabearisoa and Oliver2011) in comparison to taxonomy-based fish investigations (e.g. Samoilys, Reference Samoilys1988; Khalaf & Kochzius, Reference Khalaf and Kochzius2002b; Kochzius, Reference Kochzius2007; McClanahan & Humphries, Reference McClanahan and Humphries2012) despite an increased interest in functionality studies over the last decade (Caliman et al., Reference Caliman, Pires, Esteves, Bozelli and Farjalla2010). Ecosystem functionality emphasizes functional groups and multiple processes involved in transfer of energy and matter over time and space (Reiss et al., Reference Reiss, Bridle, Montoya and Woodward2009). In this regard ecosystem functioning entails the composite effects of all processes that sustain an ecosystem. The relevance of focusing on a functionality approach is to enable description of community-level feeding patterns and determine how for instance, the benthic habitat is influenced by fish functional groups and which species or taxa are critical in maintaining an ecosystem (Edwards et al., Reference Edwards, Friedlander, Green, Hardt, Sala, Sweatman, Williams, Zgliczynski, Sandin and Smith2014). More so, functional diversity as opposed to species diversity augments the ecosystem processes. Two concepts support the functionality approach: (1) concept of redundancy – performance of the same ecological role by several species, and (2) concept of functional groups – grouping of species according to their functional roles. More often feeding guilds are assumed to be synonymous to functional groups representing an assemblage of species performing indistinguishable functions, regardless of their taxonomic affinities (Bellwood et al., Reference Bellwood, Hughes, Folke and Nyström2004). Due to limitation of time and resources, selection of species or taxa to be counted is paramount, though the choice should be informed by prior ecological studies (Bellwood & Wainwright, Reference Bellwood, Wainwright and Sale2002; Samoilys & Randriamanantsoa, Reference Samoilys, Randriamanantsoa, Obura, Di Carlo, Rabearisoa and Oliver2011).
This study investigates the link between the composition of benthic habitats and fish functional groups. The study specifically seeks to characterize the difference between benthic habitats based on benthic cover composition, and assess the linkage of fish functional groups’ relative abundances, functional diversity and biomass to the benthic habitats. To achieve these objectives benthic and fish data were collected to test the following null hypotheses: (1) all four geographic areas are similar in benthic habitat composition; (2) there is no association of fish functional groups for particular benthic habitats; and (3) there is no difference in biomass of fish functional groups across different benthic habitats.
MATERIALS AND METHODS
Study area
Benthic and fish surveys were done between March 2010 and October 2011 at 32 sites in Tanzania, Mozambique, Comoros and Madagascar (Figure 1, Table 1). Sites were selected haphazardly and ranged from shallow, fringing protected reefs to deep, exposed fore-reef slopes to maximize the range of reef habitats in each country, though constrained by time and resources. Reef type of each site was defined based on the coral reef habitats in the Atlas of Western Indian Ocean Coral Reefs (Andréfouët et al., Reference Andréfouët, Chagnaud and Kranenburg2009). The sites were further categorized based on their exposure to oceanic seas and trade winds (Table 1).
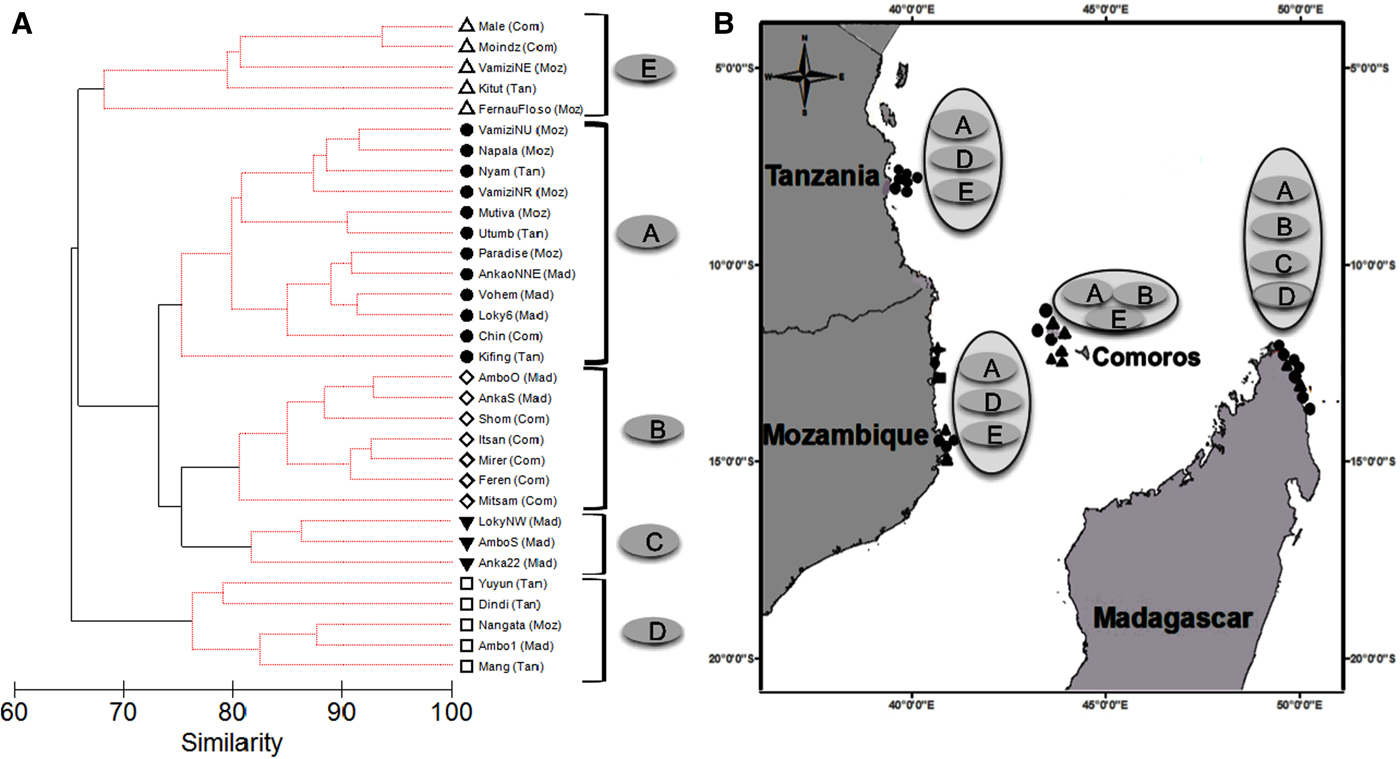
Fig. 1. (A) Cluster analysis of benthic composition – hard corals, soft corals, turf algae, fleshy algae, coralline crustose algae, and rubble from coral reefs in the Western Indian Ocean. Black solid lines join significant clusters groups, identified as habitat type A, B, C, D and E. The suffixes in brackets are the site geographic locations: Com – Comoros, Mad –Madagascar, Moz – Mozambique and Tan –Tanzania. (B) Map of the study sites showing number of fish transects at each site represented by black symbols, and habitat type enclosed by geographic location. Closed triangles = 3, closed square = 4, closed circles = 5, star = 7 fish transects. The habitat types are described in Table 3.
Table 1. Summary of site's coordinates, reef types, exposure to oceanic conditions, depth ranges, number of benthic estimates, fish transects of surveyed sites from coastal areas of four countries within the Western Indian Ocean province.
a 1 = bay, 2 = semi-protected inner reef complex or N/NW facing with some protection e.g. from island, land mass, 3 = open sea facing N/NW/W, 4 = open sea facing S/SE/E with some protection from trade winds (e.g. submerged reef or bank or land mass further offshore), 5 = facing S/SE/E with full exposure to trade winds and oceanic conditions.
Benthic surveys
Benthic composition was assessed to give a broad-scale indication of the structure and condition of the coral reefs considering the equilibrium between corals and algae. It was quantified visually from the benthic variables comprising percentage cover of live hard and soft corals, fleshy, turf and crustose coralline algae (CCA), and rubble. Live hard corals constitute the calcified reef building corals; soft corals are the non-reef building corals lacking a rigid calcium carbonate skeleton; fleshy algae are the non-calcareous brown and green algae with large fronds; turf algae are assemblages of green, red and brown algae that are considered inhibitors of corals. CCA are calcified encrusting algae varying from whitish to dark brown colour and considered important in promoting coral recruitment and binding of reef framework. Rubble is the available loose substratum indicating suitability for coral recruitment and growth (Obura & Grimsditch, Reference Obura and Grimsditch2009). At each site, one or two visual estimates of the benthic variables were undertaken following methods developed by the International Union for Conservation of Nature (IUCN) working group on Climate Change and Coral Reefs (Obura & Grimsditch, Reference Obura and Grimsditch2009). The methods were similar to manta tow techniques (Sweatman et al., Reference Sweatman, Cheal, Coleman, Delean, Fitzpatrick, Miller, Ninio, Osborne, Page and Thompson2001) and involved rapid assessment of benthic variables by visually sampling a broad-scale area, usually with no or low replication.
Fish surveys
Fish survey sites corresponded to the same sites as the benthic surveys, and were done to assess the health of coral reefs. A broad range of taxa was selected for the surveys that were then assigned to specific trophic groups relevant in assessing health of the coral reefs, where health refers to the reef's ecological resilience – its ability to resist threats and to recover to a healthy state when an impact does occur (Table 2). Fish densities and size classes of selected taxa were estimated using Underwater Visual Census (UVC) belt transect (English et al., Reference English, Wilkinson and Baker1994; Samoilys, Reference Samoilys and Samoilys1997; Samoilys & Carlos Reference Samoilys and Carlos2000). The selected taxa comprised species representing seven main fish functional groups: piscivores, omnivores, corallivores, invertivores, planktivores, detritivores and herbivores (Table 2). The herbivores further constituted an ecologically diverse group consisting of six functional groups: large excavators, small excavators, scrapers, browsers, grazers and grazers-detritivores (after Green & Bellwood Reference Green and Bellwood2009). Fish were counted in 50 × 5 m transects with generally N = 5 transects per reef site, collected on two dives (stations), or occasionally only N = 3 replicate transects from one station where a second dive was not possible (Table 1). During each dive, the minimum and maximum depths for the station was recorded. In each transect, fish were surveyed to species level so that they could be easily assigned to an appropriate trophic group. However, the Balistidae and Pomacanthidae were aggregated to family level and their behaviour of either benthic or planktonic recorded, to ensure accurate assigning of trophic group during the analysis. The total length (TL) of species was estimated in 5 cm size classes. Species identifications were checked using photographs, taxonomic references and photographic guides (Choat & Randall, Reference Choat and Randall1986; Heemstra & Randall, Reference Heemstra and Randall1993; Lieske & Myers, Reference Lieske and Myers1996; Kuiter, Reference Kuiter2002; Kuiter & Debelius, Reference Kuiter and Debelius2006). Verification of species names was done using the online catalogue of fishes (Eschmeyer, Reference Eschmeyer2012).
Table 2. Composition and functional roles of the surveyed fish (after Samoilys & Randriamanantsoa, Reference Samoilys, Randriamanantsoa, Obura, Di Carlo, Rabearisoa and Oliver2011) from coral reefs in the Western Indian Ocean.

Data analysis
To identify differences in benthic habitats, all benthic survey data were arcsine square root transformed to bring percentage data close to normal distribution (Friedlander et al., Reference Friedlander, Obura, Aumeeruddy, Ballesteros, Church, Cebrian and Sala2014), and analysed with PRIMER 6.0 (Primer-E Ltd, Plymouth, UK), where a Bray–Curtis similarity matrix was calculated from the transformed data. Hierarchical cluster analysis was thereafter performed using a Similarity Profile (SIMPROF) test set at a significance level of P = 0.05. The test provides a means of preventing unnecessary further analysis of the benthic sub-cluster (Clarke et al., Reference Clarke, Somerfield and Gorley2008). Each sub-cluster consisted of several sites, which were significantly different from other sub-clusters. These sub-clusters were defined as benthic habitats. One-way similarity percentage analysis (SIMPER) was utilized to identify a composite of benthic variables contributing most to the similarity within the benthic habitats (Clarke, Reference Clarke1993). To assess habitat diversity, Shannon–Wiener index (H’) was calculated based on benthic variables for each site. The H’-values from the different habitats as identified by SIMPROF were compared using a one-way ANOVA and significantly different pairs identified from Tukey HSD test.
The abundance, functional diversity and biomass of fish functional groups were calculated from each site-based transect. Relative abundances were determined from the densities (number of individuals m−2) of fish functional groups. Functional diversity was calculated from density data using two diversity indices: H’ and Pielou's evenness index (J’). H’ is a diversity index that incorporates both abundance and number of functional groups in its calculation, while J’ is a measure of equitability indicating how evenly distributed functional groups are among different benthic habitats (Clarke & Warwick, Reference Clarke and Warwick2001). Biomass was only estimated for six functional groups: piscivores, omnivores, large excavators, small excavators, scrapers and browsers. Biomass was computed by firstly converting the median of species length size class to weight using the formula W = aLb with W as weight, L as length, a as constant and b as slope. Length–weight relationship coefficients (a and b) were obtained from published literature (Letourneur et al., Reference Letourneur, Kulbicki and Labrosse1998; Kulbicki et al., Reference Kulbicki, Guillemot and Amand2005; Green & Bellwood, Reference Green and Bellwood2009; Froese & Pauly, Reference Froese and Pauly2012). Secondly, the biomasses of species representing each fish functional group within each transect were summed together and converted to kilogram per hectare (kg ha−1). Two Bray–Curtis similarity matrices were created from the arcsine transformed relative abundance and log (x + 1) biomass data of fish functional groups. The specific transformations were undertaken to bring data close to normal distribution, and reduce skewness and influence of outliers (Zar, Reference Zar1999). A permutation-based hypothesis testing analysis of similarities (ANOSIM) was used to compare (1) the relative abundance and (2) biomass, across the clustered benthic habitats. ANOSIM significance test has two important terms: P as the significance level and Global R, which ranges between 0 and 1 indicating the level of similarity between the tested groups (Clarke & Warwick, Reference Clarke and Warwick2001). One-way SIMPER was applied to identify the fish functional groups contributing most to the observed pattern of similarity within the benthic habitats (Clarke, Reference Clarke1993). These analyses were performed in PRIMER 6.0.
The abundance and biomass of fish functional groups from each habitat were graphed using box and whisker plots. Significance of differences was tested with the non-parametric Kruskal–Wallis test, after failing to conform to the assumptions of parametric statistics (Zar, Reference Zar1999). Functional diversity indices across the identified habitats were compared using the Kruskal–Wallis test. A post-hoc non-parametric multiple comparison test using ‘kruskalmc’ from the R-package ‘pgirmess’ (Giraudoux, Reference Giraudoux2013) was performed on fish functional groups and functional diversity indices that showed an overall difference across the clustered benthic habitats. These analyses were performed with R v.0.97.551 (R Core Development Team, 2012).
RESULTS
Identification and description of benthic habitats
Hierarchical cluster analysis of the benthic variables using SIMPROF revealed that survey sites clustered into five distinct groups A, B, C, D and E, henceforth identified as habitats (Figure 1A). Particular habitats showed geographic affiliations with habitat A being found in all geographic locations. Comoros sites clustered in either habitats A, B or E, northern Madagascar had A, B, C and D type habitats, whereas central Tanzania and northern Mozambique sites had habitats A, D and E (Figure 1B). Since Habitat C was only found at three sites (all in Madagascar), conclusions on this substrate type are limited. The five habitats were characterized by a composite of different benthic variables that included varying percentage cover of live hard corals, soft corals and turf algae (Table 3). Live hard corals declined in cover from habitat A (59.7%) to E (14.4%), in contrast to turf algae, which generally increased in cover from habitat A (12.2%) to E (47.1%). The cover of soft corals was highest in habitat C (30.9%) and lowest in habitat E (2.6%), whereas fleshy algae dominated Habitat D (Table 3).
Table 3. Description of habitats A, B, C, D and E from coral reefs in four countries in the Western Indian Ocean based on SIMPER analysis of cover of benthic variables contributing about 90% of within habitat similarity.
Number of sites per habitat: A (N = 12), B (N = 7), C (N = 3), D (N = 5) and E (N = 5).
Shannon–Wiener index of diversity (H’) was significantly different across the five benthic habitats (ANOVA, F = 4.98, df = 4, P = 0.004). Tukey HSD tests showed habitats B and C were more diverse (both H’ = 1.6 ± 0.1 SD) than A (1.4 ± 0.2 SD) (Figure 2).

Fig. 2. Shannon–Wiener index of diversity (mean ± SD) of benthic composition grouped by habitat type from coral reefs in the Western Indian Ocean. Habitats with identical lowercase letters are not significantly different based on Tukey HSD test. Description of five habitats is given in Table 3.
Site information
The surveys were conducted at six reef types with 53% of the sites occurring on forereef, 16% on shallow terrace, 13% on deep terrace and 9% each on shallow lagoonal terrace and diffuse fringing reef (Table 1). The sites ranged from shallow to deep, and from semi-protected to exposed forereefs and terraces. Habitat A occurred in all reef types and consisted of sites with mixed exposure to oceanic seas and trade winds but generally in less exposed semi-protected inner reef complexes. Habitat B occurred in forereef, deep terrace and shallow lagoonal terrace reef types that were in the semi-protected inner complex or open sea facing north or north-west. Habitats C and E were found in forereef, diffuse fringing reef and shallow terrace. Sites that clustered in habitat C were less exposed to oceanic conditions occurring in semi-protected inner complex or open sea facing north or north-west. Habitat D occurred in most reef types except diffuse fringing reef and shallow lagoonal terrace. Habitat D and E occurred at sites with all levels of exposure ranging from bay, semi-protected inner complex, open seas and fully exposed to trade winds and oceanic conditions.
Linking fish functional groups to benthic habitats
RELATIVE ABUNDANCE
A total of 145 fish species were counted, excluding Balistidae and Pomacanthidae that were counted at a family level. ANOSIM results of the fish functional groups across the identified benthic habitats showed significant differences despite the low Global R (R = 0.091, P = 0.001). Pair-wise habitat comparisons revealed significant differences in fish functional group composition, though with low R values (R < 0.32). Habitat B differed from habitats A, D and E while habitat E differed significantly from habitat C.
SIMPER analysis of fish functional groups based on a cut-off of 90% contribution, showed habitats B and C had a better within-habitat average similarity of fish functional groups compared with the other habitats. Detritivores and invertivores were the typical fish functional groups in habitats A, B and C, both functional groups cumulatively contributing to the within-similarity of 33.2, 52.4 and 48.2% respectively (Table 4). Grazers and detritivores typified habitat D contributing 19.3 and 16.9% correspondingly. Higher abundance of planktivores and grazers characterized habitat E, together contributing 45.9% of the similarity.
Table 4. SIMPER analysis of relative abundance of fish functional groups from coral reefs in the Western Indian Ocean contributing about 90% similarity within habitats A, B, C, D and E. Description of habitat types is found in Table 2.
Abundances of piscivores, invertivores, corallivores, planktivores, detritivores, small excavators, browsers and grazers showed significant differences across the five habitats (P < 0.05, Figure 3). However, pair-wise comparisons of the relative abundance within the habitat types disclosed differences in only six fish functional groups. Detritivores were more abundant in habitat B than in A, while grazers were more abundant in habitats B and E, than in habitat C. Corallivores and invertivores were higher in abundance in habitats B and C, than in E. Invertivores were also lower in abundance in habitat A in comparison to B. Highly diverse benthic habitats (B and C) were generally associated with higher relative abundances of corallivores, invertivores, detritivores and grazers. Conversely, planktivores were lower in abundance in habitat B than in E. Small excavators were also lower in abundance in habitat B than in A and C. The fish functional groups contributing most to the within-habitat similarity as shown in Table 4, corroborated these multiple comparison results.
Fig. 3. Boxplots showing median relative abundance of 12 fish functional groups by habitats from coral reefs in the Western Indian Ocean. Number of fish transects per habitat were A (N = 55), B (N = 29), C (N = 13), D (N = 23) and E (N = 23). Habitats with the identical lowercase letters are not significantly different based on Kruskal–Wallis post-hoc test. Open dots indicate outliers. Note different scales along y-axis. Descriptions of the five habitats A to E are given in Table 3.
FUNCTIONAL DIVERSITY
Shannon–Wiener diversity of fish functional groups was similar across habitats (P > 0.05). However, the evenness (J’) of fish functional groups across habitats differed significantly (Kruskal–Wallis χ2 = 12.48, df = 4, P = 0.014). Pair-wise multiple comparisons showed that J’ was higher in habitat C compared with habitat E.
BIOMASS
ANOSIM results using clustered habitats as a priori factors showed significant differences despite low Global R (R = 0.102, P = 0.004). ANOSIM pair-wise comparisons among habitats found that the biomass of the six fish functional groups was significantly different (P < 0.05), though with low R values (R < 0.30). The differences in biomass were between habitats A and B, B and D, and C and E.
Of the six functional groups analysed for differences in biomass across the habitats, only the piscivores, omnivores, browsers and small excavators were found to differ significantly in all habitats (P < 0.05). However, pairwise comparison of piscivore biomass across the five habitats did not show any significant difference (Figure 4). Omnivores were higher in biomass in habitat E compared with B. Browsers showed a higher biomass in habitat D compared with A. Small excavators were lower in biomass in habitat B than in habitats A and C.
Fig. 4. Boxplots showing median biomass of six fish functional groups by habitats from coral reefs in the Western Indian Ocean. Number of fish transects per habitat were A (N = 55), B (N = 29), C (N = 13), D (N = 23) and E (N = 23). Habitats with identical lowercase letters are not significantly different based on Kruskal–Wallis post-hoc test. Dots indicate outliers. Note different scales along y-axis and description of the five habitats A to E are given in Table 3.
DISCUSSION
Habitat environmental conditions and distribution
Healthy coral reefs are characterized by a dominance of live hard corals but due to persistent disturbances can often undergo phase-shifts to an alternate degraded state dominated by macroalgae (Bellwood et al., Reference Bellwood, Hughes, Folke and Nyström2004; Hughes et al., Reference Hughes, Rodrigues, Bellwood, Ceccarelli, Hoegh-Guldberg, McCook, Moltschaniwskyj, Pratchett, Steneck and Willis2007). Disturbances caused by overfishing, declining water quality and climate change have exacerbated the vulnerability of coral reefs to phase-shifts worldwide (Hughes, Reference Hughes1994; Chong-seng et al., Reference Chong-Seng, Mannering, Pratchett, Bellwood and Graham2012). Dominance of live hard corals in habitats A, B and C suggests a healthy state of coral reefs in sites in these clusters. In contrast, the dominance of fleshy algae in habitat D may indicate sites where a coral-algal phase shift has occurred through, for example, eutrophication or coral mortality from bleaching (Obura et al., Reference Obura, Di Carlo, Rabearisoa and Oliver2011). Coral mortality from bleaching may also explain the dominance of turf algae in habitat E, but with no fleshy algae and the presence of calcareous algae this habitat is not indicative of a phase-shift. If the balance between corals and algae is taken to indicate level of disturbance, reefs in central Tanzania and Mozambique exhibit habitats that are either in a low (habitat A) or high (habitats D and E) state of disturbance. Presence of habitat types B and C may indicate more variable substrate (near mangroves and sand) and oceanic conditions less conducive to hard coral growth and/or an intermediate state of disturbance. The intermediate state of disturbance is supported by the high benthic diversity and relatively high rubble cover, which at a low level is an indicator of previous natural disturbance such as storms, but at a high level can indicate extreme disturbance caused by dynamite fishing or mortality and collapse of corals after bleaching (Obura & Grimsditch, Reference Obura and Grimsditch2009; Wells, Reference Wells2009). Habitat C, which had more than double the cover of soft coral than any other habitat, was only present in northern Madagascar, possibly caused by nutrient loads from freshwater runoff from land (Obura et al., Reference Obura, Di Carlo, Rabearisoa and Oliver2011), though the small sample size (N = 3 sites), limits further deductions on this substrate type. Notably, the other four habitat types were well represented across a large number of highly variable sites, which spanned different reef typologies, depths and exposure to oceanic conditions. This provides strong support for the categorizing of these WIO reefs by habitat type.
Fish functional groups and habitats association
A wide variety of biological factors encompassing recruitment, competition, predation, availability of preferred food and shelter affect the abundance and spatial patterns of reef fishes (Choat & Ayling, Reference Choat and Ayling1987; Roberts & Ormond, Reference Roberts and Ormond1987; Doherty and Williams, Reference Doherty and Williams1988; Turner & Mittelbach, Reference Turner and Mittelbach1990; Hixon & Jones, Reference Hixon and Jones2005; White & Warner, Reference White and Warner2007; Chesson & Kuang, Reference Chesson and Kuang2008). On the other hand, depth and exposure of reefs to currents are among the abiotic factors that may also influence the abundance of reef fishes (Khalaf & Kochzius, Reference Khalaf and Kochzius2002a). High variability in estimates of fish abundance from UVC surveys is therefore inevitable (Samoilys & Carlos Reference Samoilys and Carlos2000) and was partially addressed in this study through high replication at the site level and at the reef type level. Despite the high variability in fish abundance our study found that six functional groups differed significantly with benthic composition, which we illustrate diagrammatically (Figure 5). For example, comparing habitats A and B shows higher abundance of herbivorous small excavators associated with higher hard coral in Habitat A and an increased abundance of corallivores, detritivores, invertivores and herbivorous grazers in the higher cover of rubble and lower cover of soft corals in habitat B. The higher cover of soft corals in habitat C is linked to a higher abundance of corallivores, invertivores and herbivorous small excavators. The significantly higher cover of fleshy algae in habitat D is associated with no increase in abundance of any functional group. The highest cover of turf algae and CCA seen in habitat E is associated with an increased abundance of planktivores and herbivorous grazers. From this diagrammatic representation, four hypotheses are generated which require further experimental research to determine the directionality of the relationship: (1) an increase in the cover of rubble coupled with a reduction in soft corals will lead to an increase in abundance of detritivores; (2) moderate cover of hard coral and/or soft corals attracts a higher abundance of corallivores and invertivores; (3) presence of a high cover of turf algae and CCA correlates with high abundance of planktivores; and (4) herbivorous fish functional groups are not correlated with habitats dominated by fleshy algae.
Fig. 5. Diagrammatic representation of the link between the cover of benthic composition of five habitats and relative abundance of fish functional groups from coral reefs in the Western Indian Ocean. The size of the boxes is proportional to the cover and relative abundance of benthic variables and fish functional groups. Bolded boxes represent: benthic variable(s) contributing most to within habitat similarity or a fish functional group found to be higher in the habitat as compared with other habitats. Herbivores constituted six functional groups (see Table 2) and only those significantly higher in abundance are provided. Sm-Ex = small excavators.
RUBBLE SUBSTRATE AND DETRITIVORES
Substrate type is an important component shaping fish communities with rubble providing an important substrate for the recruitment and successive growth of many sessile invertebrates (Duckworth & Wolff, Reference Duckworth and Wolff2011). Our study showed that detritivores contributed the most to the within-habitat similarity of habitat B, which had the highest cover of rubble. The to and fro movement of water due to wave action can move and overturn rubble creating turbulence that churns out settled detritus, which is an important food source for detritivores and grazer-detritivores.
HARD CORAL SUBSTRATE, CORALLIVORES AND INVERTIVORES
Reef habitat structure provides food resources and shelter through structural complexity (Hixon, Reference Hixon and Sale1991). Studies on the link between soft coral and reef fishes are few, though the habitat is not a favourable replacement for hard corals (Syms & Jones, Reference Syms and Jones2001). Site-specific fish, such as butterfly fish, show a more positive correlation with habitat structure than species exhibiting a wide home range (Roberts & Ormond, Reference Roberts and Ormond1987). The strong positive relationship between habitat types B and C with corallivores such as the butterfly fish, which are either obligate or facultative corallivores (Choat & Ayling, Reference Choat and Ayling1987; Pratchett & Berumen, Reference Pratchett and Berumen2008), supports the theory that a high percentage of hard coral is a prerequisite for high abundances of Chaetodontidae (Reese, Reference Reese1989; Khalaf & Kochzius, Reference Khalaf and Kochzius2002b). High abundance of corallivores is indicative of a healthy coral reef (Cole et al., Reference Cole, Pratchett and Jones2008; Green & Bellwood, Reference Green and Bellwood2009). The high abundance of invertivores which feed on coral competitors may help maintain the high hard coral cover in habitats B and C.
TURF ALGAE AND PLANKTIVORES
Planktivores were negatively associated with high benthic diversity. Planktivores included fishes that feed on demersal zooplankton from coral reefs (e.g. Acanthurus mata) and pelagic zooplankton transported oceanically (e.g. Caesio spp., Hemitaurichthys zoster and Heniochus diphreutes) (Froese & Pauly, Reference Froese and Pauly2012). Planktivores feeding on pelagic planktonic food would only depend on the reef for provision of shelter, and can still survive on the relatively degraded reefs of habitat E. Through experiments, planktivores have also been shown to avoid predators (mainly piscivores) by exhibiting behavioural activities including shifting habitat use, changing diel activity patterns or reducing movement (Turner & Mittelbach, Reference Turner and Mittelbach1990). This implies that if the structure of degraded coral reef habitats is still intact, planktivores that feed on both pelagic and reef plankton can persist.
ALGAE HABITATS AND HERBIVOROUS FISHES
Herbivorous fishes are predominant consumers of benthic algae and hence substantially affect the abundance and distribution of algae (Hixon, Reference Hixon and Birkeland1997). The highly degraded habitat D reflecting a phase shift from coral to macro-algae, showed no linkage with the abundance of herbivorous fishes; in contrast the semi-degraded habitat E with high turf algae did show a linkage with herbivorous grazers. The strong correlation of grazers to habitat E may be driven by availability of food. Fishing pressure may also have removed the herbivores constricting more linkages with the two algal habitats (Russ, Reference Russ2003). Indeed experimental research has demonstrated dominance of turf and fleshy algae after exclusion of herbivores (Burkepile & Hay, Reference Burkepile and Hay2006). Further, algal habitats tend to be ecologically homogeneous and undesirable by other functional groups such as obligate corallivores (Chong-Seng et al., Reference Chong-Seng, Mannering, Pratchett, Bellwood and Graham2012) hence reducing competition and allowing grazers to increase. The two algal habitats thus show differential linkages with herbivorous fishes, which suggest these functional groups prefer turf algae habitats to macro-algae.
Benthic habitats and biomass of functional groups
The highest mean biomass of all functional groups combined was associated with specific habitat types: 866 kg ha−1 in habitat D and 745 kg ha−1 in habitat E. Omnivores feed on highly diverse diets and their biomass can be high in semi-degraded habitats like habitat E. The high biomass of browsers in habitat D likely relates to the importance of fleshy algae for providing shelter for reproduction and resting for adult reef fishes (Vroom et al., Reference Vroom, Page, Kenyon and Brainard2006). Nevertheless, the role browsers play in fleshy-algae dominated habitats is still poorly understood (Chong-Seng et al., Reference Chong-Seng, Mannering, Pratchett, Bellwood and Graham2012).
Fishing and large-bodied functional groups
Marine ecosystems are some of the most heavily exploited and continue to deteriorate due to increasing fishing pressure (Worm et al., Reference Worm, Barbier, Beaumont, Duffy, Folke, Halpern, Jackson, Lotze, Micheli and Palumbi2006). Fisheries target fish at higher trophic levels and after being overfished, shift to those of lower trophic levels (Pauly et al., Reference Pauly, Christensen, Dalsgaard, Froese and Torres1998). In the WIO fishing pressure may be masking habitat associations with piscivores and large excavators. Lack of habitat association was also evident in the Seychelles (Chong-Seng et al., Reference Chong-Seng, Mannering, Pratchett, Bellwood and Graham2012), and may denote high fishing pressure in all identified habitats (Samoilys & Randriamanantsoa, Reference Samoilys, Randriamanantsoa, Obura, Di Carlo, Rabearisoa and Oliver2011). Removal of fish from the marine environment at rates that cannot be sustained by natural recruitment will significantly alter the habitat-fish association (Coll et al., Reference Coll, Libralato, Tudela, Palomera and Pranovi2008).
Summary of key findings
We show that reef habitat types relate to broad geographic patterns of reefs in the WIO. Overlaid is evidence of natural disturbance and anthropogenic impacts. In turn these habitat types show relationships with fish functional groups with key groups showing clear associations with particular habitat types. Such information can help focus conservation planning by targeting efforts to priority reefs that support diverse habitat types and diverse fish communities (Roberts et al., Reference Roberts, McClean, Veron, Hawkins, Allen, McAllister, Mittermeier, Schueler, Spalding, Wells, Vynne and Werner2002; Pittman et al., Reference Pittman, Caldow, Hile and Monaco2007). Focusing conservation on reefs that support high abundances of herbivores is also important since such reefs are likely to be more resilient in the long term (Bellwood et al., Reference Bellwood, Hughes, Folke and Nyström2004). Management measures geared towards maintenance of a high diversity and biomass of fishery species will also make important contributions towards poverty alleviation and food security in the WIO countries (Allison et al., Reference Allison, Perry, Badjeck, Adger, Brown, Conway, Halls, Pilling, Reynolds, Andrew and Dulvy2009). Given the importance of the association between habitats and fish functional groups strategic management and protection through area closures continues to be an essential approach for the WIO.
ACKNOWLEDGEMENTS
We thank the institutions and foundations that have made our work possible: Western Indian Ocean Marine Science Association (WIOMSA) for funding fieldwork through the Marine Science for Management (MASMA) programme grant number MASMA/OR/2008/05; Vlaamse Interuniversitaire Raad – Universitaire Ontwikkelingssamenwerking (VLIR-UOS) for a scholarship to K.O. under the framework of the programme ‘Master of Marine and Lacustrine Science and Management’ at the Universiteit Antwerpen, Vrije Universiteit Brussel and Universiteit Gent (Belgium; www.oceansandlakes.be); the competent authorities for permits; Majambo Jarumani for assisting in creating the map.