INTRODUCTION
As primary producers, phytoplankton play crucial roles in marine food webs, biogeochemical cycles and carbon sequestration. The current trend of increasing sea surface temperature and acidification, caused by global warming, have greatly altered the phytoplankton composition, size spectrum and primary productivity in the oceans (Dutkiewicz et al., Reference Dutkiewicz, Morris, Follows, Scott, Levitan, Dyhrman and Berman-Frank2015). Irrespective of evolutionary response, by the end of this century, phytoplankton diversity in tropical waters will have declined by one third, coinciding with shrinking species ranges and poleward expansion (Thomas et al., Reference Thomas, Kremer, Klausmeier and Litchman2012). In the past four decades, phytoplankton biomass and size structure have dramatically changed off the West Antarctic Peninsula due to regional climate change, with a 12% reduction in surface chlorophyll-a during austral summer and high latitude distribution (Montes-Hugo et al., Reference Montes-Hugo, Doney, Ducklow, Fraser, Martinson, Stammerjohn and Schofield2009). However, recent findings showed an absence of regional warming since the late 1990s in the northern Antarctic Peninsula and the northern part of the Weddell Sea, where the annual mean sea ice concentration has significantly increased, due to the extreme natural internal variability of the regional atmospheric circulation (Turner et al., Reference Turner, Lu, White, King, Phillips, Hosking, Bracegirdle, Marshall, Mulvaney and Deb2016). The decadal trend on sea ice change could have potential effects on the distribution pattern of phytoplankton, e.g. species shift, abundance fluctuation, community succession and even seasonal timing of blooms (Ardyna et al., Reference Ardyna, Babin, Gosselin, Devred, Rainville and Tremblay2014). Consequently, future phytoplankton changes will affect climate feedback mechanisms, e.g. amplifying arctic warming by 20%, through biogeophysical processes (Park et al., Reference Park, Kug, Bader, Rolph and Kwon2015).
In the nano- (2–20 µm) phytoplankton realm, coccolithophores (Haptophyta) are usually considered as an important calcifying functional group, since most of them can form calcified coccoliths by calcification inside the cell (Rost & Riebesell, Reference Rost, Riebesell, Thierstein and Young2004). On a global scale, around 20% of the marine primary production (Rousseaux & Gregg, Reference Rousseaux and Gregg2014) and 20–80% of the carbonate flux (Honjo et al., Reference Honjo, Manganini, Krishfield and Francois2008) are derived from these organisms. Living coccolithophores are sensitive to environmental changes on factors such as sea surface temperature and dissolved CO2. Recent studies showed a poleward expansion of the key species Emiliania huxleyi (Winter et al., Reference Winter, Henderiks, Beaufort, Rickaby and Brown2014) and an increase in the diversity of coccolithophore assemblages by 2100 using model prediction (O'Brien et al., Reference O'Brien, Vogt and Gruber2016). However, it seems that coccolithophores are not always negatively affected by the rising temperature and CO2, since evidence from the stratigraphic record indicates that their richness and speciation rate does increase during the warmer periods over geological time (Bown et al., Reference Bown, Lees, Young, Thierstein and Young2004). Additionally, coccolithophores might have already been responding to rising atmospheric CO2 partial pressures, as both laboratory measurements and filed observations demonstrate marked increase in calcification and coccolith mass at elevated CO2 conditions (Iglesias-Rodriguez et al., Reference Iglesias-Rodriguez, Halloran, Rickaby, Hall, Colmenero-Hidalgo, Gittins, Green, Tyrrell, Gibbs, von Dassow, Rehm, Armbrust and Boessenkool2008; Beaufort et al., Reference Beaufort, Probert, de Garidel-Thoron, Bendif, Ruiz-Pino, Metzl, Goyet, Buchet, Coupel, Grelaud, Rost, Rickaby and de Vargas2011), which contradicts with the previous research (Riebesell et al., Reference Riebesell, Zondervan, Rost, Tortell, Zeebe and Morel2000).
Parmales (Bolidophyceae) are a group of marine siliceous phytoplankton (Ichinomiya et al., Reference Ichinomiya, Dos Santos, Gourvil, Yoshikawa, Kamiya, Ohki, Audic, De Vargas, Noël, Vaulot and Kuwata2016), which are rare and often overlooked during sample checking because of the high latitude distribution and small cell size (2–5 µm). Parmales were first observed in the mid-1970s (Iwai & Nishida, Reference Iwai and Nishida1976) and were originally recognized as cyst-like particles (Silver et al., Reference Silver, Mitchell and Ringo1980) before their final confirmation as phytoplankton in the sectioned samples (Marchant & McEldowney, Reference Marchant and McEldowney1986). Although Parmales have been recorded in tropical waters (Kosman et al., Reference Kosman, Thomsen and Østergaard1993; Bravo-Sierra & Hernández-Becerril, Reference Bravo-Sierra and Hernández-Becerril2003), they are abundant in polar and subpolar waters and can form high cell abundances in spring before sinking to the pycnocline in summer (Konno & Jordan, Reference Konno and Jordan2012). Parmalean species, closely related to diatoms phylogenetically (Guillou et al., Reference Guillou, Chrétiennot-Dinet, Medlin, Claustre, Loiseaux-de-Goër and Vaulot1999), can be discriminated by the shape and size of their silica plates (Booth & Marchant, Reference Booth and Marchant1987). However, the correct configuration of the silica plates was not realized until illustrations of collapsed cell walls were re-examined, and the plate terminology subsequently emended (Konno & Jordan, Reference Konno and Jordan2007).
Based on a four-month fishing trawl in the Atlantic Ocean and off the Antarctic Peninsula in 2014, we studied the biogeographic distributions of assemblages of coccolithophores and Parmales. By multivariate analysis, we found that the latitudinal patterns of these two groups of nanoplankton were primarily linked to the temperature gradient. Also, three major assemblages, being intimately associated with the oceanic provinces, were distinguished in the study region. Since the large-scale distribution of nanoplankton, especially of the microscopic Parmales, has been rarely reported in the Atlantic Ocean, this study provides species-level information on these organisms, which could be of great value to biogeochemical research and help modellers to more accurately predict future climate change.
MATERIALS AND METHODS
Sample collection
A total of 71 samples were collected by the trawler LongTeng in the Atlantic Ocean (ATO) during 28 May to 5 October 2014 (Figure 1A). The study area covers many oceanic provinces: NATR (North Atlantic Tropical Gyral Province), WTRA (Western Tropical Atlantic Province), SATL (South Atlantic Gyral Province), FKLD (Falklands Plateau and Argentine Shelf Province) and the Southern Ocean (SO) comprising SSTC, SANT, ANTA and APLR (Longhurst, Reference Longhurst2007). In this study, the sampling sites at 1–12, 13–38 and 39–71 were located in the FKLD, SO and ATO, respectively.

Fig. 1. Sampling sites in the Atlantic Ocean. (A) Sampling locations, AP, Antarctic Peninsula; SSI, South Shetland Islands; SOI, South Orkney Islands; SGI, South Georgia Island; FI, Falkland Islands; CVI, Cape Verde Islands; CI, Canary Islands; MI, Madeira Islands; AI, Azores Islands, red fonts indicate different oceanic provinces (after Longhurst, Reference Longhurst2007); (B) Sea surface temperature, blue fonts indicate different fronts (after Peterson & Stramma, Reference Peterson and Stramma1991; Peña-Izquierdo et al., Reference Peña-Izquierdo, Pelegrí, Pastor, Castellanos, Emelianov, Gasser, Salvador and Vázquez-Domínguez2012), CVF, Cape Verde Front; BCF, Brazil Current Front; STF, Subtropical Front; SAF, Subantarctic Front; PF, Polar Front.
Surface seawater samples were collected from ship water, which was connected directly to the sea via a pipe and supplied for research use by the scientific observers on board. Sub-samples (1–2 l) were vacuum filtered through 0.6 μm pore-size isopore polycarbonate filters (Millipore Corp.) under low pressure (<100 mmHg). Each membrane with filtered particles was then transferred to a plastic Petri dish and preserved at −20°C in the freezing store until analysis. Seawater temperature and bathymetric depth were measured by sensors attached to a Fish Finder (FCV-1200LM, FURUNO).
SEM observations
In the laboratory, a piece of the filter (~0.5 cm2) was cut and attached to a stub using conductive double-sided adhesive tape, followed by coating with platinum using a magnetron sputter (MSP-1S, Shinkuu). Qualitative and quantitative analyses for coccolithophores and Parmales were performed at 4000× magnification using a tabletop scanning electron microscope (TM3000, Hitachi). Species-level taxonomy was based on the morphological characteristics of coccoliths and coccospheres for coccolithophores (Young et al., Reference Young, Geisen, Cros, Kleijne, Sprengel, Probert and Østergaard2003), and plate configurations for Parmales (Konno & Jordan, Reference Konno and Jordan2007; Konno et al., Reference Konno, Ohira, Komuro, Harada and Jordan2007). Due to smaller cell size, images of dominant Parmales were obtained with a JSM-840 (JEOL) SEM after coating with platinum using an Ion Coater (Eiko-IB3). For statistical stability, at least 500 coccoliths, coccospheres and Parmales were counted in each sample. For low abundance, a minimum of 500 random selected areas were checked. Calculations of the final abundances were carried out using the previous literature (Bollmann et al., Reference Bollmann, Cortés, Haidar, Brabec, Close, Hofmann, Palma, Tupas and Thierstein2002).
Statistical analysis
Species diversity was evaluated using the Shannon–Weaver Index (H′, Shannon & Weaver, Reference Shannon and Weaver1949) and Dominance (Y, Dufrene & Legendre, Reference Dufrene and Legendre1997). One-way ANOVA (SPSS 20.0) was performed to compare the means among the FKLD, SO and ATO. Using the program SMATR 2.0 (Warton et al., Reference Warton, Wright, Falster and Westoby2006), a model II linear regression (Geometric Mean) was applied to explore the relationship between two variables. Cluster analysis (PRIMER 6.1) was used to measure the resemblance among the samples based on Bray–Curtis similarities (Group Average) after the fourth root of the original dataset.
Canonical correspondence analysis (CCA), a constrained ordination of the unimodal method, was used to estimate how much of the variation in the species distribution (response variables) could be attributed to changes in the environments (explanatory variables). Before the CCA, a detrended correspondence analysis (DCA) was conducted to assess the lengths of gradient in species data and to make the decision between unimodal and linear methods (Lepš & Šmilauer, Reference Lepš and Šmilauer2003). Species with good species fits were selectively incorporated in the CCA, according to the percentage variance of species data explained by the first canonical axis in the ordination. Both CCA and DCA were realized in the CANOCO 4.5 software after log10(x + 1)-transformation of the species abundances and environmental parameters.
RESULTS
Sea surface temperature
During sample collection, sea surface temperature (SST) varied between −2.3 and 29.0°C, with the lowest and highest values being recorded in the adjoining waters of SOI (South Orkney Islands) and WTRA, respectively (Figure 1B). SST in the FKLD, SO and ATO were 2.7–15.0°C (mean ± SD, 8.1 ± 3.7°C), −2.3–14.8°C (1.5 ± 3.8°C) and 15.1–29.0°C (23.9 ± 4.0°C), respectively. The 40°S line clearly separated the warm and cool waters.
Species composition
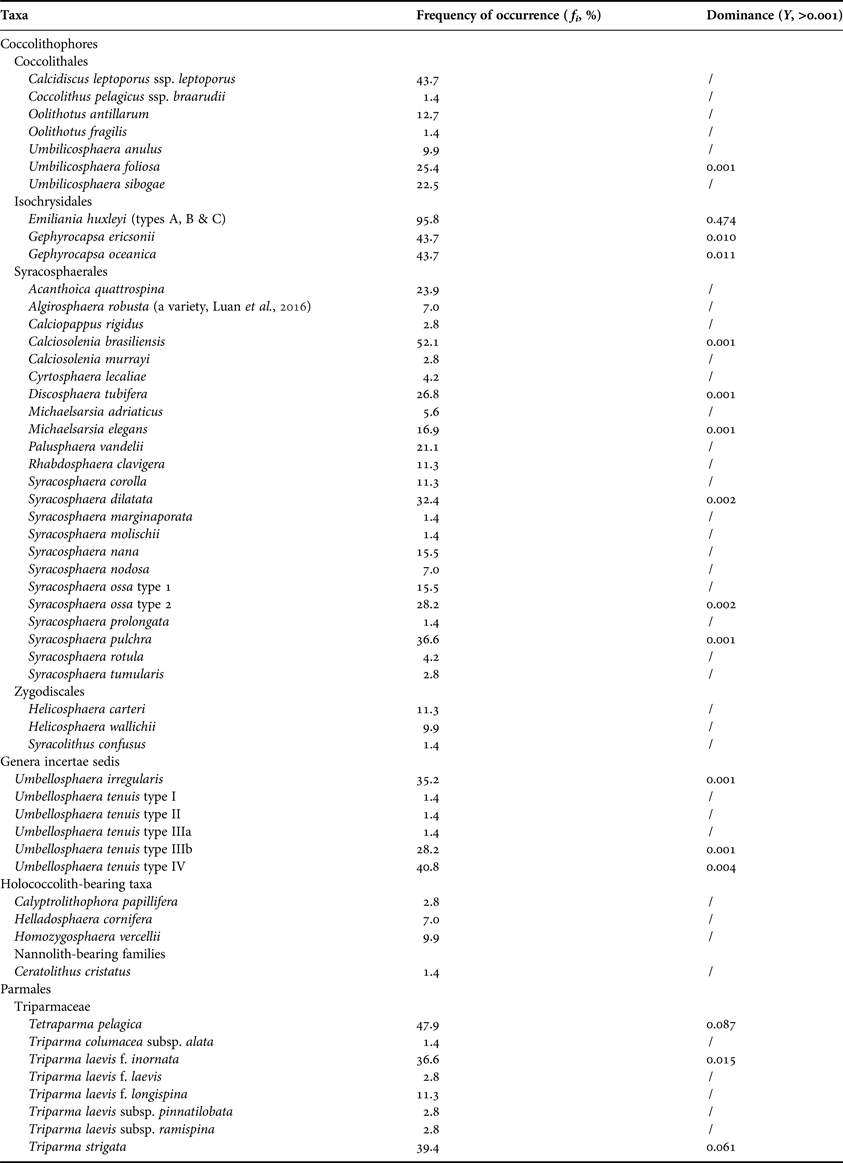
A total of 48 taxa of living coccolithophores (including two subspecies, one variety and nine forms) and eight taxa of Parmales (including three subspecies and three forms) were recorded, with 19 taxa having frequencies of occurrence greater than 20% (Table 1). Of the 71 sampling sites, coccolithophores and Parmales were present at 69 (97.2%) and 45 (63.4%) sites, respectively. The most diverse coccolithophore species were documented at Site 59 (22 taxa), which was located in the tropical equatorial waters (Figure 2A). In contrast, the maximum number of parmalean species occurred in the cool SO waters at Site 32 (six taxa).

Fig. 2. Latitudinal distributions of coccolithophores and Parmales in the Atlantic Ocean.
Table 1. Taxonomic list of living coccolithophores and Parmales in the surface waters of the Atlantic Ocean, 2014.
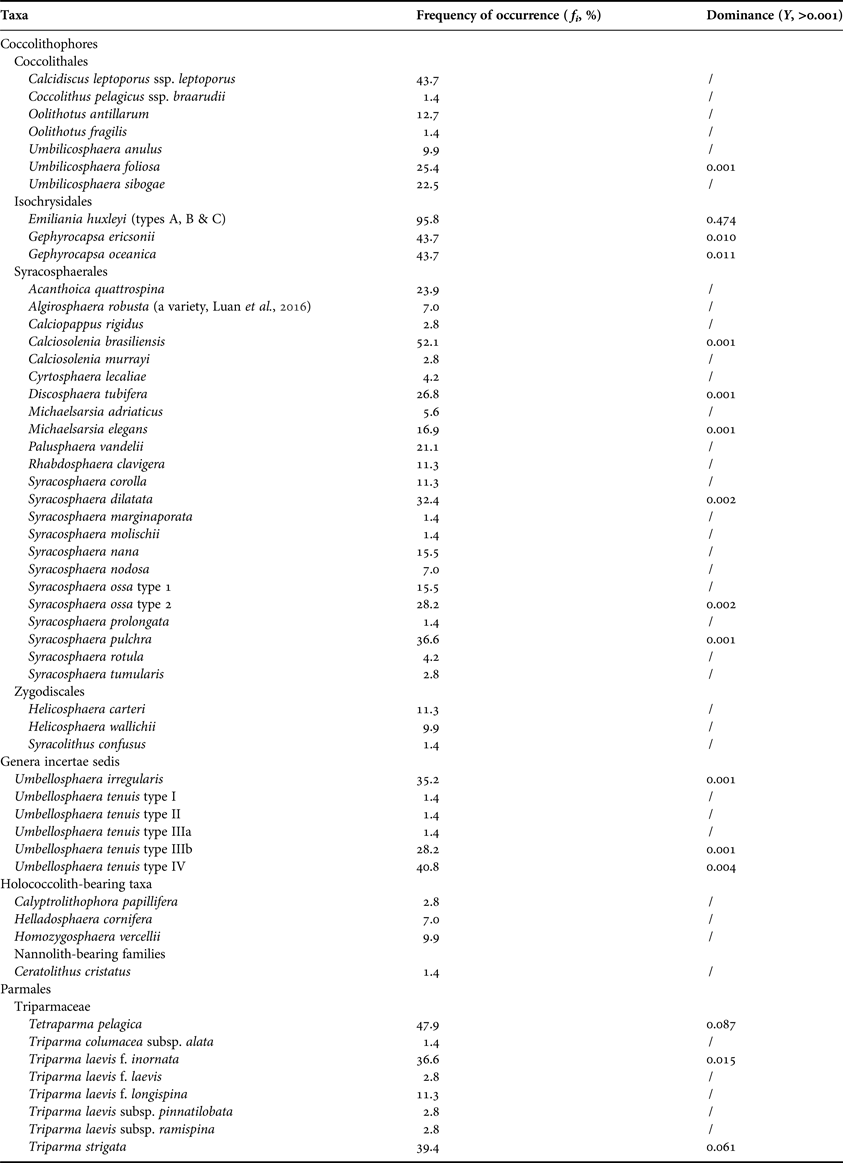
In the coccolithophore assemblages, the Order Syracosphaerales represented the largest group (23 taxa), with 12 taxa belonging to the Genus Syracosphaera. The dominant species were Emiliania huxleyi, Gephyrocapsa oceanica and Gephyrocapsa ericsonii, with the Dominance (Y) of 0.474, 0.011 and 0.010, respectively. Three forms of E. huxleyi (types A, B and C) and five forms of Umbellosphaera tenuis (types I, II, IIIa, IIIb and IV) existed in the surveyed waters (Figure 3A–I). It is noteworthy that the body coccoliths of Algirosphaera robusta in this study (Sites 39–41, 47 and 52) exhibited an unusual morphology with incomplete hoods, which had been previously recorded in the Yellow and East China Seas (see Figure 3 in Luan et al., Reference Luan, Liu, Zhou and Wang2016). As for the Parmales assemblages, Triparma laevis was the most diverse species (five taxa), while Tetraparma pelagica, Triparma strigata and Triparma laevis f. inornata represented the dominant species (Figure 3J–L), in light of Y values of 0.087, 0.061 and 0.015, respectively.

Fig. 3. Different morphotypes of coccolithophore species and dominant parmalean species in surveyed waters. (A) Emiliania huxleyi type A; (B) E. huxleyi type B; (C) E. huxleyi type C; (D) Umbellosphaera tenuis type I; (E) U. tenuis type II; (F) U. tenuis type IIIa; (G) U. tenuis type IIIb; (H) U. tenuis type IV (coccosphere); (I) U. tenuis type IV (coccolith); (J) Tetraparma pelagica; (K) Triparma strigata; (L) Triparma laevis f. inornata. Scale bars = 1 µm.
Coccolithophore abundance
During the survey, the cell abundance of living coccolithophores ranged from absent at the far south Site 16 (60°S), to the maximum of 375.9 × 10³ cells l−1 at Site 35 north-east of the FI (Falkland Islands), averaging 71.4 × 10³ cells l−1. The average cell abundances in the FKLD, SO and ATO were 62.2 × 10³ cells l−1, 87.5 × 10³ cells l−1 and 67.9 × 10³ cells l−1, with no marked differences between any two of them (after ANOVA).
The species E. huxleyi was widespread in the surveyed waters (Figure 2C), and was predominant in the assemblages at most of the sampling sites. Its cell abundance varied between absent and 375.8 × 10³ cells l−1 (on average 59.4 × 10³ cells l−1), accounting for an average of 75.4% of the total coccolithophores. The average E. huxleyi abundances in the FKLD, SO and ATO were 57.7 × 10³ cells l−1, 86.8 × 10³ cells l−1 and 38.5 × 10³ cells l−1, with a significant difference between the SO and ATO (P < 0.05). The combined abundance of Gephyrocapsa taxa varied between absent and 213 × 103 cells l−1 (on average 5.7 × 10³ cells l−1), with the maximum at Site 69 in the Cape Verde Front (CVF) zone, and accounting for an average of 9.6% of the total. The average Gephyrocapsa abundances were 3.1 × 10³ cells l−1, 0.17 × 10³ cells l−1 and 11.0 × 10³ cells l−1 in the FKLD, SO and ATO, respectively.
Parmales abundance
The Parmales assemblages mainly inhabited the SO waters (Figure 2D), with an average cell abundance of 46.0 × 10³ cells l−1 during the survey, ranging from absent to a maximum of 624 × 103 cells l−1 at Site 27 adjacent to the SGI (South Georgia Island). The average abundance in the SO waters was 122 × 103 cells l−1, which was extremely high compared to that in the FKLD waters (0.52 × 10³ cells l−1, P < 0.001) and ATO waters (2.6 × 10³ cells l−1, P < 0.001). Parmales were absent in the whole WTRA, and were rare in the NATR (only being recorded at Sites 67 and 71) and SATL waters.
As for the dominant species, the average abundance of T. pelagica was 21.9 × 10³ cells l−1, with the highest value of 262 × 103 cells l−1 at Site 27, and accounting for an average of 47.2% of the total Parmales. The average T. pelagica abundance in the SO waters was 58.2 × 10³ cells l−1, in sharp contrast with 0.17 × 10³ cells l−1 in the FKLD waters (P < 0.001) and 1.2 × 10³ cells l−1 in the ATO waters (P < 0.001). The average abundance of T. strigata was 18.6 × 10³ cells l−1, with a maximum of 312 × 103 cells l−1 at Site 27, and accounting for an average of 32.6% of the total. Also, the average T. strigata abundance (49.5 × 10³ cells l−1) in the SO was significant higher than that in the FKLD (0, P < 0.01) and ATO (1.1 × 10³ cells l−1, P < 0.001). The combined abundance of T. laevis taxa was on average 5.4 × 10³ cells l−1 (max. 53.7 × 10³ cells l−1 at Site 30), with the dominant form T. laevis f. inornata at 4.8 × 10³ cells l−1 (max. 49.6 × 10³ cells l−1 at Site 30).
Biogeographic assemblages
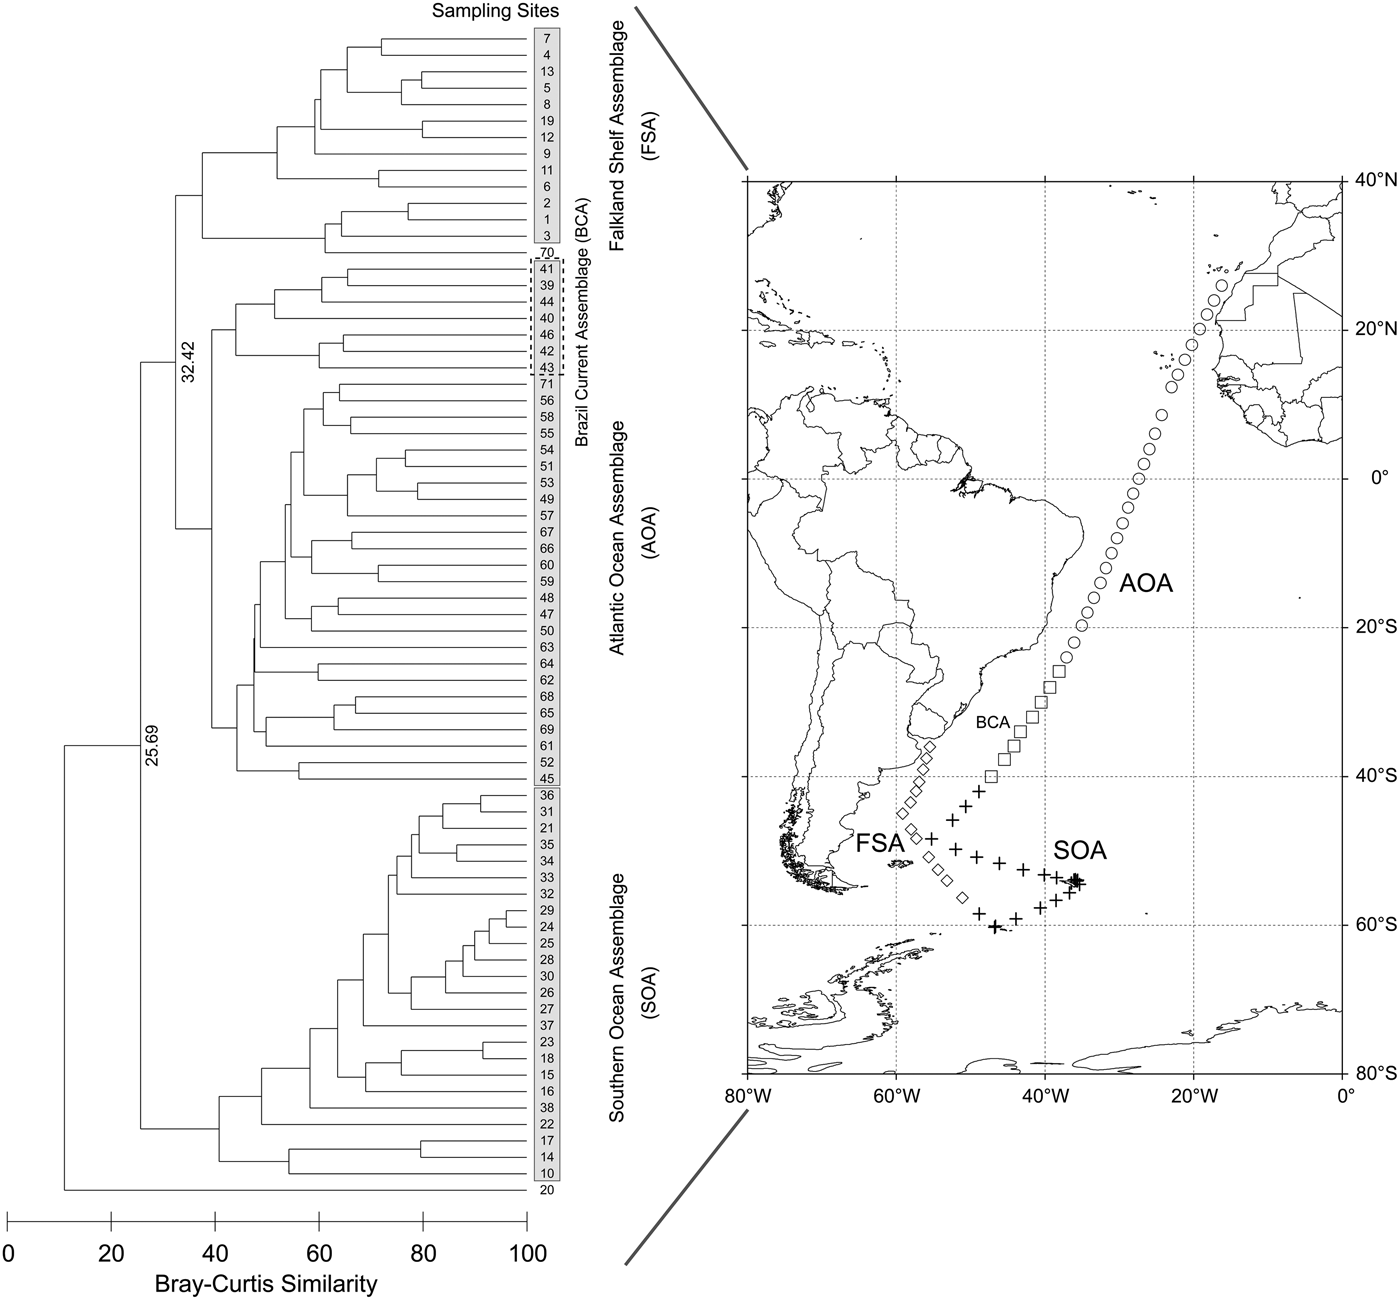
Based on the Bray–Curtis similarities of the species composition among the sampling sites, three major biogeographic assemblages were clarified on a 32.5 similarity level by cluster analysis (Figure 4). They were the Falkland Shelf Assemblage (FSA), the Southern Ocean Assemblage (SOA) and the Atlantic Ocean Assemblage (AOA). It is noteworthy that our results precisely coincided with the geographically divided oceanic provinces (Longhurst, Reference Longhurst2007). The FSA referred to the typical assemblage overlying on the Falklands plateau and Argentine shelf. Species characterizing these waters were: E. huxleyi, G. oceanica and G. ericsonii, as well as Syracosphaera dilatata and Calciosolenia brasiliensis. The SOA represented the taxa living in the cool SO waters, where the nanoplankton, in addition to E. huxleyi, were characterized by parmalean species, such as T. pelagica, T. strigata and T. laevis f. inornata. The AOA depicted the taxa living in the warm ATO waters, where the major taxa were E. huxleyi, G. oceanica and G. ericsonii, in combination with U. tenuis types IIIb and IV, Umbellosphaera irregularis, S. dilatata and Syracosphaera ossa type 2. Within the AOA, a minor group, the Brazil Current Assemblage (BCA), can be clearly distinguished. The BCA was primarily subjected to the Brazil Current Front (BCF), a convergence of the warm Brazil Current and cool Falklands Current.

Fig. 4. Biogeographic distributions of three major assemblages based on cluster analysis. Left panel: dendrogram showing the similarities among the sampling sites; Right panel: spatial locations of the assemblages.
Multivariate analysis
To clarify the species distribution of coccolithophores and Parmales in association with the ambient environment, multivariate analysis was applied in this study to distinguish how much of the variation in the species composition could be attributed to changes in the environmental factors (e.g. temperature, latitude and bathymetry). Since the DCA of the species data showed that the longest length of gradient (3.642, Table 2) was greater than 3.0, the constrained unimodal method of the CCA was appropriate for the current analysis.
Table 2. Multivariate analysis results of DCA and CCA.

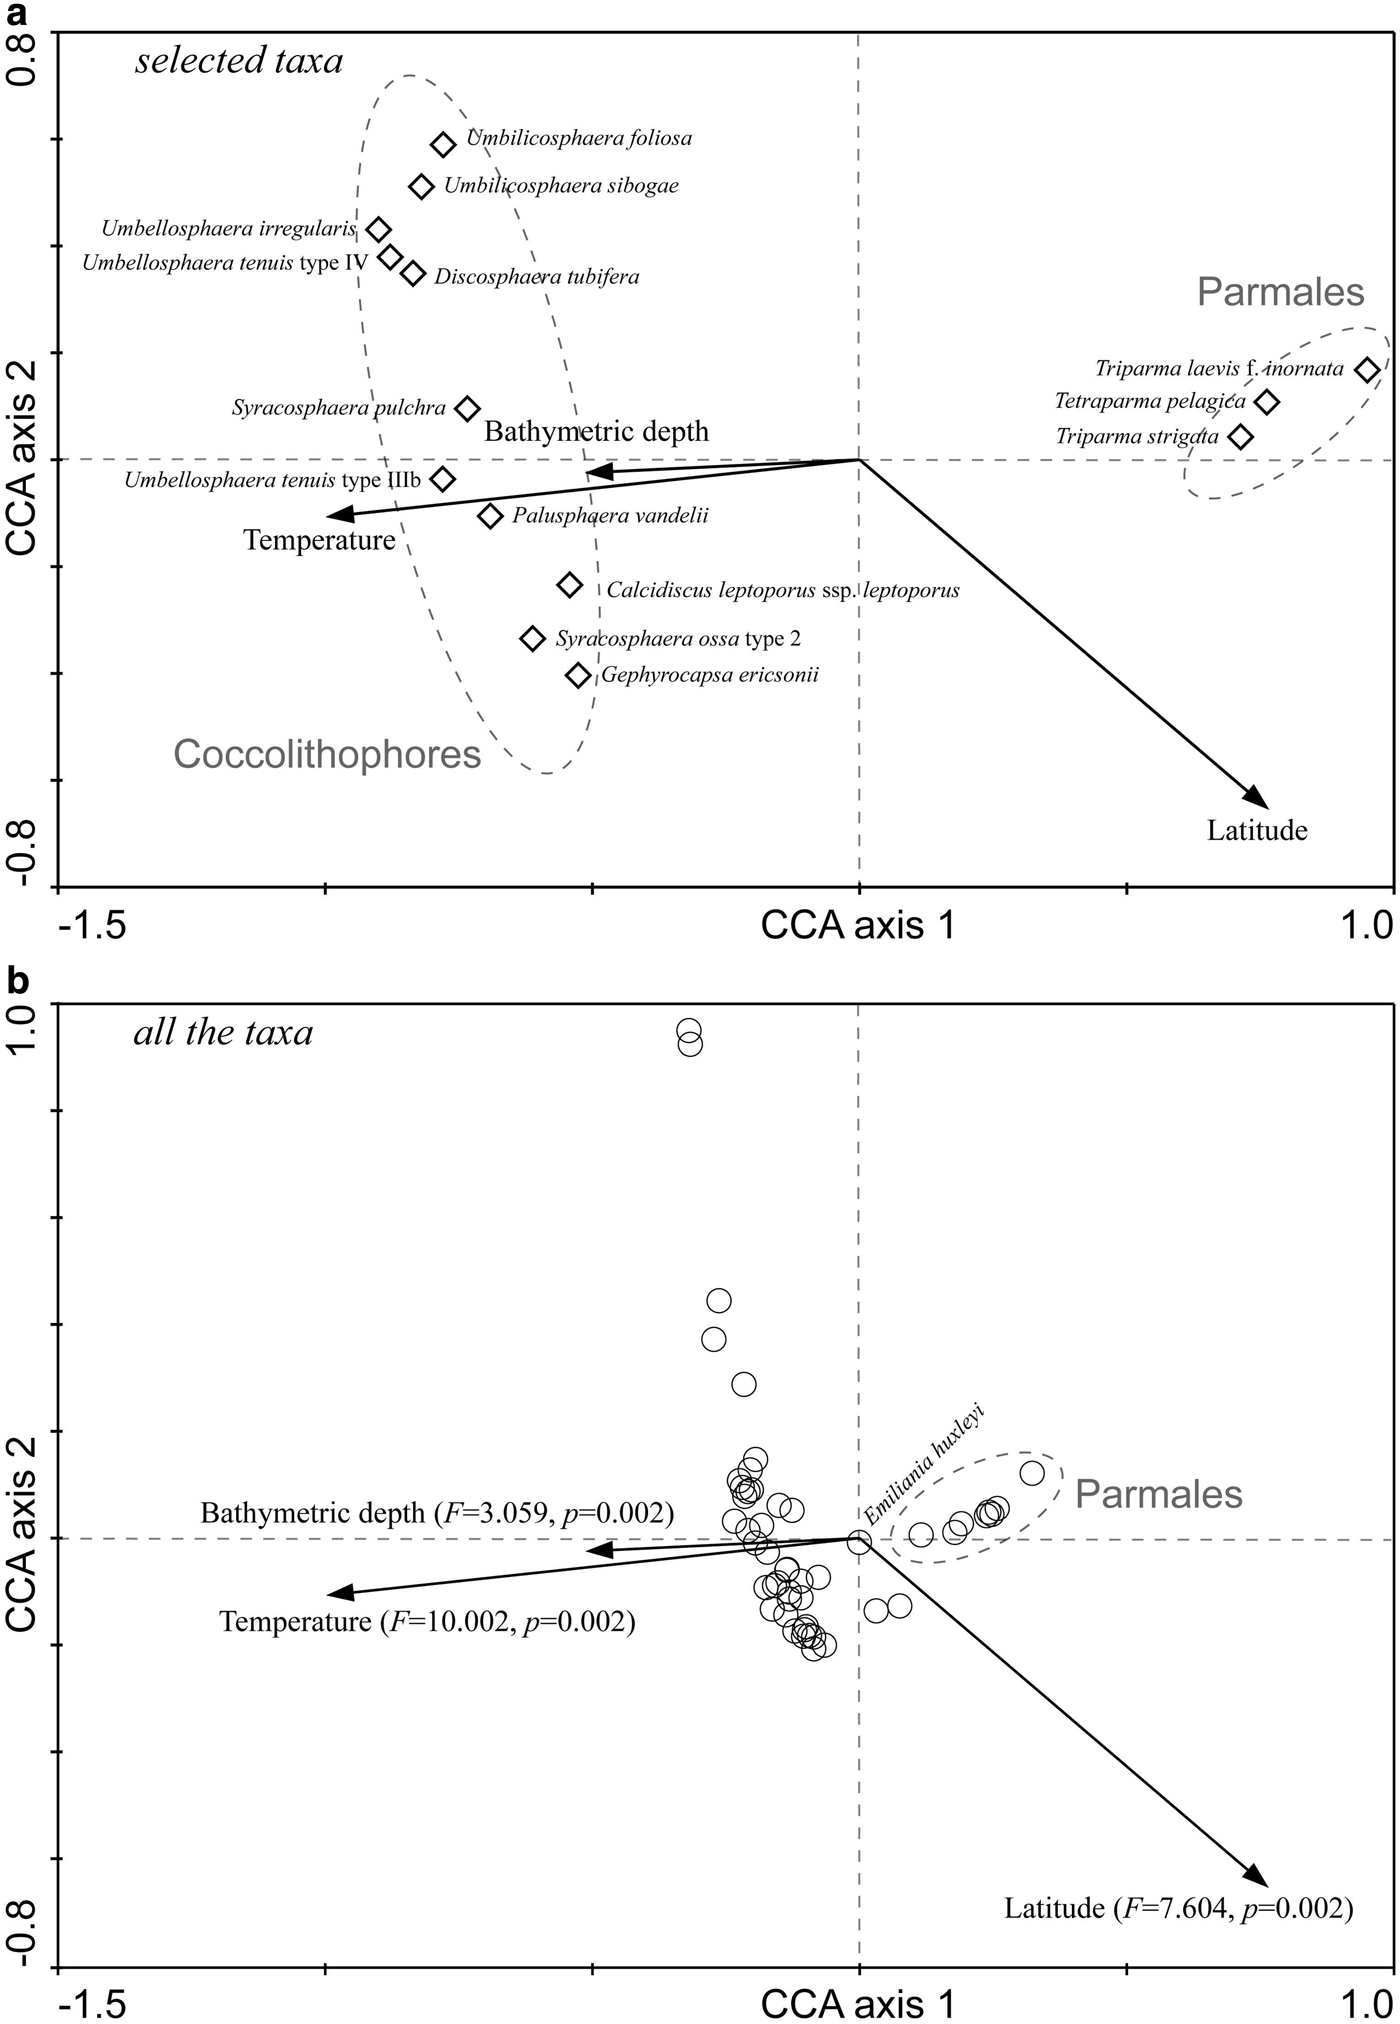
The first two canonical axes together explained 18.8% of the variance in the species data and 93.6% of the variance in the species-environment relationship, with the first axis accounting for 12.8% and 63.8%, respectively. In the ordination chart (Figure 5), living coccolithophores and Parmales clearly formed two distinct groups. The position of individual species graphically illustrated their respective niche requirements. After the Monte Carlo permutation tests of significance, the independent explanation of species variation by temperature, latitude and bottom depth reached up to 49.5% (F = 10.002, P < 0.01), 38.8% (F = 7.604, P < 0.01) and 16.6% (F = 3.059, P < 0.01), respectively, all significantly contributing to the biogeographic distributions of coccolithophores and Parmales.
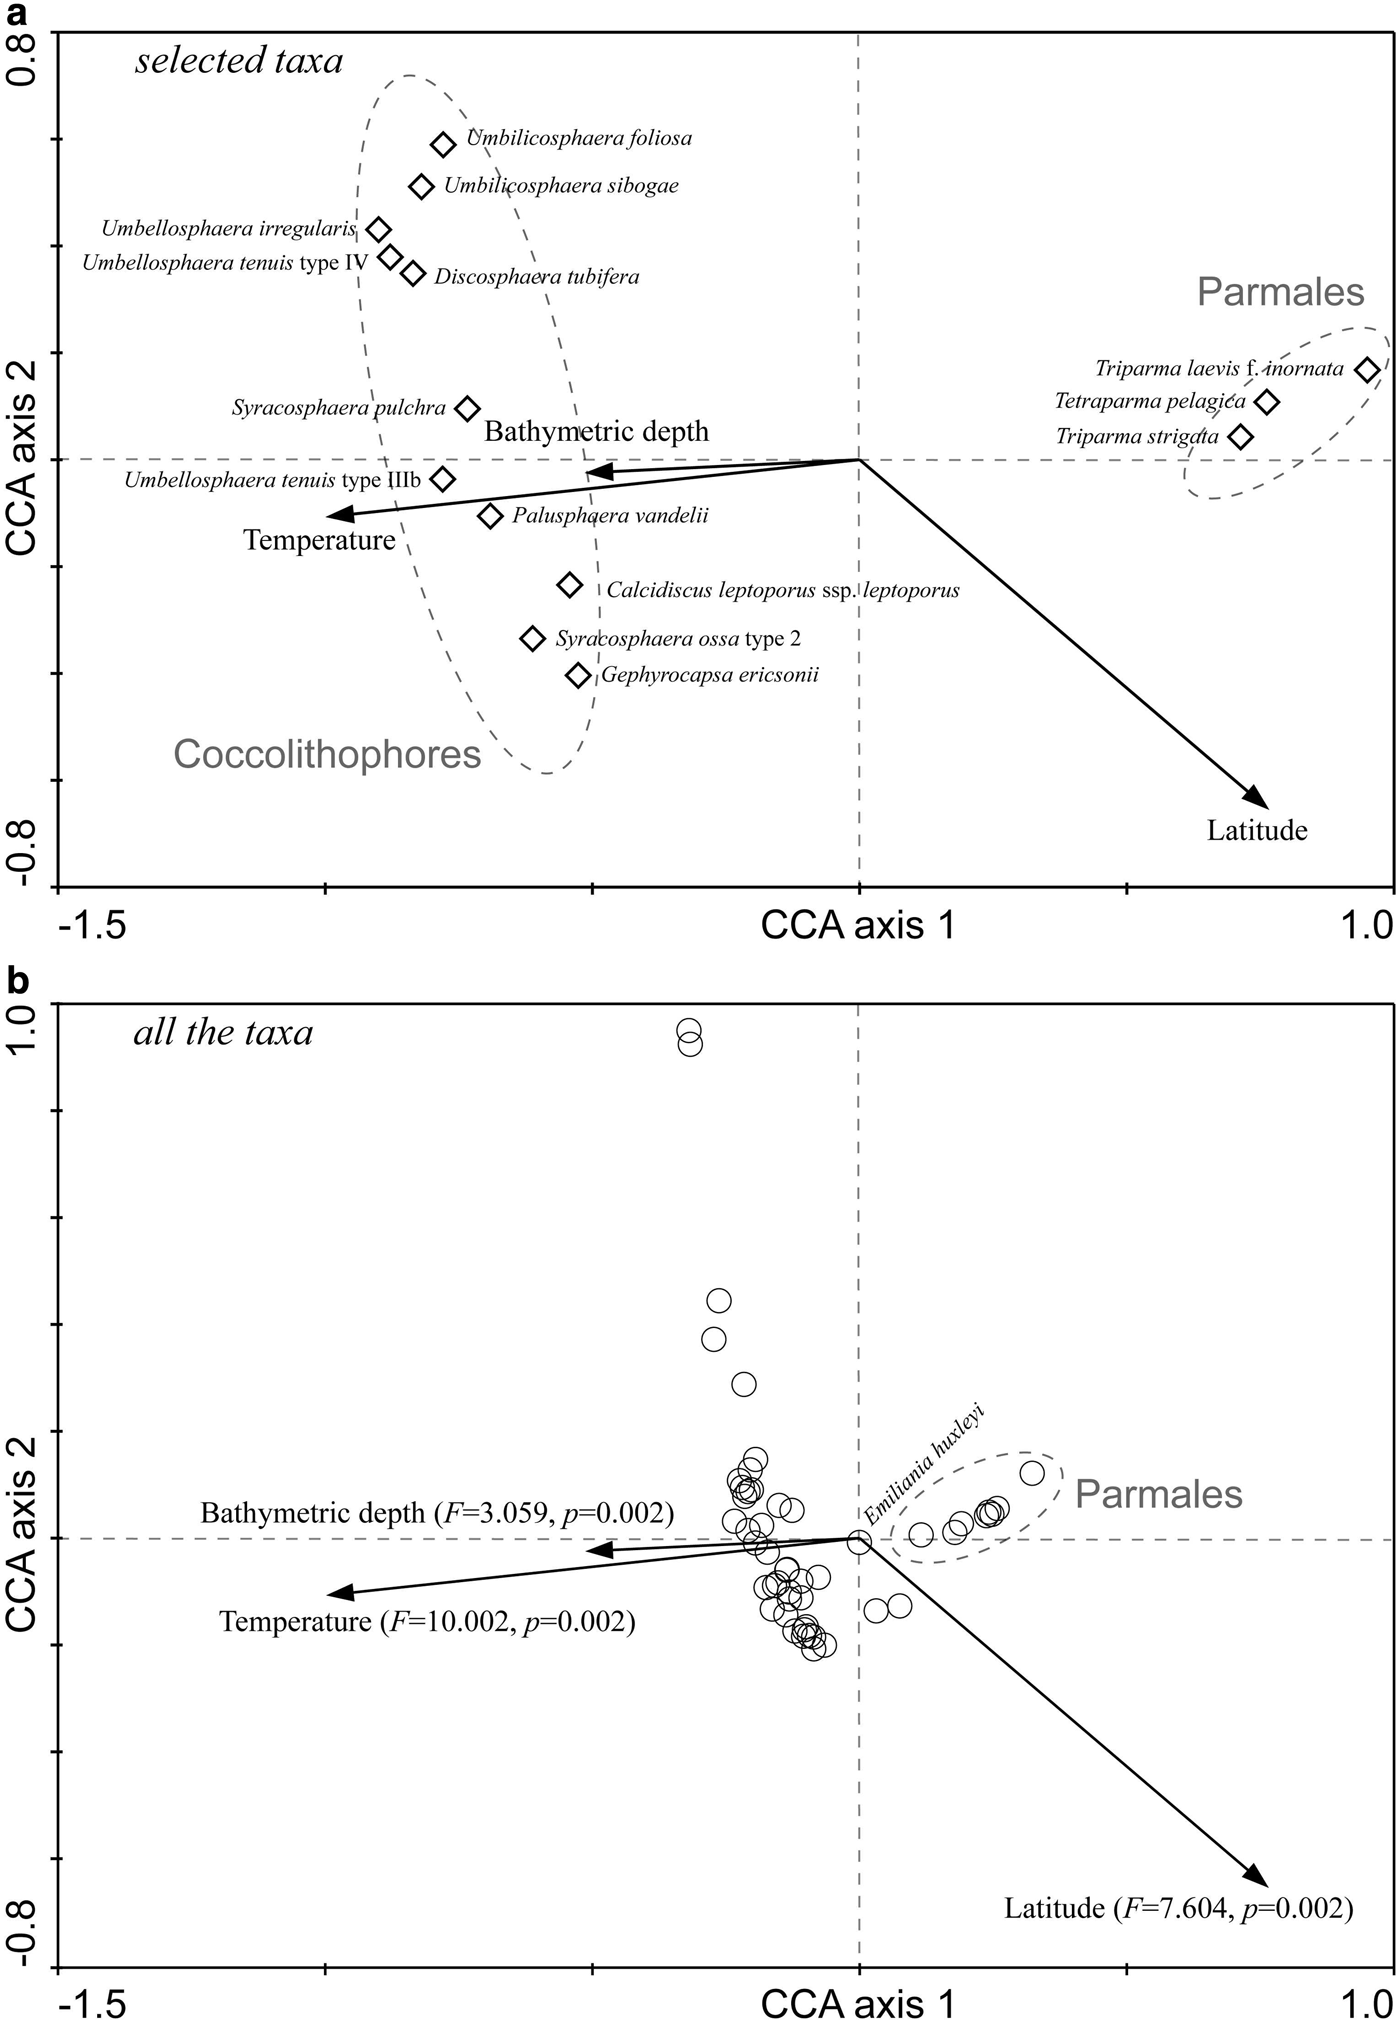
Fig. 5. CCA biplots showing the relationship between the species distribution and environmental factors. (A) Selected taxa according to the species fit; (B) All the taxa, F and P values in parentheses refer to the significance of environmental variables by Monte Carlo permutation tests under the reduced model.
DISCUSSION
Biogeographic distributions of coccolithophores and Parmales
Although coccolithophores possess a wide range of ecological tolerance (Brand, Reference Brand, Winter and Siesser1994), the biogeographic distributions of this group of nanophytoplanton are subjected to various oceanic circulations and fronts in the ATO (Peterson & Stramma, Reference Peterson and Stramma1991; Peña-Izquierdo et al., Reference Peña-Izquierdo, Pelegrí, Pastor, Castellanos, Emelianov, Gasser, Salvador and Vázquez-Domínguez2012), such as the Subtropical Front (STF), Subantarctic Front (SAF), Polar Front (PF), BCF and CVF. In the frontal waters, the average abundance could reach up to as many as 82 × 103 cells l−1 (Boeckel & Baumann, Reference Boeckel and Baumann2008). Our results illustrated that high abundances of coccolithophores occurred in the north-east waters of the FI within the Falklands Current (Figure 2C), and were exactly confined in the SAF zone. A sharp contrast in temperature was detected between Site 35 (3.3°C) and Site 36 (7.5°C). The cool and nutrient-rich Antarctic waters, being mixed with the warm and oligotrophic Subtropical Gyre waters, facilitated the high abundance of living coccolithophores. It is similar in the North Atlantic, where high abundances of G. oceanica were observed in close coupling with the CVF (Figure 1B). Under the control of cool upwelling from the Canary Current, a 5.2°C drop was measured from Site 68 (26.7°C) to Site 69 (21.5°C).
The morphotypes within a species complex usually exhibited unequal ecological affinities. Fine-scale species-level diversity has been studied in the South Atlantic waters, on species such as Calcidiscus leptoporus, E. huxleyi and U. tenuis (Boeckel & Baumann, Reference Boeckel and Baumann2008). In this study, we identified five types of U. tenuis, with types IIIb and IV as the predominant forms. Interestingly, these two morphotypes were absent in the cool and nutrient-replete waters of the FKLD and SO. On the contrary, the average abundances of U. tenuis types IIIb and IV in the ATO waters increased to 0.98 × 10³ cells l−1 and 2.8 × 10³ cells l−1, associating with high frequencies of occurrence of 60.6% and 84.8%. This observation indicated that the two morphotypes had a preference for warm and oligotrophic open waters.
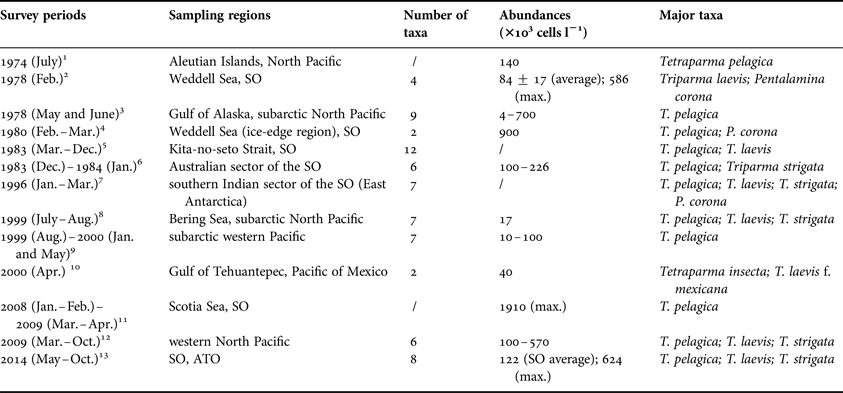
The latitudinal pattern and ecological zonation of living coccolithophores has been well established since the fundamental work in the Atlantic Ocean (McIntyre & Bé, Reference McIntyre and Bé1967). However, the biogeographic knowledge on Parmales (formerly considered to be cysts) is almost blank before their algal nature was revealed (Marchant & McEldowney, Reference Marchant and McEldowney1986). So far, a number of microscopy works were carried out in both hemispheres (Table 3), e.g. the subarctic Pacific (Nishida, Reference Nishida1979; Booth et al., Reference Booth, Lewin and Norris1980; Tanimoto et al., Reference Tanimoto, Aizawa and Jordan2003; Komuro et al., Reference Komuro, Narita, Imai, Nojiri and Jordan2005; Konno et al., Reference Konno, Ohira, Komuro, Harada and Jordan2007; Ichinomiya & Kuwata, Reference Ichinomiya and Kuwata2015), the Weddell Sea (Silver et al., Reference Silver, Mitchell and Ringo1980; Buck & Garrison, Reference Buck and Garrison1983) and the SO (Nishida, Reference Nishida1986; Waters et al., Reference Waters, van den Enden and Marchant2000; Hinz et al., Reference Hinz, Poulton, Nielsdόttir, Steigenberger, Korb, Achterberg and Bibby2012), concentrating not only on the water columns, but also on the surface sediments (Zielinski, Reference Zielinski1997). These surveys showed that the common abundance of Parmales, during both boreal and austral blooming seasons, can soar to (4–900) × 103 cells l−1, apart from a record abundance of 1910 × 103 cells l−1 in the Scotia Sea (Hinz et al., Reference Hinz, Poulton, Nielsdόttir, Steigenberger, Korb, Achterberg and Bibby2012). Of the ~20 taxa of Parmales (Konno et al., Reference Konno, Ohira, Komuro, Harada and Jordan2007), T. pelagica is the most widespread species in various oceanographic settings (Table 3), except for the tropical waters, where distinct taxa exist, such as Tetraparma insecta and T. laevis f. mexicana. It is noteworthy that Pentalamina corona (Pentalaminaceae) seems solely occurring in the coastal and ice-edge regions off the Antarctica, whereas it has not been recorded in the Pacific. Additionally, T. laevis may possess relatively big niche breadth, since many forms and subspecies have been described in diverse seawaters. Our results on Parmales in the SO were comparable to those previous reports, showing patchy distribution in the PF zone, where the Parmales were coupled with the occurrence of cool waters from the Antarctic Circumpolar Current.
Table 3. Summary of previous studies on biogeographic distributions of Parmales in distinct oceanographic settings.
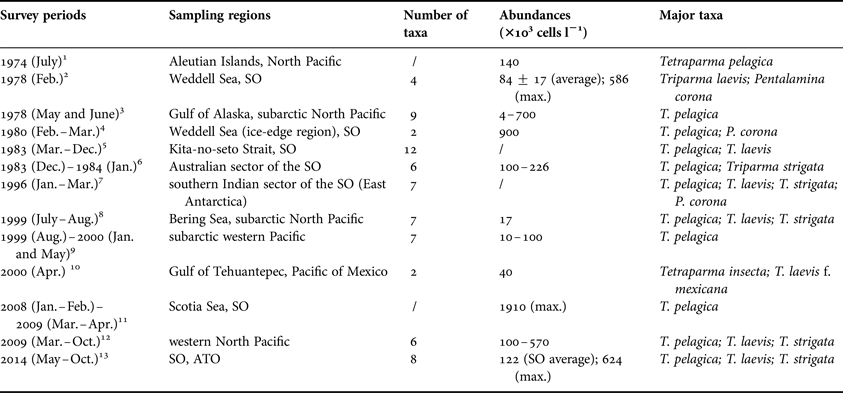
1. Nishida (Reference Nishida1979); 2. Silver et al. (Reference Silver, Mitchell and Ringo1980); 3. Booth et al. (Reference Booth, Lewin and Norris1980); 4. Buck & Garrison (Reference Buck and Garrison1983); 5. Takahashi et al. (Reference Takahashi, Watanabe and Satoh1986); 6. Nishida (Reference Nishida1986); 7. Waters et al. (Reference Waters, van den Enden and Marchant2000); 8. Tanimoto et al. (Reference Tanimoto, Aizawa and Jordan2003); 9. Komuro et al. (Reference Komuro, Narita, Imai, Nojiri and Jordan2005); 10. Bravo-Sierra & Hernández-Becerril (Reference Bravo-Sierra and Hernández-Becerril2003); 11. Hinz et al. (Reference Hinz, Poulton, Nielsdόttir, Steigenberger, Korb, Achterberg and Bibby2012); 12. Ichinomiya & Kuwata (Reference Ichinomiya and Kuwata2015); 13. this study.
Unlike the widespread distribution of coccolithophores, parmalean species seemed to be more restricted to cooler waters in higher latitudes (Figure 2B). However, metabarcoding technique also disclosed the subtropical existence of Parmales in the ATO (Ichinomiya et al., Reference Ichinomiya, Dos Santos, Gourvil, Yoshikawa, Kamiya, Ohki, Audic, De Vargas, Noël, Vaulot and Kuwata2016), which provided positive biogeographic information on these small organisms. Although in a very low level of abundance, in the present microscopy study, parmalean species were indeed observed in the subtropical waters of ATO, such as in the SATL (16 Sites) and NATR (two Sites, being affected by the cool Canary Current). This suggests the ecological adaptation of Parmales in various oceanic environments.
Temperature affects the regional patterns
Temperature is considered as an important factor in controlling the phytoplankton distribution and productivity (Thomas et al., Reference Thomas, Kremer, Klausmeier and Litchman2012). Latitudinal patterns of the thermal limits of marine phytoplankton had been revealed in a synthetic study (Chen, Reference Chen2015), which evaluated the various thermal breadths in different functional groups. As for coccolithophores and Parmales, although their abundances might be regulated by nutrient availability (Jordan, Reference Jordan and Schaechter2011) or zooplankton grazing (Urban et al., Reference Urban, McKenzie and Deibel1993), it is evident that temperature is an important determinant in driving the large-scale patterns. Just like the CCA ordination results in this study (Figure 5), coccolithophores and Parmales were exactly intersected in two distinct groups by the thermal gradient.
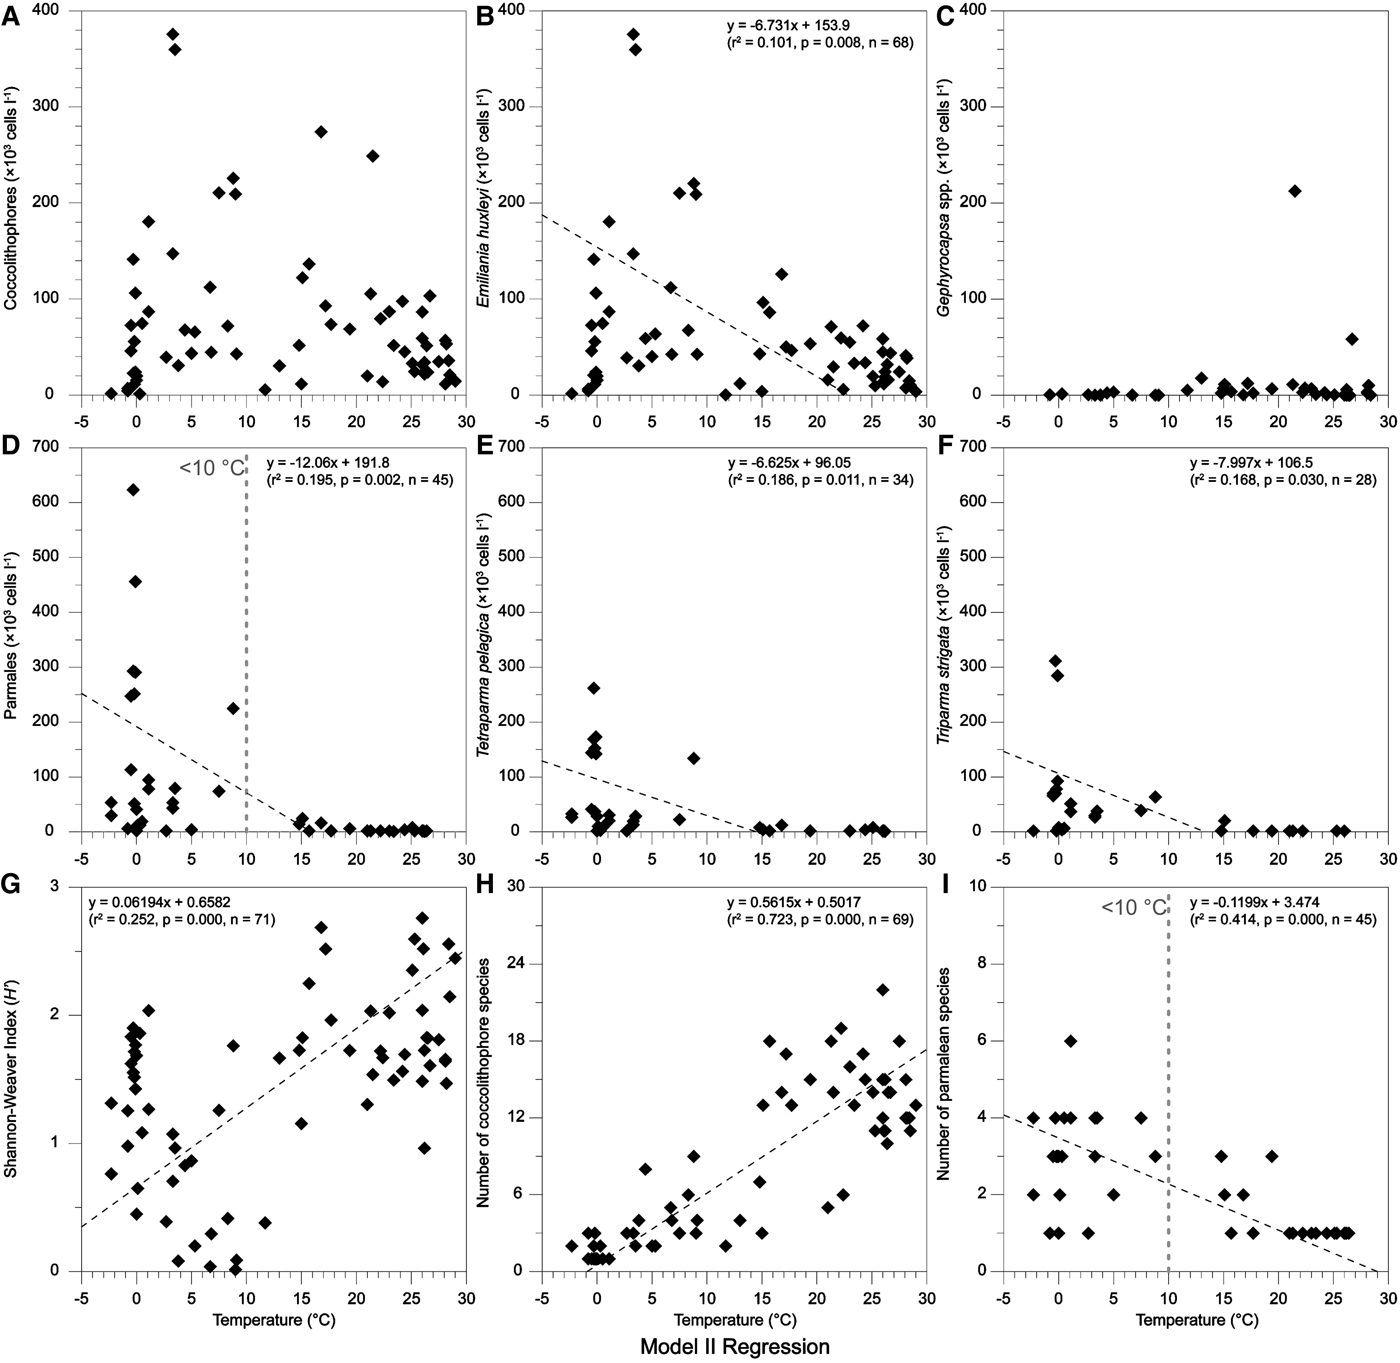
Using a model II regression, the effects of temperature on assemblages of coccolithophores and Parmales were elucidated (Figure 6). Obviously, coccolithophores can survive in a wide range of temperature and hence maintain their high abundance, while the Parmales are restricted in a small range of temperature (<10°C). This difference might be caused by the low optimal growth temperature (0–10°C) in parmalean species, which had been previously verified both naturally in the field and in the growth experiments of individual species (Ichinomiya & Kuwata, Reference Ichinomiya and Kuwata2015). Furthermore, a recent report indicated that the growth of Parmales was not limited by low silica concentration (<1 µmol l−1) even though in close genetic association with diatoms (Yamada et al., Reference Yamada, Yoshikawa, Ichinomiya, Kuwata, Kamiya and Ohki2014).
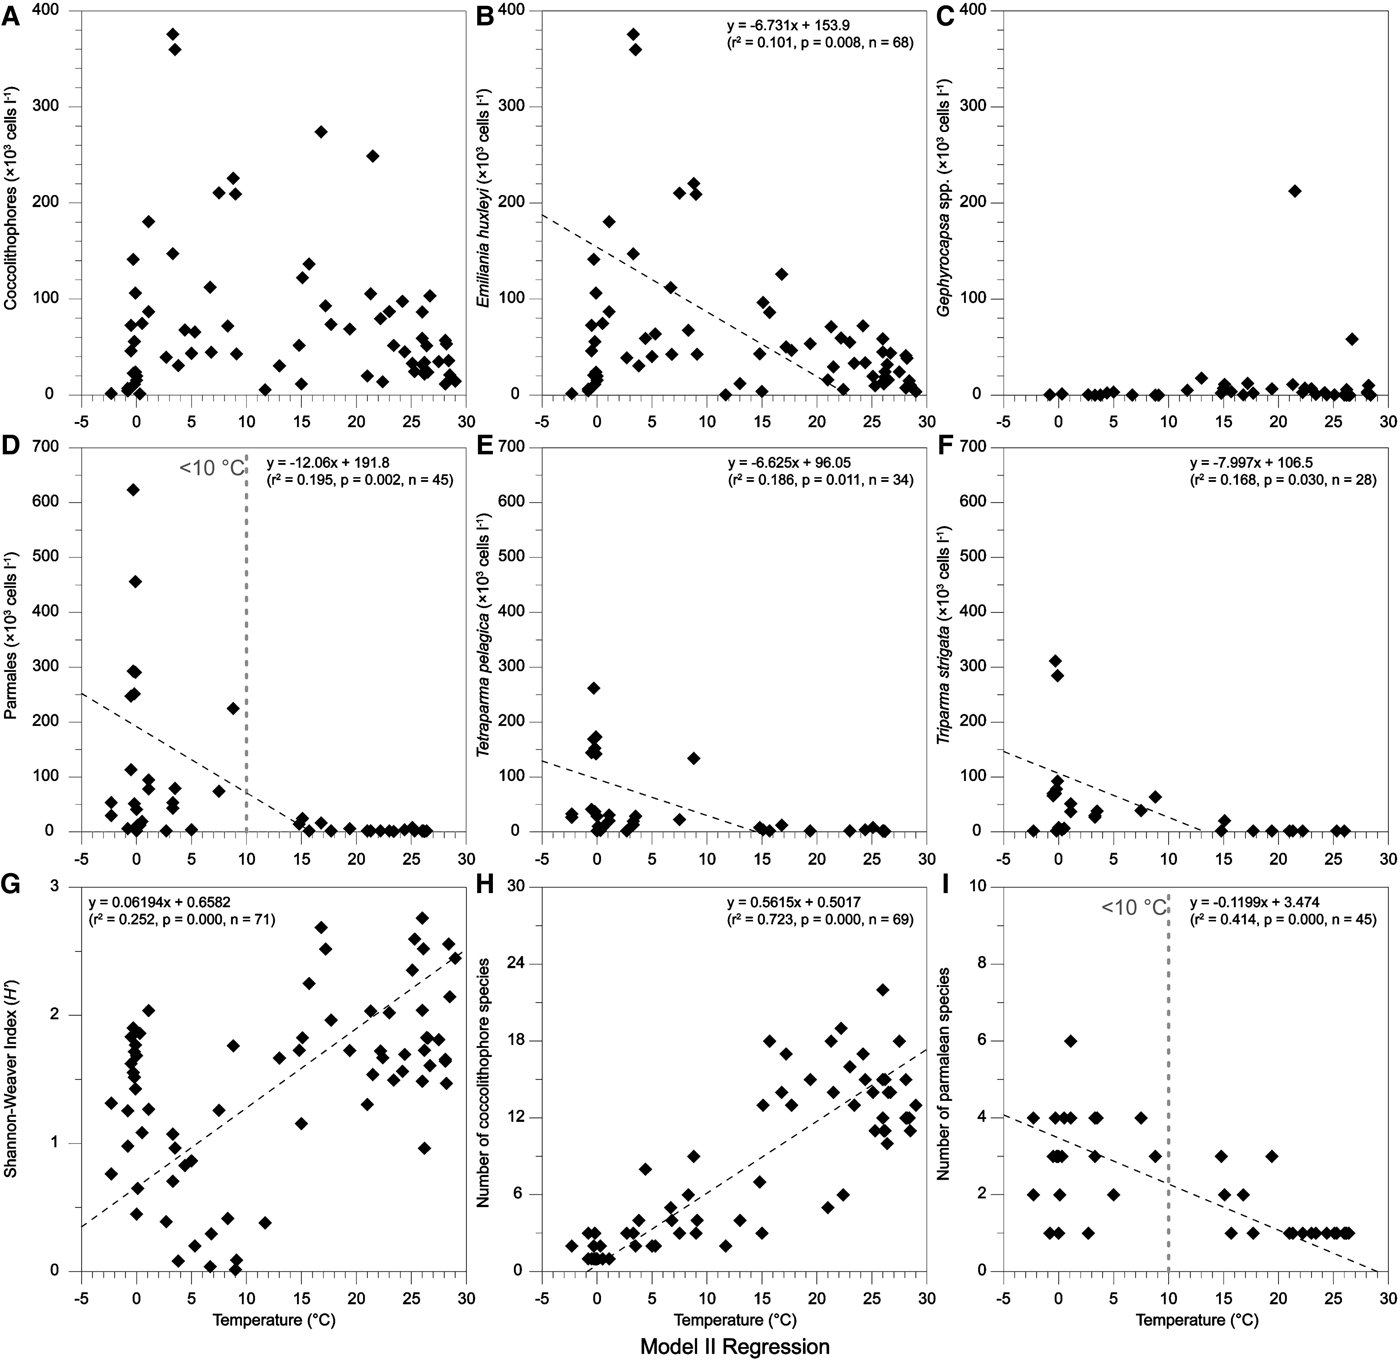
Fig. 6. Model II regressions of sea surface temperature with coccolithophores and Parmales.
Blooms of E. huxleyi had been observed in the north-east of the FI within the Great Calcite Belt (40°–60°S), in association with water temperatures between 5 and 15°C (Balch et al., Reference Balch, Drapeau, Bowler, Lyczkowski, Lubelczyk, Painter and Poulton2014). In this study, high abundances of E. huxleyi were documented in the same geographic region (Figure 2C). Additionally, their abundance presented a negative correlation with increasing temperature (Figure 6B), with high abundance in waters <10°C. These findings suggested that natural E. huxleyi had adapted to a relatively low growth temperature. This can also be used to explain why the Parmales were closely coupled with E. huxleyi in this study. However, the number of coccolithophore species, together with the species diversity (H′) of the whole nanoplankton, significantly increased with elevated temperature (Figure 6G, H), hence indicating more diverse assemblages in tropical waters, with mean increments of 127% (number) and 52% (diversity) in warmer waters (>25°C).
The oceanic warming has been dramatically impacting on the photosynthetic phytoplankton (Boyce et al., Reference Boyce, Lewis and Worm2010). Model prediction showed that tropical assemblages will be more vulnerable to the increasing seawater temperature (Thomas et al., Reference Thomas, Kremer, Klausmeier and Litchman2012). This study disclosed that temperature significantly affects the large-scale lateral patterns of nanophytoplankton in the Atlantic Ocean. Abundances of coccolithophores and Parmales have been closely coupling with oceanic fronts. Therefore, to get a better understanding of phytoplankton biogeography, further studies need to focus on the ecological response of various functional types in association with changing physicochemical processes under the regional climate change.
SUPPLEMENTARY MATERIAL
The supplementary material for this article can be found at https://doi.org/10.1017/S0025315416001740.
ACKNOWLEDGEMENTS
The authors thank the crews of the trawler LongTeng for their help in sample collection. We are grateful to the anonymous reviewers for their comments on the accepted manuscript.
FINANCIAL SUPPORT
This research was supported by the Ministry of Science and Technology of the People's Republic of China (grant number 2013BAD13B03), the National Basic Research Program of China (grant number 2015CB453302) and the NSFC-Shandong Joint Fund for Marine Science Research Centers (grant number U1406403).


