


Introduction
The ribbonfish, Trichiurus lepturus (Linnaeus, 1758), is one of the 10 most important species targeted by marine fisheries worldwide. Its annual catch (1.2–1.3 million tons) has been stable since 2008, i.e. fishery data do not indicate species decline over the last 10 years (FAO, 2014, 2019). The species is listed as ‘least concern’ (LC) in the IUCN Red List of Threatened Species, with a stable population trend (Collette et al., Reference Collette, Smith-Vaniz, Hartmann, Bishop, Almukhtar, Al-Husaini, Alghawzi, Kaymaram, Abdulqader and Alam2015). The latest fishery data from Brazil was published in 2011, indicating its presence in commercial landings (2500 annual tons) (http://www.icmbio.gov.br/cepsul/images/stories/biblioteca/download/estatistica/est_2011_bol__bra.pdf).
This teleost is a widely distributed mesopredator in tropical and subtropical latitudes, forming large shoals in brackish and marine waters up to 350 m depth, being more common up to 120 m depth (Martins & Haimovici, Reference Martins and Haimovici1997; Alt et al., Reference Alt, Kuhn, Münster, Klapper, Kochmann and Klimpel2018; Froese & Pauly, Reference Froese and Pauly2019). Mesopredators, such as the ribbonfish, are medium-sized predators that drive community structure through predation on small prey. The apex predators (e.g. large sharks and cetaceans), in turn, limit the density of mesopredators so that the total predation pressure over small prey is contained. Therefore, fluctuations in predator populations (both apex and mesopredators) may have cascading effects across the food web, reducing or increasing the prey populations with further implications for all community structure and ecosystem functioning (Estes et al., Reference Estes, Terborgh, Brashares, Power, Berger, Bond, Carpenter, Essington, Holt, Jackson, Marquis, Oksanen, Oksanen, Paine, Pikitch, Ripple, Sandin, Csheffer, Schoener, Shurin, Sinclair, Sulé, Virtanen and Wardle2011; Wallach et al., Reference Wallach, Izhaki, Toms, Ripple and Shanas2015). No data are available on fluctuations in the population dynamics of the ribbonfish, but a parallel can be made with other fish species. Shelton & Mangel (Reference Shelton and Mangel2011) analysed fluctuations of fish populations through a global sample of commercially exploited fish species, and concluded that environmental variations that affect mortality, reproduction and recruitment, together with human exploitation, dramatically alter the temporal variability in abundance of fish populations. The authors also highlighted predator–prey interaction as a hypothesis to explain fluctuations in fish abundance.
The ribbonfish has an aggregate and voracious feeding behaviour, taking advantage of its big eyes (visual predator) and oral apparatus with large jaws to actively catch their prey (Martins et al., Reference Martins, Haimovici and Palacios2005; Froese & Pauly, Reference Froese and Pauly2019). There is size disparity among conspecifics, with diet shift during the ontogeny: juveniles, sub-adults and small adults up to 100 cm length feed mostly on euphausiids, small pelagic planktonic crustaceans and small fishes, whereas adults over 100 cm length feed mainly on fish, squids and crustaceans (Nakamura & Parin, Reference Nakamura and Parin1993). Adult cannibalism of juveniles is reported for the ribbonfish (Martins et al., Reference Martins, Haimovici and Palacios2005; Bittar et al., Reference Bittar, Castello and Di Beneditto2008; Liu et al., Reference Liu, Cheng and Chen2009; Cruz-Torres et al., Reference Cruz-Torres, Martínez-Pérez, Franco-Ló and Ramírez-Villalobos2014), although it is not a general rule (Yan et al., Reference Yan, Hou, Chen, Lu and Jin2011; Alt et al., Reference Alt, Kuhn, Münster, Klapper, Kochmann and Klimpel2018). Adults and juveniles display opposite vertical migration in the water column that minimizes feeding competition. Large adults usually feed near the surface during the daytime and migrate to the sea bottom at night, while juveniles remain near the bottom during the daytime and form loose feeding aggregations near the surface at night (Froese & Pauly, Reference Froese and Pauly2019). Studies on feeding habits of the ribbonfish showed high prey diversity in the stomach contents (16–58 prey species); however, no more than 10–20% are really important to its diet (Martins et al., Reference Martins, Haimovici and Palacios2005; Chiou et al., Reference Chiou, Chen, Wang and Chen2006; Bittar et al., Reference Bittar, Castello and Di Beneditto2008; Liu et al., Reference Liu, Cheng and Chen2009; Yan et al., Reference Yan, Hou, Chen, Lu and Jin2011).
Stomach content analysis is a traditional method to evaluate feeding habits, which is applied in fish trophic ecology studies (e.g. Elston et al., Reference Elston, von Brandis and Cowley2015; Greenwell et al., Reference Greenwell, Coulson, Tweedley and Loneragan2018; Jansen et al., Reference Jansen, Post, Olafsdottir, Reynisson, Oskarsson and Arendt2019). This low cost method allows prey identification, quantification and original size estimates, but it has bias in data interpretation. Stomach content analysis shows a diet ‘snap-shot’ (sometimes only the last meal), and can lead to misinterpretation because of differences in prey digestion rates, under- or overestimating the contribution to consumer diet, especially when the sample size is low and/or the sampling effort was not done in the long term (Pierce & Boyle, Reference Pierce and Boyle1991).
Stable nitrogen (δ15N) and carbon (δ13C) isotopes have provided data on fish feeding ecology to understand trophic relationships and feeding assimilation, integrating diet over time (Di Beneditto et al., Reference Di Beneditto, Tavares and Monteiro2018; Landry et al., Reference Landry, Fisk, Yurkowski, Hussey, Dick, Crawford and Kessel2018). The enrichment for δ15N among trophic levels is more obvious than for δ13C, which is usually applied to indicate different carbon source diets (e.g. inshore vs offshore, pelagic vs benthic, coastal vs oceanic) (Fry, Reference Fry2008). Because different tissues metabolize proteins and carbohydrates at different rates, food is incorporated into consumer tissues at rates specific to each tissue-turnover rate. The liver has a faster turnover rate as compared with muscle, reflecting the food assimilation over the last weeks and months, respectively (Caut et al., Reference Caut, Angulo and Courchamp2009).
The discrimination factors (Δ15N and Δ13C), also known as trophic enrichment factors, are key parameters in any isotope model, representing the isotopic difference between consumer tissue and their food sources after they reached equilibrium (Parnell et al., Reference Parnell, Inger, Bearhop and Jackson2010). In the absence of species-specific discrimination factors from controlled diet experiments (constant isotopic diet), these variables can be obtained from phylogenetically related species, considering the same tissue (Newsome et al., Reference Newsome, Del Rio, Bearhop and Phillips2007). There will always be some uncertainty and variability associated with discrimination factors; however, a well-known diet of a wild population can also be useful for Δ15N and Δ13C estimates when controlled experiments are lacking or when values from phylogenetically related species do not fit the isotope model (Newsome et al., Reference Newsome, Bentall, Tinker, Oftedal, Ralls, Estes and Fogel2010; Phillips et al., Reference Phillips, Inger, Bearhop, Jackson, Moore, Parnell, Semmens and Ward2014).
This study verifies the food assimilation of the adult ribbonfish caught off south-eastern Brazil (~21°–22°S) in different timescales (weeks vs months) by applying isotope models to evaluate how this mesopredator uses the food sources. In this region, its feeding habit was well described by Bittar et al. (Reference Bittar, Castello and Di Beneditto2008, Reference Bittar, Awabdi, Tonini, Vidal Júnior and Di Beneditto2012) through stomach content analysis of 350 individuals caught monthly from 2004 to 2006. Unfortunately, nothing else about its local feeding habit has been updated since then, and these previous data are the only available information to support the isotope models to predict the feeding assimilation. The question raised here is: Is the food assimilation similar or variable at different timescales? The answer may indicate how lasting is the association of the ribbonfish with the feeding area.
The ribbonfish populations are not threatened by fisheries, but the species’ ecological role as a mesopredator, limiting prey populations, is important for top-down control in the marine environment. Thus, the understanding of its trophic relationships with the prey species is a baseline to track eventual changes in prey availability and, in turn, changes in the marine food web structure.
Materials and methods
Sampling area
The sampling area encompassed coastal waters off south-east Brazil, from 21°18′–22°01′S, up to 50 m depth (Figure 1). Along this area, commercial fisheries with gillnets, trawl nets and fishing lines are practised with 10–13 m long motorized wooden boats (Di Beneditto et al., Reference Di Beneditto, Ramos and Lima2001; Bonfim et al., Reference Bonfim, Santos and Di Beneditto2017).

Fig. 1. Sampling area where adult ribbonfish (light grey) and their food sources (dark grey) were caught off south-east Brazil.
Sampling of adult ribbonfish and their food sources
The ribbonfish were caught by gillnet fisheries during 2010 (Table 1). The individuals were sampled at Atafona fishing harbour (21°35′S) during landings, and only fish greater than 100 cm length (adults) were considered in this study. The length of maturity for this species is 50.6 cm, and individuals with 100 cm or greater are already adults (Froese & Pauly, Reference Froese and Pauly2019). During necropsies for muscle and/or liver sampling, a visual inspection of the gonads was done; however, histological procedures to check the reproductive activity were not done. Thus, the individuals were considered adults based on the total length only (>100 cm).
Table 1. Sampling month, sample size, length and mean isotopic values (δ15N and δ13C) of the adult females of ribbonfish and preferred food sources off south-east Brazil (21°S–22°S)
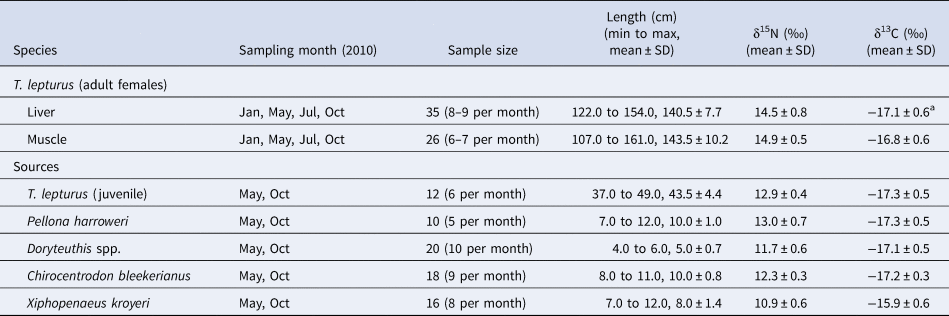
a Lipid-corrected value.
The individuals were already eviscerated during landings, and stomach and intestine were discharged at sea by the fishers. The fishers kept the gonads because this organ has commercial value in local markets. In some individuals, the liver was kept in the abdominal cavity and we could sample it. It justifies why the stomach contents were not analysed, and why we did not have muscle and liver samples from the same individual. A sample from the back dorso-lateral muscle (3 g of wet weight) and/or liver (2 g of wet weight) was removed and kept frozen (−18 °C) in dry sterile vials prior to stable isotopes analyses.
The sampling of the main prey species (hereafter named food sources) was based on Bittar et al. (Reference Bittar, Castello and Di Beneditto2008, Reference Bittar, Awabdi, Tonini, Vidal Júnior and Di Beneditto2012) for the same study area. The food sources that support the isotope models are: juvenile conspecifics, the fish Pellona harroweri and Chirocentrodon bleekerianus, the squid Doryteuthis spp. and the shrimp Xiphopenaeus kroyeri. Phillips et al. (Reference Phillips, Inger, Bearhop, Jackson, Moore, Parnell, Semmens and Ward2014) highlighted that the isotope models should not miss relevant food sources to the consumer's diet, but also should consider the number of sources to include. These authors alert that the number of food sources should be kept as low as possible, since the discriminatory power of models starts to decline markedly above six or seven food sources.
In 2010, the main food sources were sampled along the sampling area of the adult ribbonfish (Figure 1). The samplings were done during regular trawl net fisheries. A sample from the muscle (1 g of wet weight) was removed and kept frozen (−18 °C) in dry sterile vials prior to stable isotopes analyses (Table 1).
Stable isotopes analysis
Freeze-dried samples (ribbonfish and food sources) were ground with mortar and pestle to a homogeneous fine powder. Approximately 0.4 mg (dry weight) of tissues were weighed in tin capsules for the analysis. The elemental and isotopic composition of all samples were determined by using an Elemental Analyzer (Flash 2000) with interface CONFLO IV coupled to an isotope ratio mass spectrometer Delta V Advantage (Thermo Scientific, Germany) in Laboratório de Ciências Ambientais at Universidade Estadual do Norte Fluminense Darcy Ribeiro – UENF.
The samples were analysed with analytical blanks and urea analytical standards (IVA Analyzentechnik-330802174; CH4N2O M w = 60, C = 20%, N = 46%), using certified isotopic compositions (δ13C = −39.89‰ and δ15N = −0.73‰). Analytical control was done for every 10 samples using certified isotopic standard (Elemental Microanalysis Protein Standard OAS: 46.5 ± 0.78% for C; 13.32 ± 0.40% for N; −26.98 ± 0.13‰ for δ13C; + 5.94 ± 0.08‰ for δ15N). Carbon and nitrogen contents were expressed as per cent element (%) and the detection limits were 0.05% and 0.02%, respectively. Carbon and nitrogen isotope ratios were expressed in δ notation as ‰ relative to Pee Dee Belemnite (PDB) and atmospheric nitrogen, respectively. Analytical reproducibility was based on triplicates for every 10 samples: ± 0.3‰ for δ15N and ± 0.2‰ for δ13C. The δ13C values for liver, a high lipid tissue, were arithmetically corrected by the equation proposed by Logan et al. (Reference Logan, Jardine, Miller, Bunn, Cunjak and Lutcavage2008) (δ13C′ = 0.967 × δ13C + 0.861) to not compromise the δ13C interpretation (Post et al., Reference Post, Layman, Arrington, Takimoto, Quattrochi and Montaña2007).
Data analysis
A t-test and ANOVA with Tukey post hoc test (α = 0.05) in the software R version 3.6.1 (R Core Team, 2019) evaluated the difference of means between the ribbonfish tissues (liver vs muscle) and among the ribbonfish tissues and each food source (n = 5) regarding isotopic values, respectively. When necessary, a maximum likelihood function (boxcox, MASS package, Venables & Ripley, Reference Venables and Ripley2002) was used for variable transformation to meet the parametric tests assumptions (linearity, normality, homoscedasticity).
The contribution of food sources to ribbonfish diet was estimated using Bayesian mixing models in the R package MixSIAR (Stock & Semmens, Reference Stock and Semmens2016). These models allow for the uncertainty associated with isotopic values and diet-to-tissue discrimination factors. The isotopic values for liver and muscle were modelled separately because they have different discrimination factors and represent food assimilation in different timescales. Each model was run with Markov Chain Monte Carlo (MCMC) (three replicate chains) in a chain length of 100,000 iterations, a burn-in of 50,000 iterations and a thinning rate of every 50th iteration across three chains. Models included a residual error term. The Gelman–Rubin and Geweke diagnostics were used to check model suitability (Stock & Semmens, Reference Stock and Semmens2016). MixSIAR results were reported for each tissue and food source as a posterior density distribution of proportional contributions to consumer mixture data (median dietary proportions with associated credibility intervals).
Since there are no available data in literature on discrimination factors for the ribbonfish and the available data for other carnivorous teleosts varied widely among species and tissues (Matley et al., Reference Matley, Fisk, Tobin, Heupel and Simpfendorfer2016), we calculated the discrimination factors based on isotopic values of the ribbonfish and their food sources (mean of the five preferred prey species). The Δ15N and Δ13C applied to the models were 2.2‰ and 0.1‰ (liver) and 2.6‰ and 0.3‰ (muscle), respectively. MixSIAR permits a zero (0) value as standard deviation to discrimination factors data (Stock & Semmens, Reference Stock and Semmens2016).
Results
The sampled ribbonfish included adult females only, as verified by ovaries presence. The isotopic values of ribbonfish's liver and muscle were comparable between each other (δ15N: t = 1.0262, P = 0.3089; and δ13C: t = 1.5277; P = 0.1319) (Table 1). The comparison among ribbonfish and food sources showed higher δ15N values for the former, with differences among food sources (liver: F = 95.54 and muscle: F = 124.66; P < 0.0001; ribbonfish > conspecifics = Pellona harroweri = Chirocentrodon bleekerianus > Doryteuthis spp. > Xiphopenaeus kroyeri). For δ13C, the shrimp X. kroyeri presented higher values than ribbonfish and other food sources (liver: F = 19.49 and muscle: F = 19.01; P < 0.0001; X. kroyeri > ribbonfish = conspecifics = P. harroweri = C. bleekerianus = Doryteuthis spp.) (Table 1).
The isotope models had a good convergence because the Gelman–Rubin diagnostics were smaller than 1.05 and Geweke dignostics were similar among 3 chains (liver: chain 1 = 0, chain 2 = 0, chain 3 = 1; muscle: chain 1 = 1, chain 2 = 0, chain 3 = 0). The trophic mixing space shaped by food sources that contributed to the diet of each ribbonfish is indicated in Figure 2. The models indicated C. bleekerianus as the main contributor to the ribbonfish diet in the last weeks (liver: 38.5%; 95% credible intervals: 3.4–73.9%) and last months (muscle: 36.2%; 95% credible intervals: 3.4–68.7%). Thus, this fish is responsible for the greatest energy transfer to the ribbonfish. The contribution of other food sources ranged between 10 and 16% (liver) and between 10 and 20% (muscle) (Figure 2).
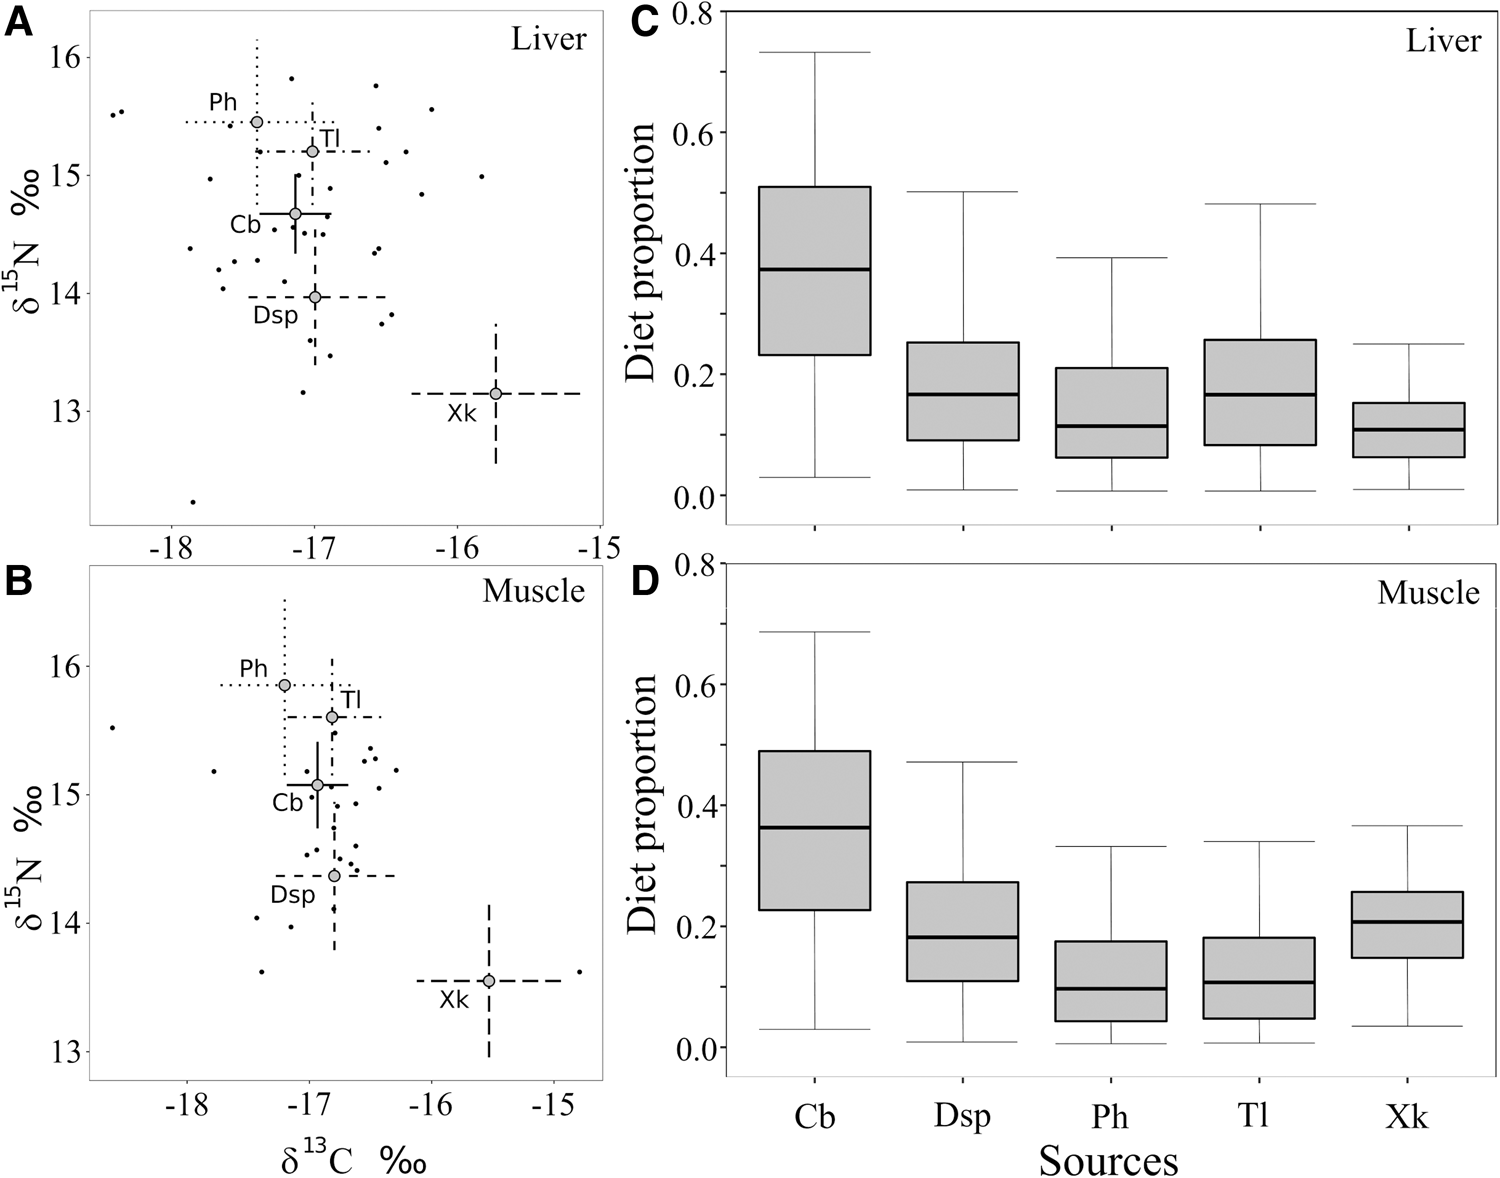
Fig. 2. Biplot of stable isotope values of the adult females of ribbonfish (small black dots) and food sources represented with the mean value of each group and 95% confidence intervals, which incorporate the error in the food source isotopic values and in the diet-to-tissue discrimination factors (A: liver and B: muscle), and isotopic model results (95, 75 and 50% credibility intervals) showing the estimated contributions of food sources to the ribbonfish diet off south-east Brazil (21°S–22°S) (C: liver and D: muscle). Cb: Chirocentrodon bleekerianus, Dsp: Doryteuthis spp., Ph: Pellona harroweri, Tl: Trichiurus lepturus and Xk: Xiphopenaeus kroyeri.
Discussion
The isotope models showed that the feeding assimilation of the adult ribbonfish remained similar in different timescales. The species showed a lasting association with coastal waters in the sampling area, and a diet shift was negligible, at least from the last weeks (liver) to the last months (muscle). The fish Chirocentrodon bleekerianus was the most assimilated food source in both timescales, whereas the contribution from other food sources to the diet was two or three times lower. These findings diverge from previous data reported by Bittar et al. (Reference Bittar, Castello and Di Beneditto2008, Reference Bittar, Awabdi, Tonini, Vidal Júnior and Di Beneditto2012), whose stomach content analysis pointed to juvenile conspecifics as the main food source and indicated cannibalism as an important feeding tactic to this mesopredator.
Our sampling area overlaps with the one studied by Bittar et al. (Reference Bittar, Castello and Di Beneditto2008), and the ribbonfish analysed in both studies were all adult individuals, with similar length class amplitude (107.0–161.0 cm vs 100.0–163.0 cm). Although juvenile conspecifics represented only 8% of the fish frequency in the stomach contents analysed by Bittar et al. (Reference Bittar, Castello and Di Beneditto2008), this food source represented 40% of the fish biomass ingested by the adult ribbonfish. For C. bleekerianus, these percentages were 9% and 10%, respectively. Meanwhile, the caloric value of both food sources are comparable, around 420 kcal g−1 dry mass (Bittar et al., Reference Bittar, Awabdi, Tonini, Vidal Júnior and Di Beneditto2012). For teleosts, cannibalism has been reported for only 1% of the species (Pereira et al., Reference Pereira, Agostinho and Winemiller2017). For adult ribbonfish, this behaviour was related to a decrease in other food sources (Martins et al., Reference Martins, Haimovici and Palacios2005; Lin et al., 2009), but it is also an ancestral behaviour of fish from the Trichiuridae family (Prikryl & Novosad, Reference Prikryl and Novosad2009). The opposite vertical migration in the water column is not only a ribbonfish behaviour to minimize feeding competition between adults and juveniles (Froese & Pauly, Reference Froese and Pauly2019), but it also probably decreases the cannibalism rate.
Differences in methodological approaches (stomach contents vs isotope models) might explain, at least in part, divergences between Bittar et al. (Reference Bittar, Castello and Di Beneditto2008, Reference Bittar, Awabdi, Tonini, Vidal Júnior and Di Beneditto2012) and this study. Stomach content analysis considers what was ingested in the last meals, while isotope models analyse the food assimilation over time (days, weeks, months or years, according to the tissue); i.e. what was really incorporated by the consumer after ingestion, digestion and excretion. Moreover, prey identification and quantification through stomach content analysis of marine predators are made mainly by hard remains recovered, such as otoliths, bones, beaks and carapaces. Since prey have different digestion rates, under- or overestimates of feeding preference may happen (Pierce & Boyle, Reference Pierce and Boyle1991). This is another possible explanation for the observed differences in ribbonfish feeding preferences (conspecifics in 2004–2006 vs C. bleekerianus in 2010) according to different methodological approaches.
The time interval between Bittar et al. (Reference Bittar, Castello and Di Beneditto2008, Reference Bittar, Awabdi, Tonini, Vidal Júnior and Di Beneditto2012) and this approach probably influences the comparison between studies because prey availability (and predator feeding preference) could have changed over the years. Bittar et al. (Reference Bittar, Castello and Di Beneditto2008, Reference Bittar, Awabdi, Tonini, Vidal Júnior and Di Beneditto2012) described the feeding preference for samples obtained from 2004 to 2006, and our sampling was done in 2010, 4–6 years later. The fish feeding in natural habitats can temporarily change because of environmental influences (e.g. temperature, dissolved oxygen), biological influences (e.g. competition) and/or human exploitation that alter the prey availability (Bearzi et al., Reference Bearzi, Politi, Agazzi and Azzellino2006; Baumgartner, Reference Baumgartner2007; Costalago et al., Reference Costalago, Navarro, Álvarez-Calleja and Palomera2012). The combined analysis of tissue samples for the isotopic approach and stomach contents from individuals caught in the same sampling or in different samplings, but respecting a temporal interval for isotopic assimilation is recommended for reliable comparisons between different methods (Polito et al., Reference Polito, Trivelpiece, Karnovsky, Ng, Patterson and Emslie2011; Kohlbach et al., Reference Kohlbach, Schaafsma, Graeve, Lebreton, Lange, David, Vortkamp and Flores2017; Silveira et al., Reference Silveira, Semmar, Cartes, Tuset, Lombarte, Ballester and Vaz-dos-Santos2020). Since our stable isotopes data were not compared with stomach content analysis from the same ribbonfish and/or temporal interval, more inferences to explain these differences would be somewhat speculative.
The isotope mixing models are particularly powerful when the results of previous dietary studies are used in the analysis to address questions about feeding preference and assimilation, for instance, and when predators and food sources are obtained in close temporal and spatial scales (Phillips et al., Reference Phillips, Inger, Bearhop, Jackson, Moore, Parnell, Semmens and Ward2014). In this study, the isotope models were based on previous dietary studies from the same sampling area, and both adult ribbonfish and food sources were sampled in the same area during 2010. Moreover, the Bayesian model for solving isotope mixing models yields consistent results even in low sample size (from 10 samples) (Jackson et al., Reference Jackson, Inger, Parnell and Bearhop2011). Thus, our sampling meets the assumptions of isotope mixing models.
The most ingested and assimilated food sources by the adult ribbonfish are coastal species (<50 m depth) that are common year-round targets or by-catch in coastal fisheries (Di Beneditto et al., Reference Di Beneditto, Ramos and Lima2001; Fernandes et al., Reference Fernandes, Keunecke and Di Beneditto2014). These food sources have been recorded as prey for other coastal vertebrates locally, such as dolphin, penguin and catfish (Bittar & Di Beneditto, Reference Bittar and Di Beneditto2009; Di Beneditto et al., Reference Di Beneditto, Santos, Rosa and Siciliano2015; Tavares & Di Beneditto, Reference Tavares and Di Beneditto2017; Di Beneditto & Tavares, Reference Di Beneditto and Tavares2019). Thus, these indirect indicators (presence in fisheries and food sources to other predators) reveal their high abundance to the ribbonfish locally. However, even inhabiting tropical and subtropical waters with high prey diversity, this mesopredator selects a few food sources as preferred, as previously reported in other areas throughout its home range (Martins et al., Reference Martins, Haimovici and Palacios2005; Chiou et al., Reference Chiou, Chen, Wang and Chen2006; Lin et al., 2009; Yan et al., Reference Yan, Hou, Chen, Lu and Jin2011).
Adult ribbonfish usually feeds near the sea surface, migrating to the bottom at night (Froese & Pauly, Reference Froese and Pauly2019). In the sampling area, the fish C. bleekerianus (most assimilated food source) and Pellona harroweri are typical pelagic species that form shoals near the sea surface, favouring their catches. Meanwhile, the other food sources have distinct behaviour in the water column. The juvenile conspecifics, the squid Doryteuthis spp. and the shrimp Xiphopenaeus kroyeri remain near (or buried at) the bottom during the daytime, swimming near the sea surface (or vertically migrating in the water column) at night (Roper et al., Reference Roper, Sweeney and Nauen1984; Willems et al., Reference Willems, De Backer, Kerkhove, Dakriet, De Troch, Vincx and Hostens2016; Froese & Pauly, Reference Froese and Pauly2019). The presence of these prey in the ribbonfish's diet indicates that in the sampling area its feeding activity is intense, occurring both at daytime and night.
The nitrogen isotope values indicate the higher trophic position of the adult ribbonfish relative to their food sources, as expected (Fry, Reference Fry2008). The δ15N values of the food sources may reflect their own feeding habits and/or features such as body size, age and excretion metabolism, that either alone or combined may influence the isotopic values (Caut et al., Reference Caut, Angulo and Courchamp2009). The carbon isotopic values are within the expected range for marine coastal species from the study area (Di Beneditto et al., Reference Di Beneditto, Bittar, Camargo, Rezende and Kehrig2012). Higher δ13C values for the shrimp X. kroyeri reflect its benthic habit, with strong association with sediment (Willems et al., Reference Willems, De Backer, Kerkhove, Dakriet, De Troch, Vincx and Hostens2016).
The isotope models that predicted the feeding assimilation of the ribbonfish showed a strong and lasting association of adult females with coastal waters off south-east Brazil (21°S–22°S). Although many prey species are recorded as food sources, as demonstrated by previous stomach content analysis, the isotope models highlighted only one as the most assimilated prey in the sampling area. Therefore, local temporal changes in prey availability might be assessed through the feeding preference of this mesopredator. Since the ribbonfish is a commercial species and, therefore, easy to sample in fishing harbours, it is an interesting model for monitoring eventual fluctuations in prey populations, not only in coastal waters off south-east Brazil, but also along its home range.
Acknowledgements
We are grateful to Dr Marcelo Gomes de Almeida from UENF for the stable isotopes analysis in the consumer and sources samples and to Silvana Ribeiro Gomes for the help during the sampling.
Financial support
This work was supported by the Conselho Nacional de Desenvolvimento Científico e Tecnológico – CNPq (grant number 301.259/2017-8) and the Fundação Carlos Chagas Filho de Amparo à Pesquisa do Estado do Rio de Janeiro – FAPERJ (grant numbers E-26/202.770/2017, E-26/210.064/2018, E-26/210.883/2016).


