INTRODUCTION
Transitional systems are ecologically and economically valuable environments that could be considered among the most productive ecosystems in the world (Underwood & Krompkamp, Reference Underwood and Krompkamp1999). These habitats provide a great amount of goods and ecosystem services to human activities including decomposition, nutrient cycling, pollutant trapping and nurseries for economically relevant fish and invertebrates (Levin et al., Reference Levin, Boesch, Covich, Dahm, Erséus, Ewel, Kneib, Moldenke, Palmer, Snelgrove, Strayer and Weslawski2001; Elliott & McLusky, Reference Elliott and McLusky2002). Benthic invertebrates play a central role in these processes by grazing on microbes attached to detritus (Lopez et al., Reference Lopez, Levinton and Slobodkin1977) and due to their bioturbation activity (Robertson, Reference Robertson1986). In this way, meiobenthos has a central function in estuarine habitats as a link between primary producers and higher trophic levels (McCall, Reference McCall1992; McCall & Fleeger, Reference McCall and Fleeger1995). Additionally, meiofauna facilitates biomineralization of organic matter enhancing nutrient regeneration and shows high sensitivity to anthropogenic disturbance (Coull, Reference Coull1999). Despite that meiofauna is essential to the functioning of soft bottom communities; most of the studies performed on transitional waters to date have considered only macrofauna. A good example of this, are North Galician Rias (north-west Spain). The northern Galician rias are funnel-like incised valleys that provide an important shelter from the effect of wave action, especially in their inner part. Moreover, these rias provide great economic and social services due to fisheries, shellfish harvesting and recreational activities (e.g. Mazé & Laborda, Reference Mazé and Laborda1990), and consequently have been included in the Nature 2000 Network as a Special Conservation Zone. During the last decades many studies have been performed on benthos from these rias (e.g. Mazé et al., Reference Mazé, Laborda and Luis1990; Currás & Mora, Reference Currás and Mora1991; de Paz et al., Reference de Paz, Patrício, Marques, Borja and Laborda2008) including the Ria de Foz (Junoy & Viéitez, Reference Junoy and Viéitez1990, Reference Junoy and Viéitez1992; Castellanos et al., Reference Castellanos, Hernández-Vega and Junoy2003), which will be studied in the present work. Nevertheless, benthic research in these areas has formerly focused on macrofauna communities, while research on meiofauna community structure and distribution patterns is scarce.
Therefore, more knowledge about meiobenthos in these areas is needed, in order to achieve a better understanding of this environment functioning to improve their management. However, nowadays it is impossible to provide an overall view of how to fit together the different factors that determine species distribution in estuarine habitats (Little, Reference Little2000). Salinity is an important environmental factor shaping meiofauna community structure in estuarine habitats (Montagna & Kalke, Reference Montagna and Kalke1992; Yamamuro, Reference Yamamuro2000). Coull (Reference Coull1999) proposed salinity, temperature and sediment particle size as major factors controlling meiofauna abundance and diversity. Soetaert et al. (Reference Soetaert, Vincx, Wittoeck, Tulkens and van Gansbeke1994) found that water depth, sediment characteristics (silt content and median grain size) and distance upstream were the environmental factors determining the distribution of meiofauna in the Westerschelde estuary, in the Netherlands. Recently Adão et al. (Reference Adão, Alves, Patricio, Neto, Costa and Marques2009) and Alves et al. (Reference Alves, Adão, Patricio, Neto, Costa and Marques2009) found similar results. Additionally, Austen (Reference Austen1989) found that salinity and different food availability were important factors structuring copepod communities in a multifactorial microcosm experiment. Similarly to meiobenthos, Bachelet et al. (Reference Bachelet, Montaudouin and Dauvin1996) found that macrofauna distribution on Arcachon Bay was controlled mainly by sediment type, salinity and water depth while Junoy & Viéitez (Reference Junoy and Viéitez1990) found that sediment characteristics (grain size, silt and organic matter contents) and tidal height were the main environmental factors governing macrofauna community distribution at the Ria de Foz. Therefore, meiofauna and macrofauna communities could be controlled by the same factors in transitional areas such as rias.
The aims of this study were to describe the meiofauna spatial structure in terms of diversity and abundance of major taxa as well as its relationship with the environmental characteristics in the Ria de Foz nature reserve. The fact that macrofauna communities are well studied in this area offers a good opportunity to test the following hypotheses: (1) meiofauna community structure will be controlled by the interaction of physical factors such as sedimentary environment and exposure; and (2) meiofauna communities' distribution patterns will match to those of macrofauna.
To clarify these questions environmental factors, abundance, composition and structure of the meiofauna communities will be studied along the estuarine gradient of the Ria de Foz.
MATERIALS AND METHODS
Study area
During late spring and summer of 2002, twenty sites were studied along the Ria de Foz (Figure 1). This ria (43°34′N 7°14′W) has suffered a strong sedimentation process that has filled almost all its area. As a result of this sediment deposition, most of the area is exposed at low tide, excluding a few ponds and river discharge channels. The main freshwater input in the Ria de Foz is the Masma River, and additionally two smaller streams outflow in the study area. Soft bottoms are the dominant habitat, with the hard substrate limited to a few rocky patches and artificial structures like harbour walls and jetties. Sedimentary characteristics presented a clear trend from the outer part of sandy sediments and low organic matter content to the inner part of fine and muddy sand sediments with higher organic matter content (Duck et al., Reference Duck, McManus and Diez1995). However, the Ria de Foz sedimentary environment has suffered different changes during the last years due to the building of artificial harbours and structures to buffer erosive processes. Junoy & Viéitez (Reference Junoy and Viéitez1989) and Hernández-Vega et al. (Reference Hernández-Vega, Castellanos and Junoy2005) have reported the changes in the sedimentary habitat before and after this anthropogenic modification and concluded that changes in the hydrodynamic regimen have induced an increase in the organic matter and silt and clay contents of the inner part of the ria.
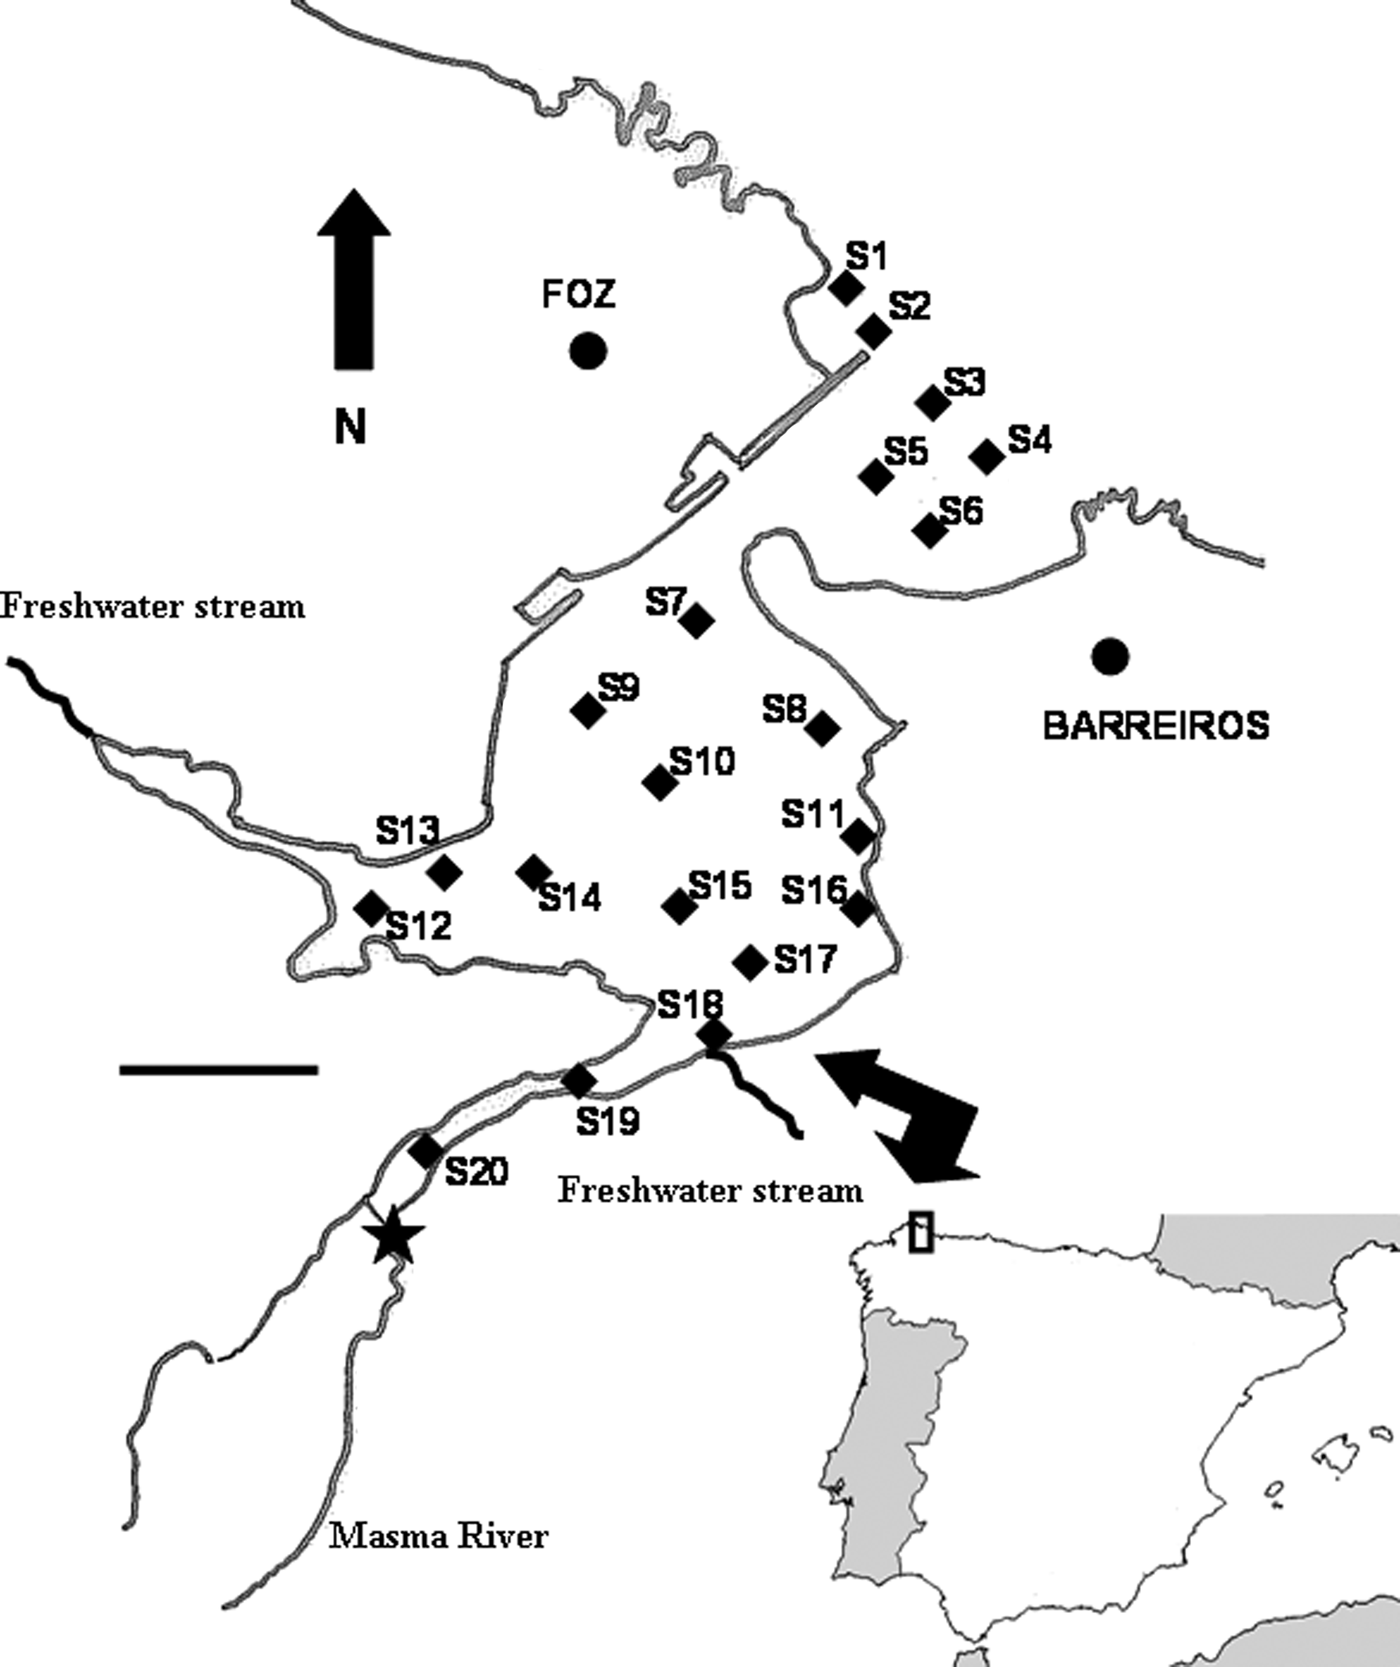
Fig. 1. Study area and sampling sites. Each site is indicated by a full square. Full star indicates the fixed point from which distance (D) to each site was measured. Scale bar: 0.5 km.
Sampling and samples processing
Four corers 10 cm long and 3.6 cm inner diameter (sampling surface 10 cm2), were collected at each site. One of these corers was used for granulometric analysis and determination of organic matter content. The remaining three corers were used for the meiofaunal study. Meiofaunal samples were processed immediately after collection. They were treated with a 7% MgCl2 solution for 10 minutes for the narcotization of the fauna and preserved in 10% neutralized formaldehyde solution with rose Bengal. The meiofauna was extracted by decantation through a 30 µm mesh size sieve (Pfannkuche & Thiel, Reference Pfannkuche, Thiel, Higgins and Thiel1988). This procedure was repeated six times for each sample. All meiobenthic organisms were counted and identified to the higher taxa under a stereomicroscope. For each site the sediment median particle size (Md), silt and clay contents (S/C) and quartile deviation (QDφ) were calculated following the procedures described by Buchanan (Reference Buchanan, Holme and McIntyre1984). Sediment organic matter content (OM) was estimated by measuring the loss of weight on ignition in a furnace at 450 °C for 4 hours. Site exposure to wave energy (EXP) was defined by considering the methods proposed by McLachlan (Reference McLachlan1980). Two kinds of sites were identified: sheltered (S) and exposed (E). Information on salinity values across the Ria de Foz were obtained from Junoy (Reference Junoy1996). Salinity and other variables such as nutrient concentration or dissolved oxygen show significant spatial variations from the outer to the inner part of estuaries. As proxy of these gradients distance (D) between the twenty sites and one fixed point (43°32′59.05″N 7°15′35.01″W) placed on the Masma River (Figure 1) were estimated.
Data analyses
Densities of the most abundant groups are presented as mean (±SD). Multivariate study of community was performed using the statistical package PRIMER 6.0. The replicated meiofauna abundance data of each site were square root transformed for the calculation of the Bray–Curtis similarity matrix. Centroids and distances among sites were calculated from the previously defined similarity matrix using the free software PCO.exe (Anderson, Reference Anderson2003). The multivariate pattern of meiobenthic communities was displayed using hierarchical agglomerate clustering technique (CLUSTER) and non-metric multidimensional scaling (nMDS) based on the centroids similarity matrix. SIMPER analysis based on all replicated samples was performed to identify the contribution percentage of each taxon to the similarity and dissimilarity within and between groups identified from the CLUSTER and nMDS analyses (Clarke, Reference Clarke1993).
In order to explore the relevance of the main environmental factors (sediment, distance to the estuary and exposure) analyses of similarities (ANOSIMs) were performed between different levels of these factors. For the exposure factor (EXP) sites were pooled into two levels: exposed (E) and sheltered (S). For the distance (D) sites were pooled in three different levels: near (N) with D < 1000 m, medium (M) with D between 1000 and 2000 m and far (F) with D > 2000 m. For sediment study Md, S/C contents and QDφ were considered as proxies of the complex sedimentary environment. For Md and S/C contents sites were pooled into three sedimentary classes: medium sands (MS), fine sands (FS) and muddy sands (MUS). Finally, for QDφ sites were pooled into four levels: very well sorted (vws), well sorted (ws), moderately well sorted (mws) and moderately sorted (ms). Levels of the last two factors followed those described by Buchanan (Reference Buchanan, Holme and McIntyre1984).
The relationship between meiobenthic assemblage structure and environmental variables was examined using the BIOENV procedure as an exploratory method (Clarke & Ainsworth, Reference Clarke and Ainsworth1993). Prior to the analyses, all the environmental data were normalized and transformed when needed. Statistical significance of BIOENV analysis was tested by a permutation test (999 permutations).
RESULTS
Environmental variables
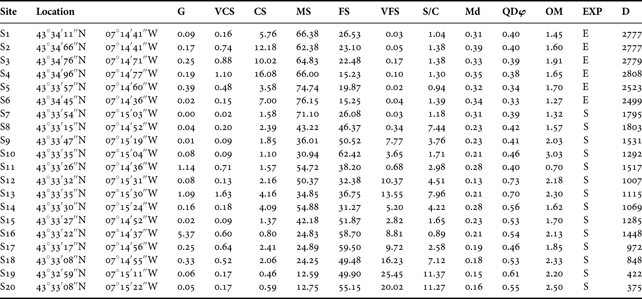
Sediment characteristics of the twenty studied sites are reported in Table 1. The Md values ranged mainly from fine to medium sands. The QDφ values ranged between 0.33 (very well sorted) and 0.73 (moderately sorted), but most of the sites were well sorted. Sediment organic matter content was relatively low for all the studied sites, ranging between 0.70% and 3.03%. The percentage of S/C was below 5% in most of the sites. However, five of the studied sites (S8, S13, S18, S19 and S20) presented S/C values from 7.12% to 11.37% being the only sites with muddy-sand sediments. Considering the EXP, most of the sites were sheltered, with only six sites (S1–S6) exposed to wave energy.
Table 1. Geographical location and environmental parameters from each studied site. G, gravel; VCS, very coarse sands; CS, coarse sands; MS, medium sands; FS, fine sands; VFS, very fine sands; S/C, silt and clay contents; Md, median particle size; QDφ, quartile deviation; OM, organic matter content; EXP, exposure (S, sheltered; E, exposed); D, distance in m from studied sites to the River Masma. Md expressed in millimetres, different sediment fraction and OM content is shown as dry weight percentage of sediment and D expressed in metres.

Considering salinity values provided by Junoy (Reference Junoy1996) salinity showed important spatial and seasonal variations. Salinity ranged from 21.2 psu to 35.5 psu across the studied localities by Junoy (Reference Junoy1996). In view of the distance to the Masma River, three groups of sites could be defined: close to the river (S17–S20), in a median position (S7–S16) and far from the river (S1–S6).
Composition and abundance of the meiofauna
Twenty-one taxa of meiofauna (one represented by larval stages), composed of 122, 239 individuals were reported in this study (Table 2). The most common taxa were nematodes, copepods, ostracods and turbellarians which were present at all studied sites, while gastrotrichs and tardigrades were found at all sites except 2, and foraminiferans at all except 3.
Table 2. Abundance (number of individuals), relative importance (in percentage) and density values per site (number of individuals 10 cm−2) of major meiobenthic taxa, total meiofauna and number of taxa from the studied area.

The collected meiofauna was largely composed of nematodes (73.96%) and copepods (16.82%). Ostracods (3.81%), gastrotrichs (1.49%) and turbellarians (0.81%) were the next taxa in order of importance. The rest of the taxa occur in small numbers (Table 2).
The mean values ± SD of the total meiofauna density, total number of taxa and main taxa density at each studied site are represented in Figure 2. Total meiofauna density ranged from 335.00 ± 20.22 individuals 10 cm−2 at S5 to 4805.33 ± 2055.69 individuals 10 cm−2 at S19 (Figure 2A). The number of taxa per site was quite similar, ranging between 6.33 ± 1.15 at S1 and 12.00 ± 1.00 at S11 (Figure 2B). Nematode density ranged from 89.33 ± 29.26 individuals 10 cm−2 at S5 to 4122.33 ± 2247.92 individuals 10 cm−2 at S13 (Figure 2C) while copepod density varied between 72.00 ± 34.77 individuals 10 cm−2 at S20 and 1154.00 ± 245.50 individuals 10 cm−2 at S7 (Figure 2D). Ostracod density ranged from 5.00 ± 6.08 individuals 10 cm−2 at S13 to 313.00 ± 254.38 individuals 10 cm−2 at S19 (Figure 2E) and gastrotrich density varied between 0.33 ± 0.58 individuals 10 cm−2 at S12 to 233.33 ± 46.36 individuals 10 cm−2 at S8, being absent at sites S10 and S13 (Figure 2F). Finally, turbellarian density ranged from 0.33 ± 0.58 individuals 10 cm−2 at S13 to 46.33 ± 11.15 individuals 10 cm−2 at S11 (Figure 2G).

Fig. 2. Mean ± SD values of: total meiofaunal density (A), total number of taxa (B), nematode density (C), copepod density (D), ostracod density (E), gastrotrich density (F) and turbellarian density (G). Densities are expressed in number of individuals 10 cm−2.
The importance of the taxa varied according to the site, nematodes being the dominant taxa at 13 of the 20 studied sites and copepods at 7 of them. With regard to the second most important taxa, there was more variability. Copepods were the second most abundant taxa at 8, nematodes at 7 sites, rotifers at 2 sites, and gastrotrichs, ostracods and turbellarians at only 1 site.
Meiofauna communities
The CLUSTER ordination identified three main groups (Figure 3A). One group (A) clustered outer sites from S1 to S6, the second group (B) clustered sites S7, S8, S11 and S16 and finally, the third group (C) clustered the rest of the studied sites. Therefore, three main meiofauna communities can be defined based on their structure. The nMDS ordination obtained from the meiofaunal taxa density is presented in Figure 3B. The low stress level (0.1) indicated that an acceptable representation of the similarities in community structure was achieved (Clarke, Reference Clarke1993). The nMDS ordination of the sites confirmed the results obtained in the CLUSTER dendrogram discerning the same three different communities. Communities showed a clear distribution pattern along the ria (Figure 4). Community A was located in the outer area of the ria, community B was placed in the middle area and community C was located in the inner part of the ria as well as in middle areas near streams seepage.

Fig. 3. Cluster analysis dendrogram (A) and non-metric multidimensional scaling plot (B) based on meiofaunal abundance. Upper case letters indicate the different groups found in the cluster analysis.

Fig. 4. Study area showing the spatial distribution of the three meiofaunal communities found. Scale bar: 0.5 km.
Results of the SIMPER analysis are presented in Table 3. The main taxa responsible for group A similarity were copepods and nematodes. Community A was clearly dominated by copepods that were also the most abundant taxa in all the samples clustered in community A. The main taxa responsible for group B similarity were nematodes and copepods. Community B was dominated by nematodes, but copepods were still abundant. Finally, the main taxa responsible for group C similarity were nematodes and copepods, but this community was clearly dominated by nematodes, showing the remaining taxa in lower densities. The three groups presented a high percentage of similarity, above 65%. The responsible taxa for dissimilarity were the same taxa as for similarity. However, other minor taxa like tardigrades, rotifers and polychaetes contributed significantly to dissimilarity between groups.
Table 3. SIMPER analysis results. Percentage of similarity within each group and percentage of dissimilarity between groups are presented in bold. Taxa responsible for similarity or dissimilarity and their individual contribution are shown in roman.

Environmental parameters and meiofauna relationships
After grouped sites in function of the main environmental parameters, ANOSIMs showed significant differences between exposed and sheltered sites (Global R: 0.773, P < 0.001) (Table 4). Moreover, significant differences were detected in function of the distance between sites and the Masma River (Global R: 0.556, P < 0.001) being all the possible combinations between the three groups significantly different, except for M-N (Table 4). Moreover, significant differences were detected considering the Md and S/C content (Global R: 0.443, P < 0.001) being significantly different from all the possible combinations between the three groups (Table 4). Finally, significant differences were detected considering the QDφ (Global R: 0.365, P < 0.001) where all the possible combinations between the four groups were significantly different except for ms–mws (Table 4).
Table 4. Results of the analyses of similarities. Abbreviations for variables are as in Table 1. Vws, very well sorted; ws, well sorted; mws, moderately well sorted; ms, moderately sorted.

The BIOENV analysis performed with environmental parameters, showed that D was the best correlated (r = 0.722) with meiofauna community structure. However, the same analysis showed that considering D and Md together a similar, but lower, correlation with meiofauna community structure (r = 0.715) was achieved. Therefore, environmental parameters associated with D seem to be the main factors responsible for meiofauna community structure in the Ria de Foz.
DISCUSSION
Rias and estuaries are complex habitats with fluvial and marine water inputs, sediment filling and eustatic changes controlling environmental evolution. As a result of this complexity, different environments can be found in very close zones (Ruiz et al., Reference Ruiz, González-Regalado, Borrego and Pendón2004). Ria de Foz showed to be a complex system, where a clear distribution trend along the ria was presented by a sedimentary environment with higher values of Md at sites of the outer part and lower values toward inner parts. Conversely, values of QDφ, OM and S/C showed the inverse pattern, with lower values at sites of the outer area and higher values towards inner areas. This sedimentary pattern fits with what was described in previous studies at Ria de Foz by Duck et al. (Reference Duck, McManus and Diez1995) and (Hernandez-Vega et al., Reference Hernández-Vega, Castellanos and Junoy2005). Therefore, we can consider Ria de Foz a typical transitional habitat, where many environmental variables change progressively from the inner to the outer part. Values of total meiofauna density found at the Ria de Foz were similar to data recorded by Soetaert et al. (Reference Soetaert, Vincx, Wittoeck, Tulkens and van Gansbeke1994) in the Westerschelde estuary (Netherlands) and were inside the range found by Smol et al. (Reference Smol, Willems, Govaere and Sandee1994) in the Oosterschelde estuary (south-west Netherlands) and Soetaert et al. (Reference Soetaert, Vincx, Wittoeck and Tulkens1995) in different estuaries along the Atlantic European coast. However, differences were found in the abundance of the reported major taxa. While nematodes, copepods, gastrotrichs and turbellarians were the most abundant taxa in this work and in other European estuaries (Smol et al., Reference Smol, Willems, Govaere and Sandee1994; Soetaert et al., Reference Soetaert, Vincx, Wittoeck, Tulkens and van Gansbeke1994, Reference Soetaert, Vincx, Wittoeck and Tulkens1995), ostracods were found in important densities only in the present work. The highest abundance of ostracods in this work could be explained because of their seasonal life-cycles, with reproduction and development almost restricted to spring and summer (Athersuch et al., Reference Athersuch, Horne, Whittaker, Kermack and Barnes1989), when sampling was performed.
Community A was present in the outer part of the ria with full marine salinity, high exposure to wave action and medium sand sediments with low organic matter and silt and clay contents. This community was dominated by harpacticoid copepods, commonly the second group in abundance, although in exposed areas with coarser sediments copepods can become the dominant taxa (Hicks & Coull, Reference Hicks and Coull1983). Sites from community A showed low values of total meiofauna density which could be related to the physical stress due to the wave exposure as Eleftheriou & Nicholson (Reference Eleftheriou and Nicholson1975) reported. Similarly, Soetaert et al. (Reference Soetaert, Vincx, Wittoeck, Tulkens and van Gansbeke1994) proposed that high harpacticoid abundance and low nematode density on subtidal channels at the Westerschelde estuary were due to better adaptation of harpacticoids to sediment disturbance. This result is in agreement with the harpacticoid dominance in community A that was the most exposed to the wave action.
Community B is mainly located in a thin band after the outer sites. This community is a heterogeneous group of sites with medium, fine and muddy-sand sediments and slightly higher values of organic matter and silt and clay contents than sites from community A. Nematodes reached higher densities in community B than in A, but harpacticoids were still abundant in this community, especially at sites S7 and S16 (Figure 3D). This higher abundance of nematodes could be explained by lower physical stress of these sites (placed behind the seawall built in 1986) and by higher silt and clay contents, especially at sites S8 and S11, where nematodes are usually more abundant (Heip et al., Reference Heip, Vincx and Vranken1985). Total meiofauna density was higher than that reported at community A, probably due to the lower wave exposure (Eleftheriou & Nicholson, Reference Eleftheriou and Nicholson1975). Moreover, on sheltered areas sediment is finer and more stable, promoting the development of significant microphytobenthic communities (Underwood & Krompkamp, Reference Underwood and Krompkamp1999) that are an important food source for estuarine invertebrates.
Finally, community C was found in the inner part of the ria. Sites from this community showed sediments with the highest S/C values and lower sorting degree. Community C was clearly dominated by nematodes, probably due to the sedimentary environment with fine and muddy sand sediments (Heip et al., Reference Heip, Vincx and Vranken1985). As previously remarked, the fine nature of sediment promotes the development of significant microphytobenthic communities (Underwood & Krompkamp, Reference Underwood and Krompkamp1999). Additionally, in the community C area, significant amounts of decaying seaweeds were found. Both microphytobenthic communities and decaying estuarine seaweeds are relevant food sources for estuarine invertebrates, especially for nematodes (Riera et al., Reference Riera, Richard, Grémare and Blanchard1996; Riera & Hubas, Reference Riera and Hubas2003), explaining the higher nematode density values found in community C.
Meiofauna communities showed an important overlap in the distribution patterns with macrobenthic communities described by Castellanos et al. (Reference Castellanos, Hernández-Vega and Junoy2003). This high degree of similarity points out common environmental variables structuring macro- and meiobenthic communities.
Analyses of similarities showed clear significant differences, with high R values, between community A and the inner communities B and C. These differences pointed out the coastal nature of community A: high exposure, far distance to the river, very well and well sorted, medium sand sediments and marine salinity. Differences between communities B and C were not so obvious in ANOSIM due to their similar sedimentary environment and community structure. However, Cluster and nMDS analyses showed that community B and C could be separated despite their similarity.
Considering all studied environmental variables, D was the variable that better explained the meiofauna distribution pattern at the Ria de Foz. This result showed that gradual changes in several environmental variables along the salinity gradient are the major force structuring the meiofauna community. Similar results were previously found by Soetaert et al. (Reference Soetaert, Vincx, Wittoeck, Tulkens and van Gansbeke1994) and reflect the complex interaction of environmental variables and benthic communities on transitional habitats. Therefore, perturbations on the estuarine circulation that change environmental variables related to salinity gradient will alter composition and structure of benthic fauna. This was reported for macrobenthos by Castellanos et al. (Reference Castellanos, Hernández-Vega and Junoy2003) in Ria de Foz after drainage activities and seawall construction.
CONCLUSIONS
Ria de Foz harbours an abundant and rich meiofauna life. This work provides the first data about meiofauna diversity and structure in the Ria de Foz nature reserve. These baseline data should be useful for future management and conservation plans on this protected area. Multivariate analyses identified three meiofauna communities showing a clear distribution pattern. This distribution pattern was very similar to the macrobenthic community pattern and it is related to changes in environmental variables along the salinity gradient reported in the Ria de Foz. Therefore, in order to maintain the goods and services provided by this nature reserve, activities that significantly alter natural water circulation should be avoided.
ACKNOWLEDGEMENTS
The authors would like to thank L. Rubal and L. Veiga for sampling assistance; and A. Marhadour and Erin Sullivan for reviewing the final version of the manuscript. We are also grateful to two anonymous referees for all the helpful comments and suggestions, which greatly improved this paper. This research received no specific grant from any funding agency, commercial or not-for-profit sectors.