


Introduction
Straits are waterways connecting two neighbouring water masses by way of a restricted passage between two land masses, and are generally characterized by the presence of strong tidal currents resulting from the fluid dynamics of water passing through a restriction. These strong currents promote vertical mixing of the water column, as well as lateral transportation of the water mass. Current-driven stirring serves to deliver nutrients from the deeper aphotic layer to the surface, but phytoplankton communities growing in the upper euphotic zone are transported not only laterally but also vertically. Therefore, the phytoplankton biomass at the sea surface does not always show high levels even in the presence of relatively high nutrient levels. Nutrients brought to the surface in areas of vertical mixing are a potential source to support ‘new production’ (sensu Dugdale & Goering, Reference Dugdale and Goering1967) by phytoplankton after they have been transported laterally to the tidal frontal (and adjacent stratified) areas (e.g. Pingree et al., Reference Pingree, Holligan, Mardell and Head1976; Takeoka et al., Reference Takeoka, Matsuda and Yamamoto1993; Sun & Cho, Reference Sun and Cho2010). The importance of the vertically mixed areas on phytoplankton dynamics in the surrounding area is thus of interest (e.g. Yanagi, Reference Yanagi1990), yet relatively little attention has been paid to the dynamics of phytoplankton biomass therein.
Phytoplankton populations in areas of mixing are at a disadvantage in acquiring the light necessary for photosynthesis (photosynthetically available radiation; PAR), because they are at the mercy of vertical transportation (e.g. Simpson et al., Reference Simpson, Tett, Argote-Espinoza, Edwards, Jones and Savidge1982). Moreover, vertical mixing tends to increase suspended solids and hence turbidity in the ambient seawater in some shallow areas due to active resuspension of the bottom sediment (e.g. Nakata & Hirano, Reference Nakata and Hirano1987). As a consequence, increased turbidity increases vertical attenuation of light (by both absorption and scattering) in the seawater. Therefore, in addition to nutrient limitation and biomass dissipation due to lateral transportation, light limitation may be an important factor for regulating phytoplankton biomass in well-mixed turbid areas. If so, it is expected that phytoplankton biomass there will show sensitive responses to changes in the light environment through the action of factors such as weather conditions (intensity of sea surface PAR) and water clarity (attenuation of PAR within the water column).
The Bisan Strait is located in the Seto Inland Sea of Japan, which is conventionally divided into around 10 subareas (Okaichi & Yanagi, Reference Okaichi and Yanagi1997). This strait has strong tidal currents (e.g. max. >1 m s−1; Takahashi et al., Reference Takahashi, Miyoshi and Mishima2012) with Secchi-disc depths (~4–5 m, Koyama et al., Reference Koyama, Nagafuchi, Seiki, Komai, Murakami, Azuma, Imatomi, Ushikawa, Hino, Takamatsu and Kakibaya1999) and compensation depths among the shallowest on record (Kobayashi et al., Reference Kobayashi, Simpson, Fujiwara and Horsburgh2006a) and containing one of the highest amounts of nutrients among the various subareas of the Seto Inland Sea (Okaichi & Yanagi, Reference Okaichi and Yanagi1997). The water column in the northern area of the Bisan Strait stratifies seasonally due to freshwater inundation from the adjacent large rivers (e.g. Takagi et al., Reference Takagi, Nanba, Fujisawa, Watanabe and Fujiwara2012), while vertical mixing tends to dominate all year round in the central and southern regions. Yamaguchi et al. (Reference Yamaguchi, Hirade, Higashizono, Tada, Kishimoto, Oyama and Ichimi2015) examined annual variation in phytoplankton production with environmental parameters in the south-eastern part of the Strait. They reported that the chlorophyll-a (Chl-a) and depth-integrated phytoplankton production were low with monotonic seasonal variations (mean ± SD = 2.1 ± 1.0 μg l−1 and 0.45 ± 0.19 gC m−2 day−1), as a result of the absence of a large phytoplankton bloom. They suggested that lack of a large phytoplankton bloom, despite the presence of high nutrient levels, might be explained by the effect of light limitation on phytoplankton growth. However, their analysis of the underwater light regime was based on measurements of vertical attenuation coefficient of PAR that were obtained only once a month. Therefore, more frequent measurements of the underwater light regime are necessary to confirm or reject the importance of light availability on phytoplankton dynamics in this area.
Based on high-frequency monitoring (a mean of once every 1.7 days), this study tests the hypothesis that light availability is a key factor to explain the dynamics of phytoplankton biomass in the south-eastern part of the Bisan Strait. Variations in sea surface Chl-a were examined as well as nutrients, incident PAR, and Secchi-disc depth at the same sampling station during a half-year period when seasonal thermal stratification was established in the adjacent areas. Fortunately, a large phytoplankton bloom for this area was observed during the study period, enabling a connection to be made with environmental parameter(s) which may have triggered the large bloom, and an assessment to be made of the importance of both nutrients and light (material and energy) in the dynamics of phytoplankton biomass fluctuations at this site.
Materials and methods
Study area
A sampling station was established in the south-eastern part of the Bisan Strait (Figure 1). It is located on the edge of a breakwater, in front of the Aji Marine Station of Kagawa University, on the northern tip of the Aji peninsula at the northernmost extent of Shikoku Island. The water depth at the site is ~6 m owing to artificial coastal fortifications (rocks contained within iron-bar cage units) placed on the seafloor along the seawall and at some shore locations. However, the typical depth a few metres offshore from the seawall is deeper, and in the vicinity exceeds 20 m. The bottom sediments around the site consist mainly of sand (International EMECS Center, 2008).

Fig. 1. Location of sampling site (circle) in the south-eastern Bisan Strait, Seto Inland Sea, Japan. Black square and triangle in the upper map indicate the monitoring sites of daily precipitation and tidal level, respectively, by the Japan Meteorological Agency (see Materials and methods). The sampling site is located on the edge of a breakwater in front of Kagawa University Aji Marine Station.
Field sampling and data collection
Field sampling was conducted on 109 days during a 186-day period, from 18 April to 21 October 2019, when thermal stratification was established in the adjacent stratified areas of the Bisan Strait. Sea surface temperature and salinity (to three significant digits) were measured using a Pro 30 Conductivity Meter (YSI, USA), usually at some time between 08:00 and 09:00 on each sampling day. The parameter σ t (= (seawater specific gravity − 1) × 1000; cf. Powlik, Reference Powlik2000) was calculated from daily measurements of salinity and temperature. Secchi-disc depth (Z SD) was measured using a 30 cm Secchi disc and seawater was collected from the sea surface with a plastic bucket. Surface water measurement at this site was considered sufficient to represent the conditions in the entire water column, which in this vicinity is vertically homogeneous due to the strong tidal currents (Yamaguchi et al., Reference Yamaguchi, Hirade, Higashizono, Tada, Kishimoto, Oyama and Ichimi2015). These surface seawater samples were taken immediately to Aji Marine Station, filtered and stored at −30°C until analysis.
Daily incident PAR was measured on the rooftop of Aji Marine Station using a LI-190 Quantum Sensor (LI-COR, USA). Data on daily precipitation and tidal level were obtained from the Japan Meteorological Agency (http://www.jma.go.jp/jma/indexe.html), from their measurement stations, which are ~15 km away for the former and 10 km away for the latter. Daily tidal range was calculated as the difference between the highest high tide and the lowest low tide in a day.
Chemical analysis
For the analysis of nutrients, each seawater sample was filtered through a 0.45 μm cellulose acetate disc filter (Advantech, Japan) using a plastic syringe. Concentrations of NO2+3-N, NH4-N, PO4-P (dissolved inorganic phosphate; DIP), and dissolved silicate (DSi) in the filtrate were determined simultaneously by colorimetric methods using an Auto Analyzer III (BL Tec, Japan), as described in the user manual. Nitrate plus nitrite nitrogen was determined by Cu-Cd reduction followed by the Naphthylethylenediamine method (e.g. Grasshoff et al., Reference Grasshoff, Ehrhardt and Kremling1983). Determinations of NH4-N, DIP and DSi were based on, respectively, the Indophenol, Molybdate, and Silicomolybdate methods (e.g. Grasshoff et al., Reference Grasshoff, Ehrhardt and Kremling1983). Dissolved inorganic nitrogen (DIN) was determined by summing values for NO2+3-N and NH4-N.
For the analysis of Chl-a, a 500 ml seawater sample was filtered through a Whatman GF/F filter. The filter with retained particles was soaked in 10 ml 90% acetone, stored at about 5°C for a day in darkness, and sonicated using a bath sonicator. The solvent mixture was subsequently filtered by a 0.45 μm polytetrafluoroethylene filter. Chlorophyll-a in the filtrated solvent was determined by the fluorometric acidification method (Holm-Hansen et al., Reference Holm-Hansen, Lorenzen, Holmes and Strickland1965) using a 10-AU Filter Fluorometer (Turner Designs, USA). The fluorometer was calibrated in advance with pure Chl-a (C6144, Sigma-Aldrich, USA) based on the molar absorption coefficient reported by Jeffrey & Humphrey (Reference Jeffrey and Humphrey1975).
Results
Tides
Tidal elevation at the sampling station exhibited an approximately semidiurnal and fortnightly oscillation (Figure 2A), with a maximum excursion occurring on 15 August, when typhoon Krosa passed the study area and tidal level abruptly increased to its highest level, coinciding with a spring tide. Daily tidal range was up to 2.5 m with maxima during spring tides and minima during neap tides (Figure 2B). Tidal range during spring tide showed the highest levels in early July and early August, whereas the lowest levels were observed in mid-September and mid-October.

Fig. 2. Temporal variations in (A) tidal level, (B) tidal range, (C) water temperature and salinity, (D) daily precipitation and integrated precipitation, and (E) σt during the sampling period (18 April–21 October 2019). White circles and black discs in (A) indicate full moon and new moon, respectively. Bidirectional arrow in (D) denotes the East Asian Monsoon rainy season in the region of Shikoku Island (from 26 June to 25 July 2019). (A) and (B) compiled with data from the Japan Meteorological Agency (see Materials and methods, and Figure 1 for sampling stations).
Temperature and salinity
Water temperature increased steadily from April (11.3°C) to mid-September, reaching its highest value on 11 September (27.8°C), and thereafter decreased (Figure 2C). Salinity ranged between 30.5 and 31.9 with a mean ± SD of 31.4 ± 0.3 (Figure 2C). Higher values (≥31.7) were recorded from mid-May to mid-July; lower values (≤31.1) were frequently observed in April and August–September. Salinity abruptly decreased from 31.7 to 31.1 during 18–26 July (Figure 2D), apparently related to precipitation during the East Asian Monsoon rainy season in the Shikoku region (26 June–25 July; Japan Meteorological Agency, https://www.data.jma.go.jp/fcd/yoho/baiu/index.html). Precipitation during the rainy season supplied 35% of total precipitation during the study period. Variation in σt was mainly dependent on that in temperature (Figure 2E). The lowest σt was consequently observed on 11 September, indicating that weakening of stratification in the adjacent stratified areas of the Bisan Strait began shortly thereafter.
Light-related parameters
Daily incident PAR tended to increase from April to late June, towards the summer solstice, and thereafter decreased gradually with time (Figure 3A). However, there were large day-to-day variations, depending on weather conditions. Secchi-disc depth occasionally (52% of 21 cases) exceeded the actual water depth during the period from April to May; frequently (71% of 48 cases) from 30 July to October (Figure 3B). From June to 29 July, it ranged between 3.2 and 5.0 m except for one case (5.5 m on 29 July), with a harmonic mean of 4.1 m, and bottom landing of the Secchi disc (Z SD > actual water depth) was never recorded during this period. The overall median for Z SD during the study period was 4.9 m.
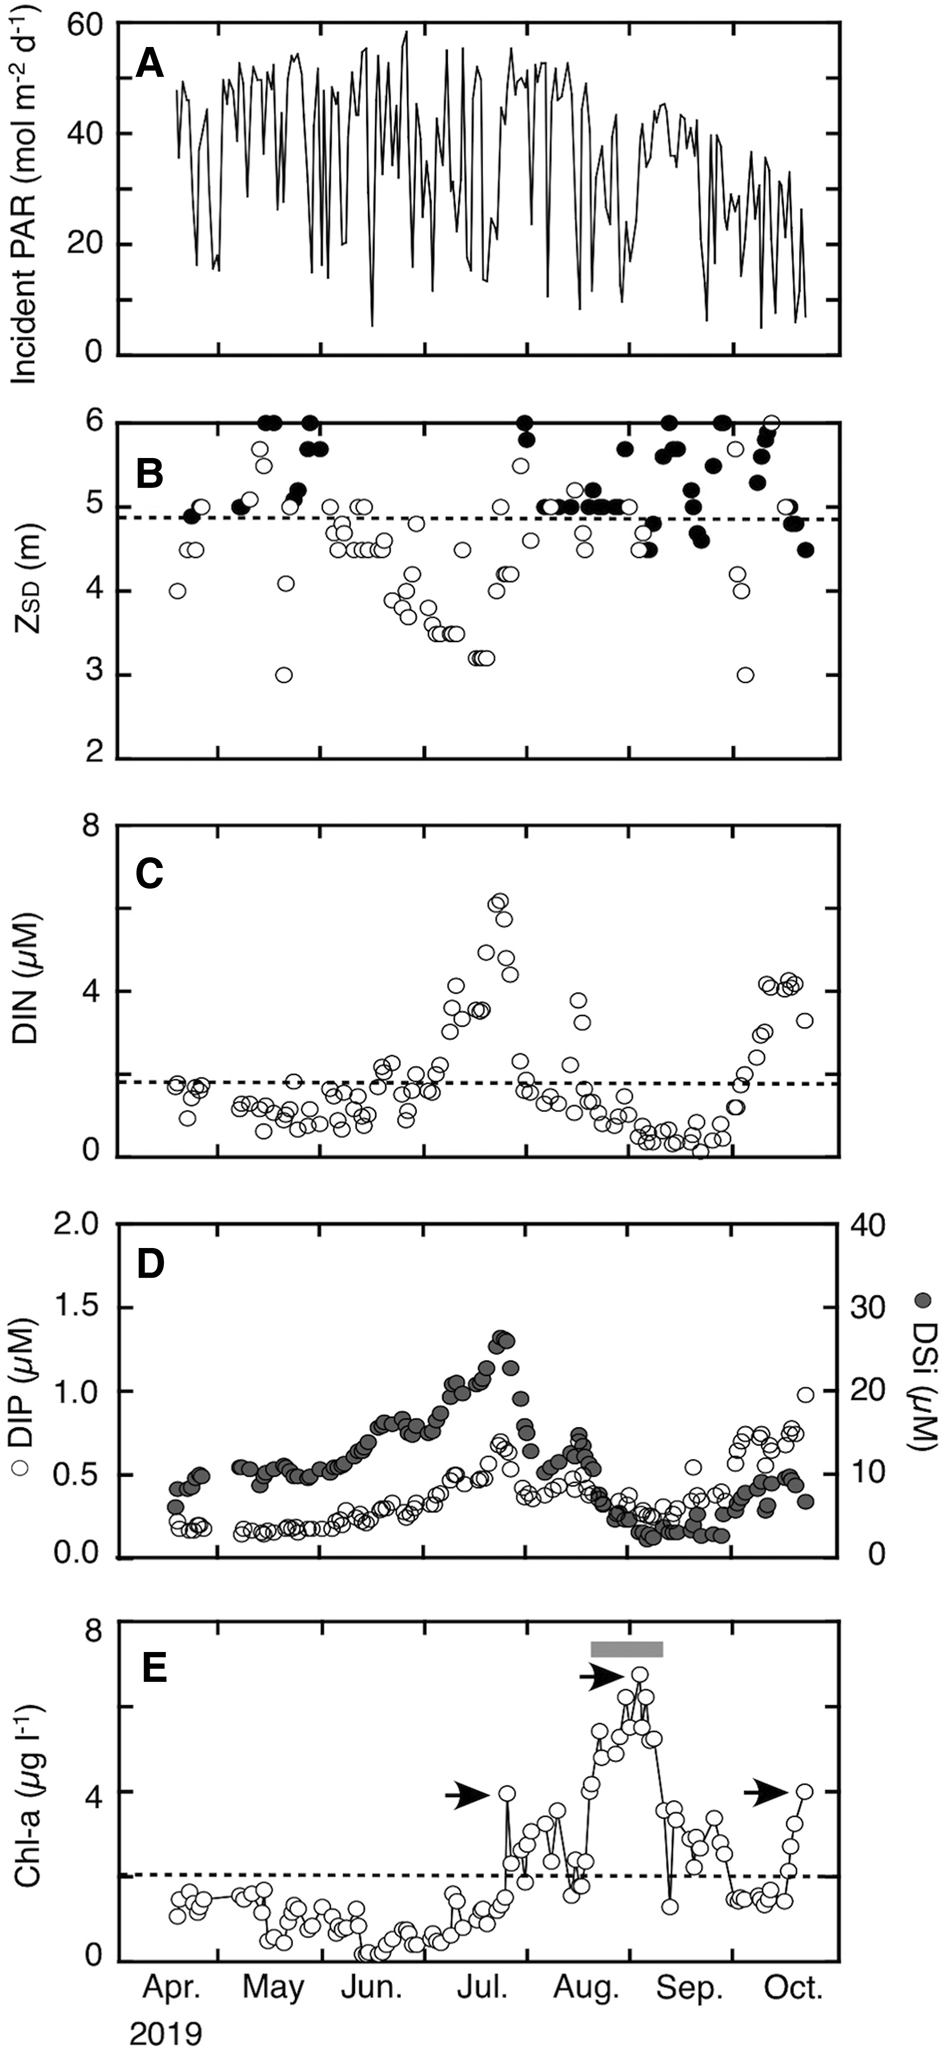
Fig. 3. Temporal variations in (A) daily incident photosynthetically active radiation (PAR), (B) Secchi-disc depth (Z SD), (C) dissolved inorganic nitrogen (DIN), (D) dissolved inorganic phosphorus (DIP) and dissolved silicate (DSi), and (E) chlorophyll-a (Chl-a) during the sampling period (18 April–21 October 2019). Black discs in (B) indicate that the Secchi disc was on the seabed (i.e. Secchi-disc depth exceeded water depth). Arrows and a grey square in (E) indicate, respectively, Chl-a peaks (25 July, 2 September, and 21 October) and the blooming period of phytoplankton (21 August to 6 September when Chl-a frequently showed >5 μg l−1). The dashed horizontal lines in (B), (C) and (E) denote, respectively, median Z SD (4.9 m), mean DIN (1.9 μM), and mean Chl-a (2.0 μg l−1) during the sampling period.
Nutrients
The concentration of DIN (Figure 3C) remained low from April to June (1.3 ± 0.4 μM). However, following heavy precipitation and subsequent salinity decrease during the rainy season (Figure 2C, D), DIN increased gradually after early July and reached its highest level (6.2 μM) on 23 July. The concentration decreased thereafter, but it increased once again and a second DIN peak (3.8 μM) was observed on 15 August, following the passage of typhoon Krosa. Dissolved inorganic nitrogen dropped to its lowest levels after the second peak and started to recover when the weakening of stratification began around the adjacent stratified areas of the strait (Figure 2E). Subsequently, the third DIN peak (4.3 μM) was recorded on 16 October. Such temporal variations in DIN were similar to those in DIP and DSi (Figure 3D). There was a significant (P < 0.01) relationship between DIN and both DIP (r = 0.71) and DSi (r = 0.68). Molar ratios of DIN:DIP and DSi:DIN in ambient seawater were persistently <16 and >1, irrespective of sampling dates (Figure 4).
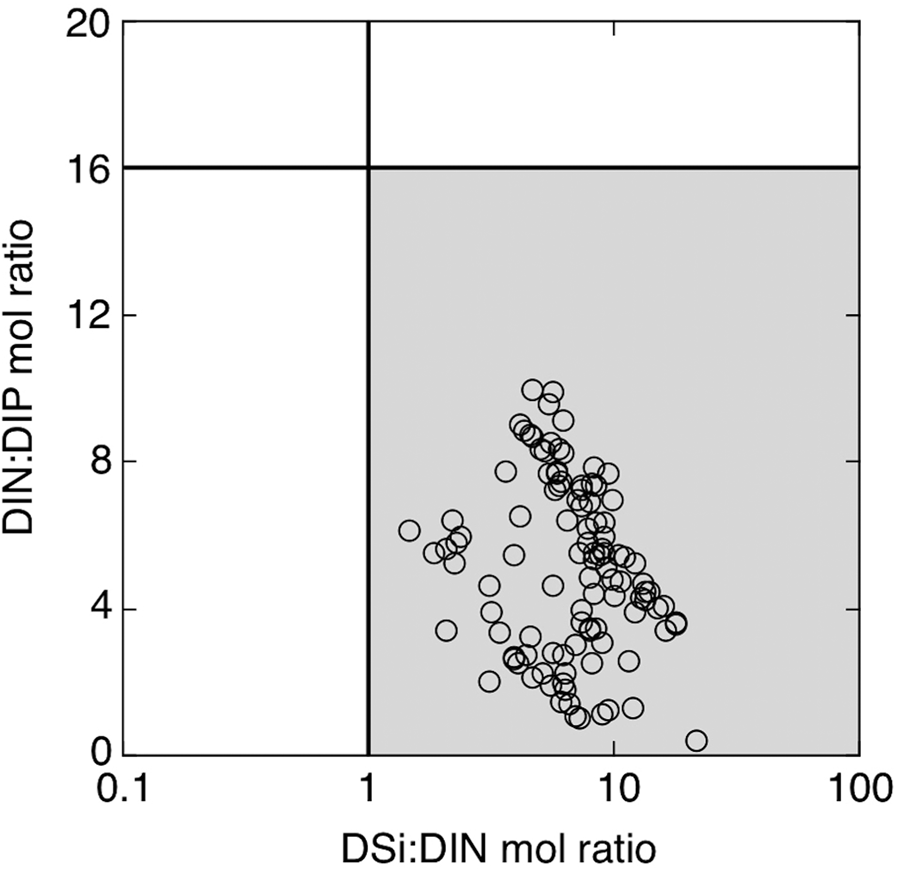
Fig. 4. Scatter plot of dissolved inorganic nitrogen to phosphorus (DIN:DIP) against dissolved silica to dissolved inorganic phosphorus (DSi:DIP) in seawater samples during the study. Vertical and horizontal lines mark DIN:DIP = 16 and DSi:DIN = 1, respectively, enclosing grey shaded area where DIN:DIP <16 and DSi:DIN >1.
Phytoplankton biomass (chlorophyll-a)
The concentration of Chl-a (Figure 3E) until 24 July was always lower than 2.0 μg l−1, which was the overall mean for the sampling period. Thereafter, it rose and remained at relatively high values, with peaks on 25 July, 2 September and 21 October. The second Chl-a peak on 2 September was the highest (6.7 μg l−1) and was recorded during the phytoplankton bloom between mid-August and early September. Each of the three Chl-a peaks was recorded within a few weeks after the first (23 July), second (15 August) and third (16 October) DIN peaks (Figure 3C). The Chl-a at the first peak (3.9 μg l−1) was somewhat low, although the highest concentration of DIN was recorded just before it. The highest Chl-a and the phytoplankton bloom were observed after the second DIN peak, which was relatively small compared with the first.
Discussion
Effect of nutrients on chlorophyll-a dynamics
Three nutrient peaks were observed during the study period (Figure 3C, D), a few weeks following each of which was a Chl-a peak (Figure 3E). This suggests that nutrient status is an important factor for regulating the phytoplankton biomass in the Bisan Strait, as with the adjacent areas (e.g. Akai et al., Reference Akai, Oyama, Masui and Miyagawa2017; Yamaguchi et al., Reference Yamaguchi, Koga, Ichimi and Tada2020). We did not examine the phytoplankton composition directly, but the Akashiwo Research Institute of Kagawa Prefecture monitored phytoplankton composition at the site KA9 (about 5 km away from our site) at monthly intervals in 2019. According to their unpublished results for April to October, diatoms were always predominant. For example, the genus Skeletonema and/or Chaetoceros with a few other genera often dominated (personal communication from H. Ochi). This indicates that phytoplankton communities around the study site consisted mainly of diatoms throughout the study period. If the molar uptake ratio of N:P:Si by the diatom-dominated local phytoplankton is assumed to be 16:1:16 (Redfield et al., Reference Redfield, Ketchum, Richards and Hill1963; Brzezinski, Reference Brzezinski1985), the result in Figure 4 indicates that DIN was always the most deficient nutrient in terms of the stoichiometric balance. The half-saturation constant for DIN uptake of phytoplankton (K DIN) is highly variable, yet the representative values are often regarded as ~1–2 μM in coastal waters (e.g. Dortch & Whitledge, Reference Dortch and Whitledge1992; Fisher et al., Reference Fisher, Peele, Ammerman and Harding1992; Justić et al., Reference Justić, Rabalais, Turner and Dortch1995). These reported K DIN are comparable to the mean DIN during the period of the present study (1.9 ± 1.4 μM, N = 108). Therefore, it seems reasonable to consider that elevation of DIN concentration was related to increased DIN uptake and thereby tended to be accompanied by an increase in local phytoplankton growth.
The second, and highest, Chl-a peak and the large phytoplankton bloom from mid-August to early September were associated with the second DIN peak (Figure 3C, E). By assuming a C:Chl-a weight ratio of 33 (Riemann et al., Reference Riemann, Simonsen and Stensgaard1989) and C:N atomic ratio of 6.6 (Redfield et al., Reference Redfield, Ketchum, Richards and Hill1963) for the phytoplankton populations which grew rapidly and caused the bloom, it is estimated that 2.8 μM of DIN was required to achieve the second Chl-a peak (6.7 μg l−1). This estimation indicates that this second DIN peak (3.8 μM) would be sufficient to cause the second Chl-a peak and the bloom event. This suggests that, in general, a DIN peak is sufficient to explain a subsequent Chl-a peak and is also applicable to the first and third Chl-a peaks. This is because the DIN peaks immediately before the first and third Chl-a peaks were higher than that before the second Chl-a peak, although the first and third Chl-a peaks were lower than that of the second Chl-a peak.
It seems certain that each DIN peak caused the followed Chl-a peak, but the magnitude of each DIN peak and that of its subsequent Chl-a peak did not coincide. For example, the highest Chl-a was associated with the relatively small DIN peak (the second DIN peak), while the highest DIN (the first DIN peak) caused a relatively small Chl-a peak (Figure 3C, E). Furthermore, the phytoplankton bloom was observed only after the second DIN peak. Our previous study conducted at almost the same site revealed that an increase in DIN concentration did not always accompany an elevation of Chl-a concentration (Yamaguchi et al., Reference Yamaguchi, Hirade, Higashizono, Tada, Kishimoto, Oyama and Ichimi2015). This suggests that although nutrient concentration (mainly DIN) is an effective explanatory variable, nutrients alone do not fully explain the observed variations in phytoplankton biomass and that there is another important factor involved.
Effect of light on chlorophyll-a dynamics
Considering the first and second Chl-a peak, Z SD values immediately before the first Chl-a peak were always lower than the median level, but those before the second Chl-a peak frequently exceeded the actual water depth (Figure 3B, E). Secchi-disc depth is a proxy for the mean attenuation coefficient of PAR in the water column, K (e.g. Poole & Atkins, Reference Poole and Atkins1929; Liu et al., Reference Liu, Hsu, Chen, Wu and Kuo2005). Hashimoto & Tada (Reference Hashimoto and Tada1997) reported that K is empirically calculated as 1.6/Z SD in the Seto Inland Sea. The penetration depth of 1% of surface PAR (Z ED) is expressed as ln(100)/K, based on the Lambert–Beer law (e.g. Cole & Cloern, Reference Cole and Cloern1984). Thus, by assuming the non-bottom landing Z SD values immediately before the first and the second Chl-a peaks as 3.0 and 6.0 m (Figure 3B), the typical Z ED of the latter (17.3 m) is estimated to be nearly twice as deep as that of the former (8.6 m). This estimation suggests that the difference in Chl-a between the first and second peaks is explained by the light availability, although the incident PAR (Figure 3A) immediately before the first and second Chl-a peaks did not significantly differ (7-days mean, 26 ± 13 mol m−2 day−1 vs 21 ± 11 mol m−2 day−1, P > 0.05, Welch test). Similarly, the occurrence of the phytoplankton bloom only from mid-August to early September is also possibly due to the high Z SD before and during the bloom event.
To further explore the importance of light as the explanatory variable for regulating phytoplankton biomass, the sampling period was divided into four arbitrary phases focusing on light-related parameters (i.e. Z SD and incident PAR; Table 1). The summary statistics in Table 1 indicate that temporal variations of mean DIN and Chl-a among the four phases differed markedly. In contrast, the frequency of Secchi-disc depth exceeding the actual water depth (Z SD landing %) tended to correspond with Chl-a level. The mean Chl-a in phase IV was significantly lower than in phase III (P < 0.01, Bonferroni test), although the Z SD landing % was almost the same for the two phases. This discrepancy might be explained by the fact that the mean incident PAR, another light parameter, was significantly (P < 0.01) lower in phase IV than in the other phases, including phase III. Overall, this suggests that the underwater light regime, which is a function of incident PAR and PAR attenuation in seawater, was more important than nutrients as a factor for regulating the phytoplankton biomass at the site in the Bisan Strait. In the stratified regions of the Seto Inland Sea, thermal stratification allows phytoplankton communities to stay at the sea surface where they are exposed to light intensity adequate for photosynthesis. Consequently, nutrients are often exhausted (e.g. Kobayashi et al., Reference Kobayashi, Simpson, Fujiwara and Horsburgh2006a) and nutrient status is generally recognized as the prime factor affecting phytoplankton biomass during the stratification period (e.g. Kobayashi et al., Reference Kobayashi, Fujiwara, Tada, Tsukamoto and Toyoda2006b). Therefore, from the results of the present study, the mechanism regulating phytoplankton biomass in the south-eastern part of the Bisan Strait is largely different from that of the adjacent stratified areas in the Seto Inland Sea.
Table 1. Summary of incident photosynthetically active radiation (PAR), % bottom landing of Secchi disc (Z SD), dissolved inorganic nitrogen (DIN), and chlorophyll-a (Chl-a) on the four phases of the study period (see text)
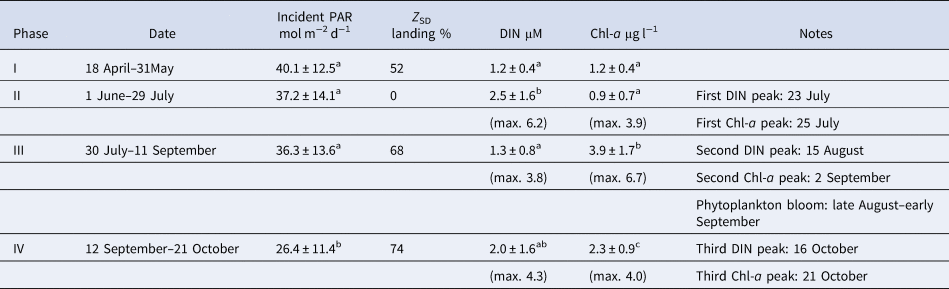
The values are reported as mean ± SD, except for Z SD. Superscript letters indicate significant differences among the four phases (P < 0.05, one-way ANOVA followed by Bonferroni test).
It is unclear why Z SD often exceeded actual water depth from August to October (phase III and IV) during the study period (Figure 3B). In the Bisan Strait, variations in Z SD are not regarded as primarily dependent on phytoplankton biomass (Fujisawa, Reference Fujisawa1999). The expectation was that temporal variations in tidal level would be an important variable for variations in Z SD, because turbidity originates from sediment re-suspension which is affected by the strength of tidal currents (e.g. Heath et al., Reference Heath, Sabatino, Serpetti, McCaig and O'Hara Murray2017). However, on the contrary, there was no clear relationship between tidal range and Z SD during the study period (Figures 2B & 3B), so seasonal variations in Z SD are not explained simply by concentration of re-suspended particles and differences in the spring–neap tide cycle, so other factors are presumably affecting the seasonal dynamics.
Yamaguchi et al. (Reference Yamaguchi, Hirade, Higashizono, Tada, Kishimoto, Oyama and Ichimi2015) investigated monthly variations of K in the water column near the site of the present study in 2012. Takeoka (Reference Takeoka1987) analysed monthly variations in Z SD in the whole of the Seto Inland Sea including the Bisan Strait. In contrast to the results of the present study, both of these two previous studies reported that PAR attenuation in the water column (i.e. K and reciprocal of Z SD) tended to show higher levels during summer to autumn in comparison with the annual mean level. Similarly, based on the 20-year measurements of Z SD, Manabe (Reference Manabe1985) reported that Z SD in summer was lower than those in winter to spring in central to south areas of the Bisan Strait. According to local fishermen, high levels of water clarity lasted from summer to autumn in 2019, around the vicinity of the study site. Indeed, the representative value of Z SD during summer to autumn around the study site was judged to be higher in 2019 (>5 m, Figure 3B) than in 2012 (K = ~0.5 m−1, Yamaguchi et al., Reference Yamaguchi, Hirade, Higashizono, Tada, Kishimoto, Oyama and Ichimi2015), on considering the equation K = 1.6/Z SD (Hashimoto & Tada, Reference Hashimoto and Tada1997). These considerations indicate that the seasonal variations in Z SD and high Z SD during summer–autumn observed in the present study are not those of a typical year such as 2012.
Takeoka (Reference Takeoka1987) noted that the abundance of terrigenous particles supplied from riverine waters may be a factor affecting seasonal variations in Z SD in the Bisan Strait. This is a reasonable hypothesis for the northern coastal area, because the three largest rivers (Takahashi, Asahi and Yoshii Rivers) enter the strait from the northern coast (Figure 1). However, the study site of the present research is on the southern coast and is 20 km or more distant from these large rivers. Furthermore, salinity in August–October (Phase III and IV) was less than for June–July (Figure 2C). Therefore, it is unlikely that weakening of riverine inputs and decreasing presence of terrigenous particles were the cause of higher Z SD values during Phases III and IV.
Another potential factor affecting seasonal variations in Z SD may be wind-related parameters. On comparing wind direction and mean wind speed in each direction for the four phases recognized in 2019, there is no notable difference in either wind direction or speed (Figure 5A–D). However, the dominant wind direction during phases III–IV in 2019 was different from those in 2012 (Figure 5C, D), when higher levels of K were observed from summer to autumn (Yamaguchi et al., Reference Yamaguchi, Hirade, Higashizono, Tada, Kishimoto, Oyama and Ichimi2015). This may seem to suggest that differences in wind direction might be partly related to differences in turbidity in the seawater during the year, but there is still uncertainty as to which factors caused the high Z SD observed in phase III and IV in 2019. Future research will be necessary to determine which are the dominant factors affecting seasonal variations in Z SD at the study site.
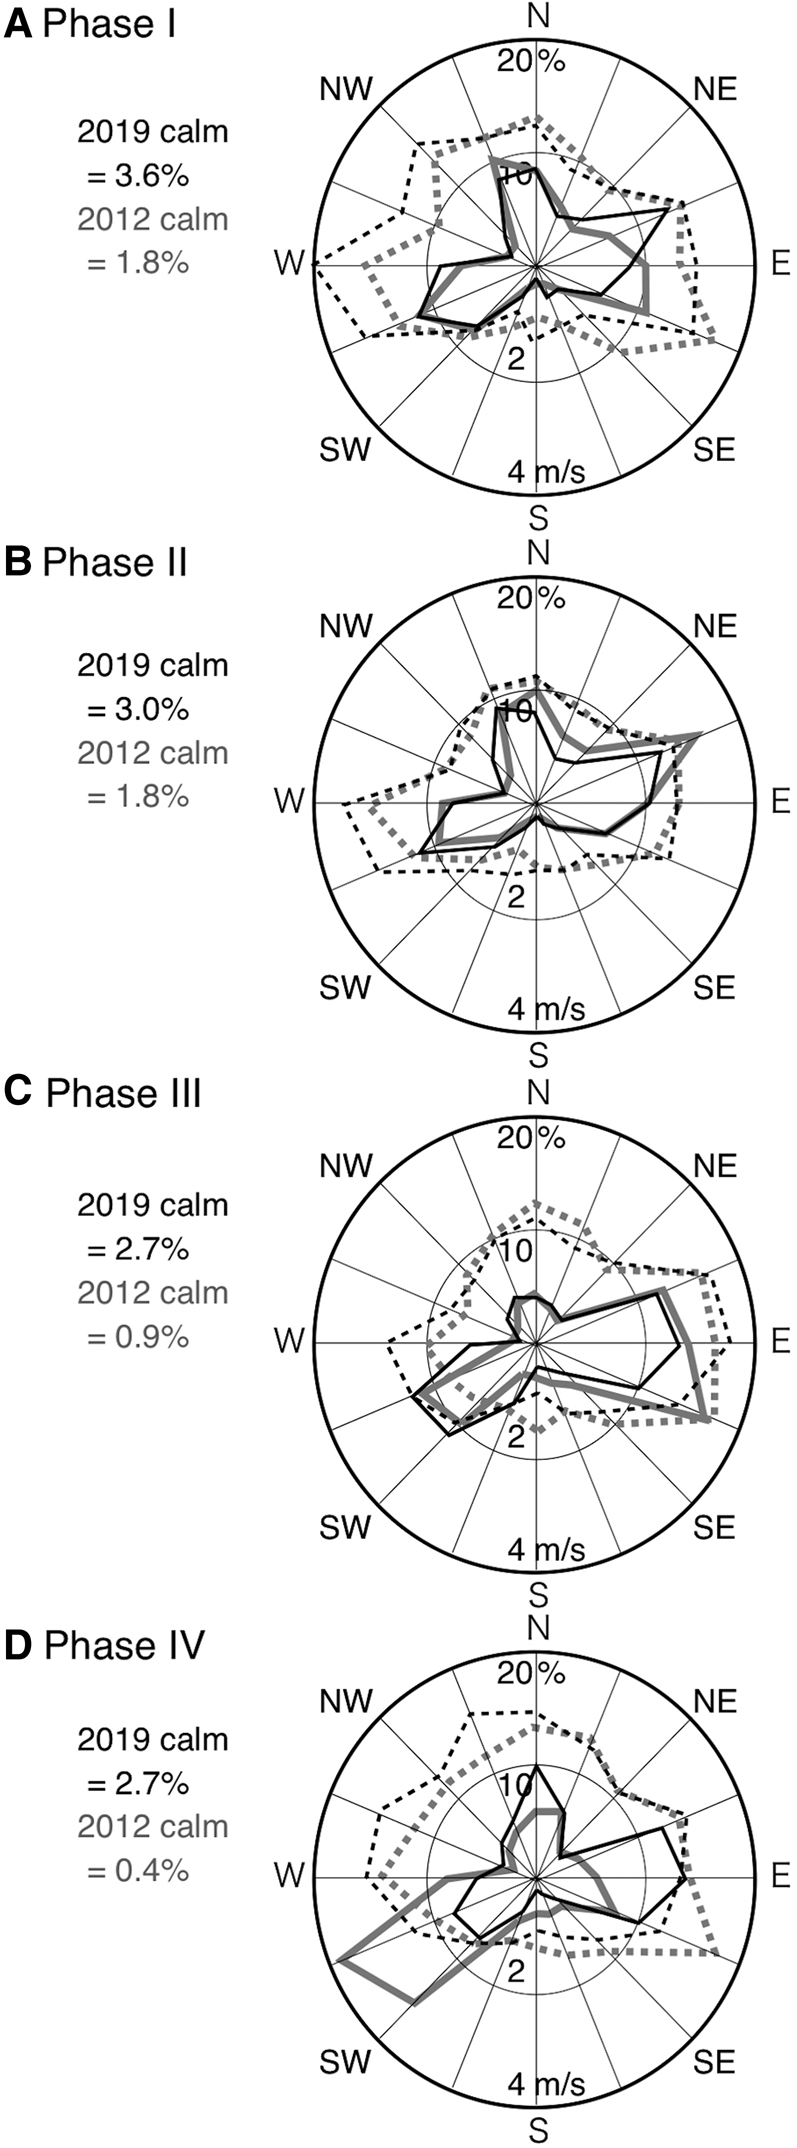
Fig. 5. Radar charts showing frequency of wind direction (solid lines) and mean wind speed at each direction (dashed lines) in 2012 (grey lines) and 2019 (black lines) during (A) phase I, (B) phase II, (C), phase III and (D) phase IV. The hourly-based original data were obtained by the Japan Meteorological Agency (http://www.jma.go.jp/jma/indexe.html) at the same monitoring site as that of daily precipitation (see Figure 1). Calm (defined herein as wind speed ≤0.4 m s−1) is not included in the diagrams but indicated left sides as a percentage of measurements taken. The dates of each phase are noted in Table 1.
In summary, this study precisely describes variations in sea surface Chl-a during a half-year period through high-frequency sampling and discusses the driving forces of its seasonal variation in the south-eastern part of the Bisan Strait. The conclusion is that (1) as found also in the adjacent stratified areas, an increase of nutrient concentration (mainly DIN) tends to increase the phytoplankton biomass; yet (2) the magnitude of the Chl-a peak and initiation of phytoplankton blooming does not depend solely on nutrient level; and hence, (3) light status in the ambient seawater is likely to be an important factor explaining the phytoplankton biomass which it contains. Understanding which factors strongly govern seasonal variations in water clarity is the key to explaining the phytoplankton dynamics of this study area.
Acknowledgements
We would like to express our thanks to Ian Gleadall (AiCeph LLC) for English language editing. We appreciate Akihiko Morimoto, Ehime University, and Goh Onitsuka, Japan Fisheries Research and Education Agency, for their helpful comments. We also thank the staff of the Akashiwo Research Institute of Kagawa Prefecture, Hiromasa Ochi and Kenta Ogawa, for providing their unpublished phytoplankton data.


