


INTRODUCTION
The harbour porpoise (Phocoena phocoena, (L. 1758)) has a very secretive behaviour and is difficult to observe in the wild. Visual monitoring of harbour porpoises and other small odontocetes is generally very time consuming and expensive. Owing to the small body size of the animals, sightings may be severely influenced by weather conditions (e.g. Teilmann, Reference Teilmann2003). However, as most odontocetes are very vociferous animals, a passive acoustic approach to automated monitoring can be of great value and supplement or replace visual observations. One such passive acoustic monitoring device is the T-POD (Timing POrpoise Detector; developed by Nick Tregenza, Chelonia Ltd, UK). The T-POD is an acoustic data logger designed especially for detection of harbour porpoises and exploits the unique features of porpoise echolocation signals. Porpoise echolocation signals are almost ideal for automatic detection since they are highly stereotypical, being short in duration (57–175 µs, −10 dB), with a peak frequency of around 130 kHz, and with very narrow bandwidth (approximately 15 kHz, and with virtually no energy below 100 kHz) (Møhl & Andersen, Reference Møhl and Andersen1973; Au et al., Reference Au, Kastelein, Rippe and Schooneman1999; Teilmann et al., Reference Teilmann, Miller, Kirketerp, Kastelein, Madsen, Nielsen and Au2002a; Villadsgaard et al., Reference Villadsgaard, Wahlberg and Tougaard2007). This type of signal is characteristic of all the Phocoenoids (Phocoena and Neophocoena), the delphinoid genus Cephalorhynchus and the dwarf and pygmy sperm whales (Kogia sp.) (Madsen et al., Reference Madsen, Carder, Beedholm and Ridgway2005). Except from boat sonar and echo sounders most other sounds in the sea are distinctively different from harbour porpoise clicks, being either more broadband, longer in duration, with significant energy at lower frequencies or a combination of the above.
The T-POD (and its predecessor the proto-POD) has been used in a range of studies and for monitoring harbour porpoises (e.g. Cox et al., Reference Cox, Read, Solow and Tregenza2001; Culik et al., Reference Culik, Koshinski, Tregenza and Graeme2001; Teilmann et al., Reference Teilmann, Henriksen and Carstensen2001; Jefferson et al., Reference Jefferson, Hung, Law, Torey and Tregenza2002; Koschinski et al., Reference Koschinski, Culik, Henriksen, Tregenza, Ellis, Jansen and Kathe2003; Cox & Read, Reference Cox and Read2004; Carlström Reference Carlstrøm2005; Carstensen et al., Reference Carstensen, Henriksen and Teilmann2006; Tougaard et al., Reference Tougaard, Carstensen, Bech and Teilmann2006; Verfuβ et al., Reference Verfuβ, Honnef, Meding, Dähne, Mundry and Benke2007). However, only one published study (Thomsen et al., Reference Thomsen, van Elk, Brock and Piper2005) has looked at the performance of T-PODs. Years of experience with T-PODs have shown that there are significant differences in sensitivity among individual T-PODs and between different versions of T-PODs (Teilmann et al., Reference Teilmann, Henriksen, Carstensen and Skov2002b; Dähne et al., Reference Dähne, Verfuβ, Diederichs, Meding and Benke2006). This is reflected in differences in the number of porpoise clicks and click trains detected and hence also affects possibilities for reliable comparison between recordings. Differences can relate to hardware, software and custom settings of the detection filters (see below). Further differences can be introduced through custom settings of the off-line train detection filters in the associated software, as well as from environmental differences in background noise between field sites. Five different T-POD versions have been manufactured and all differ in some respect from the others. Hardware (e.g. hydrophone and filters), software and detection settings have all been modified in accordance with the progressing experiences with T-POD use. Besides deliberate adjustments and modifications T-PODs may also unintentionally differ in acoustic performance (hydrophone, amplifier and filter characteristics), all of which can be quantified in a single measure, the detection threshold of the T-POD. The lower the detection threshold, the greater the detection range (i.e. distance from the T-POD at which a porpoise can be detected) and the more clicks detected, until the point where detection becomes limited by background noise (internal noise in the electronics or ambient noise). Differences among T-PODs may thus have implications for interpretation of the obtained data. We thus hypothesize that differences in T-POD detection thresholds measured in the laboratory relate to T-POD detection rates in the field and hence that laboratory threshold measurements are useful indicators of field performance.
In the following we advocate calibration of T-PODs before use, using documented calibration methods in order to promote comparability among T-POD studies.
MATERIALS AND METHODS
The T-POD
The T-POD (all specifications refer to version 3 T-PODs as were used in this study) is a self-contained unit in a cylindrical waterproof housing (70 cm long and 8.8 cm in diameter). The T-POD is powered by 6 or 12 lithium D-cells and equipped with 128 Mbyte of memory, which gives a recording time of several months, depending on the chosen duty cycle, porpoise and boat activity and noise in the recordings. The fundamental construction of the T-POD is a hydrophone connected to two band-pass filters, a comparator/detector circuit and a microprocessor with attached memory to store information on the time of occurrence and duration of possible porpoise clicks detected by the system.
The hydrophone is built from a cylindrical piezo-ceramic element embedded in rubber and plastic and placed at the end of the housing. The hydrophone output is amplified and then filtered by two band-pass filters. One filter is termed the target filter and the other the reference filter. The filter properties are adjusted when initializing the T-POD as described below. The centre frequency of the target filter is set at the peak frequency of porpoise sonar signals (130 kHz), while the reference filter is set at some frequency where there is little or no energy in the sonar signals (90 kHz). The bandwidth of each filter, which determines the specificity of the filter, is set by the parameter Q (centre frequency divided by the 3 dB bandwidth of a filter). The higher the Q value the smaller the bandwidth and the more specific the filter is. The detection threshold of the T-POD can be adjusted through the parameter sensitivity. This parameter has the range 0–15 on a non-linear scale and cannot be directly translated into a corresponding sound pressure level without calibration of the individual T-POD. Together these parameters define the spectral characteristics that must be met to generate detection. For a given signal to be accepted as a porpoise signal by the T-POD, the ratio between the energy (or intensity) of the signal output from the target and reference filters must exceed a certain (adjustable) value in favour of the target filter. In addition, the signal must exceed the detection threshold (determined by the parameter sensitivity) and be longer than a certain minimum duration, set by the operator.
The T-POD cycles between six sets of settings, termed ‘scans’ in the software, every minute. Each scan is 9.7 seconds long and the remaining 1.8 seconds is an inactive period at the end of each minute. The duty cycle is therefore 58.2 seconds per minute, or 97%. As each of the six scans can have different filter settings it is possible to adjust the T-POD for detection of more than one species.
T-POD settings in the current study were identical across T-PODs and scans:
(i) A-filter (target): 130 kHz;
(ii) B-filter (reference): 90 kHz;
(iii) selectivity (ratio A/B): 5;
(iv) A-filter integration period: short;
(v) B-filter integration period: long;
(vi) sensitivity: 6;
(vii) scan limit (maximum number of clicks per scan to economize memory): 240; and
(viii) minimum click duration: 50 μs. Version 3 T-PODs also store information on battery voltage and orientation of the T-POD in the water (angle from vertical).
The associated software (TPOD.exe) filters the recorded click-time data to find click trains, i.e. groups of closely spaced clicks supposedly from the same animal and classifies these. This software filtering is retrospectively applicable to all past T-POD data, and, if all data are analysed using the same version of the software no additional variation than the inter-T-POD variation is introduced. For the purpose of detection, trains are considered as sequences of clicks with a degree of similarity between adjacent inter-click intervals that allows a simple probability model of a train to be applied. In effect a series of inter-click intervals can be used to define a time window for the occurrence of the next, or previous, click and the probability of a click being in that window by chance can be derived from the ‘noise level’ which is the prevailing rate of arrival of clicks. Each train is given an overall P value that is the product of the series of click probabilities. Long trains and those occurring in a low noise period have a very low overall P value (a very low probability of being registered by chance) and are thus identified as arising from a train producing source. Trains are further classified by comparison of a set of numerical train descriptors with values derived from deployments known to contain either no cetaceans, or little other than cetacean clicks, or high levels of non-cetacean trains produced by boat sonar (Nick Tregenza, personal communication).
A number of general predictions can be made: trains are less likely to be identified if they contain few clicks, or low click rates. Cetacean trains that are slow and regular are more likely to be rejected because they resemble boat sonar (Nick Tregenza, personal communication).
Click trains are assigned by this method to one of six different categories: ‘Click trains with high probability of coming from cetaceans (Cet Hi)’; ‘Click trains with lower probability of coming from cetaceans (Cet Low)’; ‘Cetaceans and trains of doubtful origin (d)’; ‘Cetaceans and very doubtful trains (dd))’; and ‘Trains with features of boat sonar (Sonar)’ (T-POD.exe v. 7.41, train detection algorithm v. 3.0). Clicks that are not placed in one of the five categories above are discarded.
Calibration
T-POD detection thresholds were measured in a circular tank with freshwater at approximately 17°C. The tank was 0.85 m deep with a diameter of 1.5 m and made of acrylic plastic (Perspex). The tank was highly reverberant, but echoes were always well separated in time from the direct signal and always weaker than the direct signal at the location of the T-POD hydrophones, checked by calibration with a reference hydrophone (Reson TC4034).
Sounds used for calibration were 100 µs pulses of 130 kHz sine waves with a raised cosine envelope, generated by an arbitrary waveform generator (Agilent 33220A). These signals had similar duration and bandwidth as typical harbour porpoise signals. Signals were projected by a Brüel & Kjær 8104 cylindrical hydrophone placed in the middle of the tank at 40 cm depth. The T-PODs were mounted hydrophone down with the hydrophones at the same depths as the transmitting hydrophone at 40 cm depth. Up to six T-PODs were calibrated simultaneously to avoid effects of different levels of background noise. The T-PODs were placed in a circle equidistantly at 25.5 cm from the transmitting hydrophone, which is well outside the near field of the transmitting hydrophone. The outgoing signal was gradually attenuated using a custom-built computer-controlled digital attenuator capable of attenuating in 0.5 dB steps (absolute accuracy of the total attenuation ±0.5 dB). To assess directionality of the T-POD hydrophones, thresholds were measured at four angles of incidence (0°, 90°, 180° and 270°) around the T-POD hydrophone in the horizontal plane, by rotating the T-POD. Recalibration was performed at the same angles following deployment in a subsequent study.
The set-up was calibrated with a Reson TC4034 hydrophone connected to an ETEC A1001 pre-amplifier and an oscilloscope. The transmitting hydrophone was for some reason not completely omnidirectional and hence sound pressure level was measured at every T-POD position prior to each calibration, and therefore accounted for when calculating detection thresholds. Detection threshold was evaluated over one-minute recordings (which include all six scans) at constant sound pressure, which was gradually attenuated down to the received level at which only half the transmitted pulses were recorded on the T-POD. The T-POD detection threshold was thus defined as the received level at the T-POD at which only half the emitted pulses were detected. Only raw click files (i.e. not filtered by the train detection algorithm) were used to calculate T-POD detection thresholds.
Sensitivity of T-POD hydrophones changes during the first hours of deployment in water (Nick Tregenza, personal communication), probably due to water absorption by the plastic housing surrounding the hydrophone. To achieve repeatable results all T-PODs were soaked in the calibration tank over night before calibration commenced.
The T-PODs were calibrated immediately prior to field deployment and again at the end of seven months' deployment during a subsequent study.
The T-POD detection threshold was defined in dB re 1 µPa peak–peak (pp).
Field work
The ten T-PODs were deployed for ten days (22–31 March 2005) in a natural harbour porpoise habitat in Jammerland Bay, Great Belt, Denmark (55°36,710′N 11°6,166′E). The bay has a hard sandy bottom with tidal amplitude of less than 0.5 m. No other odontocete species than harbour porpoises are found in the bay and there is generally low boat activity in the area, with the exception of a major shipping lane 15 km away in the Great Belt. Little sonar sound and propeller noise was therefore expected in the recordings. The deployment site was 1.5 km from the shore at 8 m depth. The T-PODs were placed with a horizontal inter-T-POD distance of 40 cm assuming that all T-PODs were exposed to the same acoustic environment and probability of encountering porpoises. To counteract the positive buoyancy of the T-PODs they were attached to a heavy chain lying on the bottom placing all T-POD hydrophones approximately 1 m above the sea-floor, pointing upwards, i.e. the T-POD hydrophones were all approximately 7 m below the surface.
Data analysis
The data were processed with T-POD.exe version 7.41 software (train detection algorithm v. 3.0). The quality of the train detection filters described above has not been documented. However, in order to assure consistency with previous studies (Carlström, 2005; Carstensen et al., Reference Carstensen, Henriksen and Teilmann2006) we only used the sum of the ‘Cet Hi’ and ‘Cet low’ filters in the data analysis. This combination is sometimes referred to as the ‘Cetacean all’ filter. We focused on five parameters or indicators of porpoise echolocation activity previously extracted from click train files in order to describe porpoise presence or absence and some indications of behaviour (Carstensen et al., Reference Carstensen, Henriksen and Teilmann2006):
Encounters—defined as series of clicks separated by silent periods of less than ten minutes.
Encounter duration (ED)—defined as the duration from the first minute containing clicks to the last minute containing clicks within an encounter.
Waiting time (WT)—defined as the duration of the silent period between individual encounters. From the definition of encounters it follows that waiting times have a duration of at least ten minutes.
Porpoise positive minutes (PPM)—defined as the number of one-minute periods which contain porpoise clicks.
Clicks per porpoise positive minute (CPPM)—defined as total number of clicks divided by total number of PPM at a given resolution, e.g. per hour or day.
Further we used log10 (number of clicks detected during the entire field calibration) to describe the direct effect of the detection threshold.
Model of click detection by a T-POD
In order to assess the theoretical importance of the detection threshold we built a simple model of click detection. This model simulates reception of porpoise clicks from porpoises randomly placed and oriented around a T-POD. In order for a signal to be detected, it must satisfy the filter criteria mentioned above, but the received level (RL) of the signal must also exceed the T-POD detection threshold. If ambient background noise is assumed to be lower than internal noise of the T-POD electronics, ambient noise can be ignored in the calculations and if spherical spreading can be assumed (as has been measured for harbour porpoise signals in shallow waters by Villadsgaard et al., Reference Villadsgaard, Wahlberg and Tougaard2007) RL is given as:
where r is range in metres, SL is source level at 1 m distance, α is the absorption coefficient at 130 kHz = 0.035 dB/m (Urick, Reference Urick1983) and H(θ) is the effect of the directivity of the porpoise sonar beam. This directivity is calculated as H(θ) = 20 · log10(h(θ)), where h(θ) is the porpoise transmission beam pattern. The −3 dB beam width of a porpoise is approximately 16.5°, vertically and horizontally (Au et al., Reference Au, Kastelein, Rippe and Schooneman1999). The angle between the T-POD and the acoustic axis (the long axis through the animal) of the vocal porpoise thus has a great influence on the received level and hence on the numbers of clicks detected by the T-POD. In accordance with Au (Reference Au1993) a circular piston model was used to describe the beam pattern of a porpoise in the range −30° to 30° from the acoustic axis. As Akamatsu et al. (Reference Akamatsu, Wang and Wang2005) found that source level recorded far off-axis from a finless porpoise (Neophocoena phocaenoides) was approximately constant about 25 dB lower than the one at the acoustic axis we assumed a fixed value of −25 dB for |θ| > 30°. This assumption smooths the beam pattern in relation to predictions of the piston model, since the Bessel function in the piston model creates many side lobes with deep notches, not supported by measurements on animals. The directivity of a porpoise click was thus calculated as:
where θ is angle, J 1 is a Bessel function of the first kind, k is the wave number (=2 · π/λ = 2 · πf/c), a is radius of the piston. An equivalent radius of 2.4 cm was used, back-calculated from the directivity index determined by Au et al. (Reference Au, Kastelein, Rippe and Schooneman1999).
The above functions were then built into a simple click detection simulation implemented in Excel. We assumed a porpoise source level of 205 dB re 1 μPa (pp) @ 1 m (Villadsgaard et al., Reference Villadsgaard, Wahlberg and Tougaard2007). We chose the highest source level value measured for wild porpoises at sea. However, as long as the porpoise source level is kept constant in the model the level is not important, since it is not related to T-POD threshold. It is simply used to calculate if a theoretical echolocating porpoise at a given random distance and angle from a T-POD of a given detection threshold would be able to be recorded by the T-POD. The detection threshold of this theoretical T-POD was varied from 122–132 dB re 1 µPa (pp) in the subsequent simulations. These T-POD detection thresholds were chosen to match the real T-POD detection thresholds found during the laboratory calibration. Eleven simulations of each 10,000 clicks were performed for each detection threshold. The ten thousand combined pairs of random angles of orientation (0–180°) and distances from the T-POD (0–500 m) were created using the Excel function ‘RAND’ simulating porpoise clicks emitted from random positions and with random orientation to the T-POD. For each pair in each of the ten thousand simulation rounds comparison between the received level (from equation 1 and the chosen theoretical T-POD detection threshold determined whether a given click was detected or not.
Statistics
For statistics we used Systat v. 10. Results from the two calibration rounds were compared using a paired t-test. The five parameters were compared to T-POD detection thresholds by correlations and generalized linear model (GLM) tests were performed to validate the obtained correlations. As T-POD detection thresholds were determined with accuracy it meets the criteria for abscissa data in regression analysis. Regression lines were thus fitted with data from the model, as well as to total number of clicks detected during the field calibration as a function of T-POD detection threshold. The slope coefficients of the model and field regressions were compared using a two tailed t-test (Zar, Reference Zar1996, p. 355).
RESULTS
The T-POD detection thresholds as measured in the calibration tank are shown in Figure 1. There was a 9 dB difference between lowest and highest mean threshold found and also the directionality varied among the T-PODs. The calibration performed in November 2005, following a deployment period of almost seven months, showed that detection threshold on average (±SD) had increased by 2.6 dB±2 dB, and there was now a 15 dB difference between lowest and highest mean threshold. The mean detection threshold before and after the deployment period, respectively, were significantly different (paired t-test, t = 2.64, df = 6, P = 0.04).

Fig. 1. Mean Timing POrpoise Detector (T-POD) detection thresholds measured in an experimental set-up at four angles of incidence around the hydrophone before field deployment in this study (X-axis) and after seven months deployment (Y-axis) in a subsequent study. Stars mark three T-PODs that were lost before second calibration. The regression line signifies the shift in mean detection threshold per T-POD between the two calibrations.
The five indicators (number of encounters, encounter duration, waiting time, PPM and CPPM) were related to T-POD detection threshold and revealed that field performance correlated well with T-POD thresholds (Figure 2), although to different degrees for individual indicators. All correlations were tested with a GLM and showed that encounter duration (F-ratio = 6.59, P = 0.03) and PPM (F-ratio = 16.90, P = 0.003) correlated negatively with increasing detection threshold, while number of encounters (F-ratio = 4.14, P = 0.08) was not significantly correlated to detection threshold. Waiting time (log-transformed) correlated positively with T-POD detection threshold (F-ratio = 23.15, P = 0.001), while clicks per PPM did not correlate with T-POD detection threshold (F-ratio = 0.031, P = 0.9).
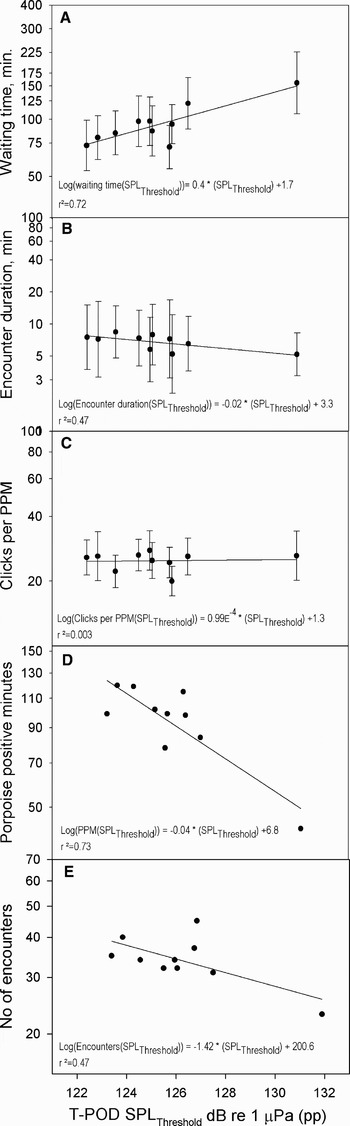
Fig. 2. The five porpoise indicators recorded in the field in relation to detection threshold for each Timing POrpoise Detector (T-POD). (A) Waiting time; (B) encounter duration; (C) clicks per porpoise positive minute (CPPM); (D) porpoise positive minutes (PPM); and (E) number of encounters as a function of T-POD detection threshold measured in a tank. Number of encounters and porpoise positive minutes are totals per T-POD for the study period, whereas encounter duration, waiting time and clicks per porpoise positive minutes are means per T-POD. The standard error of the mean (SEM) is largely due to the natural clumped occurrence of porpoises around the T-PODs at the study site. All parameters are built on clicks in the category ‘Cet All’ (see text).
The mean number of clicks (log-transformed) detected in the T-POD-simulation is shown in Figure 3 together with best fitting straight line. A straight line fitted to log10 (number of clicks) detected in the field (total number of clicks detected during the field calibration) showed that T-POD detection threshold could explain 77.4% of the variation (GLM, F-ratio = 21.36, P = 0.002) (Figure 3). The residuals of the regression were randomly distributed. The slope coefficients, b, of the model and field regressions were not significantly different (two tailed t-test, t = 0.77, t 0.001(2),17 = 3.965). The test was also performed excluding the 132 dB ‘outlier’ data points; two tailed t-test, t = 2.06, t 0.001(2),16 = 3.965 (Zar, Reference Zar1996, p. 355).

Fig. 3. Number of clicks detected as a function of the Timing POrpoise Detector (T-POD) detection threshold. Stars are field values and circles are modelled values. The model assumed a fixed porpoise source level of 205 dB re μPa (pp), and a beam pattern modelled on the properties of a circular piston (Au, Reference Au1993). The slopes are statistically similar (see text for details). Differences in intercept on the Y-axis between the two functions are due to the lower number of clicks put into the model as compared to the field trials.
DISCUSSION
The detection thresholds of the ten individual T-PODs were different and the differences increased over time. The directionality varied for each T-POD and this individual variation also increased over time. There was a significant correlation between total number of clicks detected in the field and T-POD detection threshold measured in the laboratory. Thus, the more sensitive a T-POD was in the laboratory (i.e. the lower the threshold) the more clicks were recorded by it in the field.
These findings have important implications for acoustic monitoring with T-PODs, since the detection range of a T-POD is intimately related to the detection threshold. Assuming equal background noise among a sample of T-PODs, then the lower the detection threshold of a T-POD is, the longer the detection range. Theoretically, changing the threshold from 117 dB re 1 µPa to 114 dB re 1 µPa will increase the detection range by 50 m (from 365 m to 415 m) and the detection area by 0.1 km2 (from 0.42 km2 to 0.54 km2), assuming spherical spreading at 130 kHz and a porpoise source level of 205 dB re 1 µPa (root mean square) at 1 m. For the ten T-PODs tested here, it means a theoretical difference in detection range from 550 m to 380 m and in detection area from 0.95 km2 to 0.45 km2 between the most and the least sensitive T-POD, respectively. Thus, seemingly small differences in detection threshold can have large consequences for the detection distance and hence the probability of detecting a porpoise.
The finding that detection threshold increased following a longer deployment period is critical in terms of consistency of T-POD results over time. We do not know what caused these changes in sensitivity but the most likely reason is changes in sensitivity of the hydrophone element due to physical impacts during deployment. Such impacts may alter the frequency specific sensitivity of the piezo-ceramic element, which may then influence the filter outputs in the detection process in the T-POD, thereby influencing T-POD detection threshold. The sensitivity changes could not be explained by differences in measurement accuracy or differences in background noise in the laboratory, and detection thresholds were measured at the same angles of incidence both times. It is of great importance that this drift in detection threshold over time is investigated further.
We tested five different statistical indicators extracted from T-POD recordings against detection threshold and found that effect of detection threshold could not be generalized for the different indicators. However, the three indicators (porpoise positive minutes, encounter and waiting time) that correlated with detection threshold did so in the same way, i.e. more sensitive T-PODs recorded values interpreted as higher porpoise activity (higher PPM, longer encounter durations and shorter waiting times). This means that data from more sensitive T-PODs compared to data from less sensitive T-PODs may be wrongly interpreted as the presence of more porpoises/more porpoise vocalizations or as arising from differences in porpoise activity, even though it is a function of differences in T-POD detection thresholds. Porpoise positive minutes and encounter duration correlated negatively with T-POD detection threshold. Both PPMs and encounter duration are derived from the number of clicks logged on a minute-to-minute scale. As porpoises are fast swimmers (mean of 1.5 m/s and maximum of 6 m/s (Teilmann, Reference Teilmann2000)), they can quickly swim in and out of the area around the T-POD where they can be detected and a T-POD of lower sensitivity is hence more likely to only detect parts of a click train emitted by a porpoise at greater distances from the T-POD. For encounters this means that they are shorter and may contain longer silent intervals and fewer clicks, which were also observed in this study (data not shown).
The number of clicks recorded per PPM on the other hand did not correlate with T-POD threshold. This parameter may be useful for comparisons of data from uncalibrated T-PODs, even though this is highly not recommended. As number of clicks recorded per PPM is calculated as total number of clicks logged divided by total number of PPM the found slope implies that click rates were similar at short and long distances from a T-POD and that porpoises were not more likely to buzz (produce click trains of very high repetition rates) at closer proximity to T-PODs. This indicates that T-PODs are able to pick up buzzes from porpoises at greater distances from the T-POD and not only from porpoises attracted to and therefore buzzing at the T-POD.
Information about T-POD detection thresholds and their relation to field performance is useful in all respects where T-POD indicators are used quantitatively to describe porpoise echolocation activity or abundance. Not knowing the detection thresholds of T-PODs only allows within-T-POD comparisons or carefully conducted BACI designs, where recordings before and after an impact and both inside and outside the impact area are obtained (e.g. Carstensen et al., Reference Carstensen, Henriksen and Teilmann2006). However, both within-T-POD comparisons and BACI designs will be influenced by changing sensitivity over time.
The variation in T-POD detection thresholds found in this sample of T-PODs was not evenly distributed. One T-POD was much less sensitive than the remaining nine. In order to evaluate the effect of this single insensitive T-POD, we built a model to mimic detection of porpoise clicks by a sample of T-PODs with a gradual variation in detection thresholds. The model simulated T-POD detections of porpoise clicks and successfully described the empirically derived correlation between T-POD detection thresholds and number of clicks recorded in the field. The fact that this relatively simple model could predict the slope of the correlation in the field affirms that differences in T-POD detection thresholds caused the observed differences in number of clicks detected in the field trial.
The T-POD contains a range of adjustable settings to optimize specificity and sensitivity. We kept all settings identical among the T-PODs through the study and did not test whether we could obtain the same field performance among the T-PODs by adjusting the sensitivity in the settings. This is a viable strategy for increasing comparability. However, since sensitivity can only be adjusted by lowering the level to that of the least sensitive T-POD, valuable data may be discarded, especially in cases where there is a large difference in detection thresholds among T-PODs.
Despite the presented differences among T-PODs we emphasize that the T-POD may be an efficient tool for passive acoustic monitoring of harbour porpoises, if carefully calibrated and the study set-up is thoroughly designed. It has for several years been the only tool available and has been used in a range of fields within the study of porpoise biology and behaviour (Cox et al., Reference Cox, Read, Solow and Tregenza2001; Koschinski, et al., Reference Koschinski, Culik, Henriksen, Tregenza, Ellis, Jansen and Kathe2003; Cox & Read, Reference Cox and Read2004; Carlström, 2005; Carstensen et al., Reference Carstensen, Henriksen and Teilmann2006, Verfuβ et al., Reference Verfuβ, Honnef, Meding, Dähne, Mundry and Benke2007). However, the threshold differences observed in this study are neither trivial nor exclusive for this sample of T-PODs, and emphasize the need for calibration. Calibrations can be performed in various ways; however, inter-calibrating T-PODs in the field in relation to one or more other T-PODs gives no comparability outside that specific chain of T-PODs. Given the need to compare porpoise densities over larger areas e.g. for designating ‘Special Areas of Conservation’ under the EU Habitats Directive it is critical to use comparable methods in monitoring. Comparability limited to within-study-comparisons is therefore not recommended. This method further has the disadvantage that if a single T-POD has to be replaced during the study the entire field calibration needs to be redone.
In order to be able to compare levels of activity and density estimates between studies and areas we need to:
(1) Calibrate T-PODs individually in a tank before use, using a documented method.
(2) Inter-calibrate T-PODs in the field.
(3) Maintain settings identical between calibrations and subsequent field study, or calibrate at all settings which are likely to be used during the study, since changing settings will also change detection threshold to an unknown degree.
(4) Calibrate T-PODs at regular intervals, minimum at the beginning and end of a study, to evaluate possible effects of detection threshold drift.
(5) Provide detailed information on T-POD and software versions, settings and calibration methods used.
ACKNOWLEDGEMENTS
This study was made possible through financial support from Aage V. Jensen's Foundations and the Danish Ministry of Environment, Forest and Nature Agency. Signe Sveegaard and Rasmus Gregersen are thanked for support and help in the field. Nick Tregenza is thanked for help and advice, and for constructive comments on earlier drafts of this paper. Finn Larsen and Roy Weber are thanked for comments on an earlier draft of this paper. Anne Villadsgaard is thanked for providing measurements of porpoise source levels from the field.


