INTRODUCTION
Although ecologists have been studying species assemblages for decades, information on the structures of coastal and pelagic communities remains scarce (Verity & Smetacek, Reference Verity and Smetacek1996; Thiebot & Weimerskirch, Reference Thiebot and Weimerskirch2013). The distributions of marine birds and cetaceans are determined by their associations with specific physical and biological processes, at distinct spatial and temporal scales (Hunt & Schneider, Reference Hunt, Coyle, Hoffman, Decker and Flint1987; Jaquet & Whitehead, Reference Jaquet and Whitehead1996; Hyrenbach & Veit, Reference Hyrenbach and Veit2003). These upper-trophic-level marine predators associate with specific water masses, hydrographic fronts (convergence and divergence zones), and other mesoscale features (reviewed by Hunt & Schneider, Reference Hunt, Coyle, Hoffman, Decker and Flint1987; Schneider, Reference Schneider1991; Jaquet, Reference Jaquet1996; Croll et al., Reference Croll, Tershy, Hewitt, Demer, Fiedler, Smith, Armstrong, Popp, Kiekhefer, Lopez and Urban1998). Horizontal gradients in water density and the degree of vertical stratification promote the aggregation of swimming prey in the proximity of these discontinuities, providing enhanced feeding opportunities for many marine predators (Hunt et al., Reference Hunt, Mehlum, Russel, Irons, Decker, Becker, Adams and Slotow1990, Reference Hunt, Harrison and Cooney1996, Reference Hunt, Russel, Coyle and Weingartner1998; Franks, Reference Franks1992; Ribic & Ainley, Reference Ribic and Ainley1997; Spear et al., Reference Spear, Balance and Ainley2001). Foraging seabirds and cetaceans are also associated with bathymetric features, such as shallow banks and continental shelf-slope regions (Hunt & Schneider, Reference Hunt, Coyle, Hoffman, Decker and Flint1987; Hunt et al., Reference Hunt, Harrison and Cooney1996; Baumgartner et al., Reference Baumgartner, Mullin, May and Leming2001). In particular, continental shelf breaks and slopes appear to be highly productive habitats, which frequently support high densities of marine predators (Briggs et al., Reference Briggs, Tyler, Lewis and Carlson1987; Schoenherr, Reference Schoenherr1991; Springer et al., Reference Springer, McRoy and Flint1996; Croll et al., Reference Croll, Tershy, Hewitt, Demer, Fiedler, Smith, Armstrong, Popp, Kiekhefer, Lopez and Urban1998).
Cetaceans and seabirds are top-level predators that serve as sentinels of the health and status of lower trophic levels in the marine ecosystem. They are therefore considered as key species in terms of monitoring and the implementation of marine conservation planning, and have often been used to promote the designation of reserve areas (Hooker & Gerber, Reference Hooker and Gerber2004). Examination of areas of overlap among foraging habitats of different predators, together with a basic knowledge of their diets, the broader ecosystem and habitat variability should therefore allow the identification of hotspot features (Hooker & Gerber, Reference Hooker and Gerber2004).
Seabirds have been shown to use the presence of hunting marine mammals as a means of detecting and accessing prey patches. However, although these associations have been documented locally, e.g. in the Ebro delta (Witt et al., Reference Witt, Stempel, De Juana and Varela1982) and the Lagamar estuary (Santos et al., Reference Santos, Oshima, Pacífico and Silva2010), their relevance at the ecosystem level remains unknown, mainly because they constitute relatively rare events or are difficult to detect (Thiebot & Weimerskirch, Reference Thiebot and Weimerskirch2013). At large spatial scales, seabird prey items are not always accessible near the sea surface, and it has been well-documented that most seabirds seem to search actively for physical features, such as upwellings or oceanic frontal zones and shallow areas (Schneider, Reference Schneider1991; Hunt et al., Reference Hunt, Schneider and Croxall1999; Bost et al., Reference Bost, Cotté, Bailleul, Cherel, Charrassin, Guinet, Ainley and Weimerskirch2009) that increase the accessibility of the target species near the surface. Nevertheless, the means by which seabirds locate and access prey patches that may occur several metres below the surface at smaller spatial scales remain unknown. It was recently suggested that marine mammals and seabirds may show commensalism in some areas when foraging at sea (Thiebot & Weimerskirch, Reference Thiebot and Weimerskirch2013). Analysis of stomach contents revealed that fish and cephalopods were the major components of the diet of both dolphins and seabirds, particularly the fish species Sardinia pilchardus, Merluccius merluccius and Belone belone, and the cephalopods Histioteuthidae sp., and some species of Sepidiaee and Ommastrephidae (Astruc, Reference Astruc2005; Petry & Krüger, Reference Petry and Krüger2009; Alonso et al., Reference Alonso, Granadeiro, Paiva, Dias, Ramos and Catry2012).
The biodiversity of the marine ecosystem is changing rapidly as a result of climate change and human impacts, and specific measures to protect species and ecosystems are currently inadequate (Piraino et al., Reference Piraino, Fanelli and Boero2002). Identification of foraging hotspots for predators, and the consideration of boundaries determined by oceanographic processes, are therefore pivotal to addressing the preservation of marine ecosystems. Many policies to date have been designed to protect cetaceans and seabirds. Among these, the Habitat Directive and the Birds Directive oblige all European member states to select, designate, and protect sites that support certain natural habitats or species as Special Areas of Conservation (SACs) and Special Protection Areas (SPAs, specifically aimed to the conservation of vulnerable birds species), with the aim of creating a network of protected areas across the European Union known as Natura 2000 (http://ec.europa.eu/environment/nature/natura2000/index_en.htm) (European Commission 2008, 2009). However, the management of organisms that exhibit large spatial and temporal changes in distribution, such as cetaceans and seabirds, requires knowledge of their distributions and habitat preferences.
In this study, we conducted visual surveys in the central Tyrrhenian Sea between June 2013 and October 2014 with the aim of filling the knowledge gap regarding the presence of top predators in this coastal area. Sightings were analysed by geostatistical kriging, a technique previously used to obtain distribution maps of marine mammals (Alessi & Fiori, Reference Alessi and Fiori2014), to evaluate the areas with the highest occurrences (high-presence areas) of bottlenose dolphins (Tursiops truncatus) (Montagu, 1821) and the seabirds Audouin's gull (Larus audouinii) (Payraudeau, 1826), Yellow-legged gull (Larus michahellis) (Nauman, 1840), Yelkouan shearwater (Puffinus yelkouan) (Acerbi, 1827) and Cory's shearwater (Calonectris diomedea) (Scopoli, 1769). The underlying assumption was that high-presence areas are of fundamental importance within a given zone, supporting non-random associations of megafauna species. We also aimed to highlight the possible relationships between the presence of the target species and environmental features, in order to provide tools that could be used to predict the distribution of top-level predators at unobserved sites (Franklin, Reference Franklin2009).
MATERIALS AND METHODS
Data collection
The study area was located between Civitavecchia and Montalto di Castro along the Central Tyrrhenian coast. This area extends from 42.00° to 42.40°N and 11.20° to 11.80°E, and covers an area of 580 km2. The continental shelf extends for 20 km from the coast (Figure 1).

Fig. 1. Map of the study area showing Fiora and Mignone river basins (blue lines) and 50-m isobaths (black lines).
Data were collected between June 2013 and October 2014 using eight linear transects covering 513 km, involving 60 h of observations (Figure 2). Observations were made from a 10-m-long sailing boat, equipped with an 28-horsepower inboard engine. A linear systematic sampling design at an average speed of 6 knots was followed, and the transects were designed to cover the greatest possible distance in a day. All surveys were carried out in good sea conditions (Beaufort scale ≤3) and with good visibility. Survey effort was concentrated within water up to 150 m deep. Three trained observers scanned 360° around the boat, with and without binoculars. The real-time position of the vessel was recorded by GPS every 4 s. The geographic positions of bottlenose dolphins and seabirds were recorded when sighted, and the numbers of individuals of each species were counted (expressed as minimum, maximum and best-estimation number, the latter indicating the most likely number of individuals). Only seabirds exhibiting foraging behaviours were included in the analysis. Individuals were considered to be foraging when at least one individual was seen in contact with food, and other individuals were flying around at close distance. Seabirds in sustained flight were excluded from the analysis. Dolphin feeding behaviour was defined according to Bearzi et al. (Reference Bearzi, Politi and Notarbartolo di Sciara1999): a dolphin feeding session was characterized by dives lasting 3–5 min, and occasionally up to 8 min. It was not possible to estimate the number of fish in a baitball, and only their geographic positions were therefore recorded.
Fig. 2. Sampling design. Four linear transects at different depths are shown, each transect was followed twice.
Data analysis
kriging. Kriging is a technique initially developed for the earth sciences and subsequently applied in different scientific fields for non-stationary spatial and temporal variables, including in medicine (epidemic diffusion) (Carrat & Valleron Reference Carrat and Valleron1992), physics (sound propagation) (Baume et al., Reference Baume, Gauvreau, Bérengier, Junker, Wackernagel and Chilès2009) and biology. In biological contexts, kriging has been applied to define species densities and identify high-presence and high-use areas (Steffens, Reference Steffens and Soares1993; García & Dawson, Reference García and Dawson2003; Rufino et al., Reference Rufino, Maynou, Abelló, Gil de Sola and Yule2005; Monestiez et al., Reference Monestiez, Dubroca, Bonnin, Durbec and Guinet2006; Alessi & Fiori, Reference Alessi and Fiori2014). This technique can be applied to all species that do not exhibit static behaviour, including cetaceans and seabirds, and can be used to obtain accurate and unbiased high-resolution maps (Alessi & Fiori, Reference Alessi and Fiori2014). Bottlenose dolphins and the seabird species considered in this study have similar prey preferences, in terms of both species and size, e.g. juvenile S. pilchardus and M. merluccius (Blanco et al., Reference Blanco, Salomon and Raga2001; Astruc, Reference Astruc2005; Bourgeois et al., Reference Bourgeois, Vorenger, Faulquier, Legrand and Vidal2011). We also applied the kriging approach to mapping baitballs at the surface, in order to visualize areas of potential-prey presence. The resulting distribution maps for the target species and potential prey species were superimposed to detect areas of overlap that may help to identify highly productive coastal areas with high biodiversity, able to support the simultaneous presence of several top predators feeding on the same prey stocks.
We used the approach described by Alessi & Fiori (Reference Alessi and Fiori2014). The study area was superimposed on a grid with 1 × 1 km2 cells using Mapinfo GIS software. The coordinates (latitude/longitude) of the centre of each cell were extracted and the numbers of sightings of bottlenose dolphins, seabirds (without distinction of species) and baitballs were determined, resulting in three datasets. In contrast to Alessi & Fiori (Reference Alessi and Fiori2014), we used the number of sightings instead of encounter rate, considering that the sampling effort was uniform throughout the study area. Datasets were analysed separately by ordinary kriging using Surfer® software (Golden Software Incorporation, Golden, CO, USA), which automatically generates an experimental variogram. Kriging is a generalized least-square regression technique that allows description of the spatial prediction and provides a measure of predicative error (Gan et al., Reference Gan, Chen, Cai, Zhang, Feng and Xie2010). The ordinary kriging formula can be expressed as follows (ESRI, 2001):
 $$Z(s) = \mu + \varepsilon (s)$$
where s = (X, Y) is a location and Z(s) is the number of sightings at that location. The model is based on a constant mean μ for the data and random errors ε(s) with spatial dependence. Kriging is an exact interpolator based on the weighted average of the observed data to estimate Z(s) function, where s(X, Y) is a generic point of plain to estimate, from a number of known values, close together. The interpolation formula can be expressed as follows:
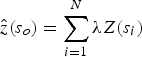 $$\hat z(s_o) = \sum\limits_{i = 1}^N {\lambda Z(s_i )}$$
where (s 0) is the measured number of sightings at the i th location; λ i is the weight of the measured value Z(s ↓i) at the location; s 0 is the prediction location; and n is the number of measurements used for the estimate (Alessi & Fiori, Reference Alessi and Fiori2014).
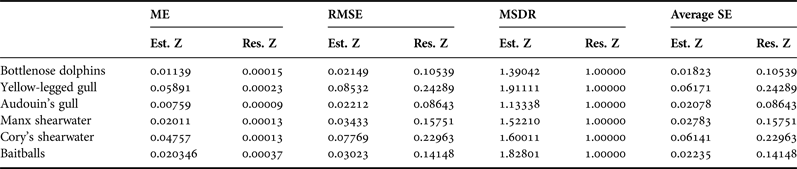
Surfer generates an experimental variogram using an input dataset with geographic coordinates corresponding to the position value of the variable z. The variogram plays an important role in the appearance and behaviour of the resulting model (Gringarten & Deutsch, Reference Gringarten and Deutsch2001). In this study, we chose the model type visually and assessed it statistically using cross-validation statistics, as described by Alessi & Fiori (Reference Alessi and Fiori2014). We checked the accuracy of the model by evaluating the mean error (ME), the goodness of the prediction method (precision) by the root mean square error (RMSE), and compared predicted and real errors by the mean squared deviation ratio of residuals with kriging variance (MSDR).
The chosen models were used to create an image map in Surfer. The raster image was subsequently georeferenced using Mapinfo Professional using the data limits supplied by Surfer. The extent of habitat overlap between bottlenose dolphins and seabirds was calculated by superimposing their computed presence areas. The presence of baitballs generated by the kriging method was also added to identify the distribution and extent of biodiversity and productivity habitat hotspots.
Habitat preferences
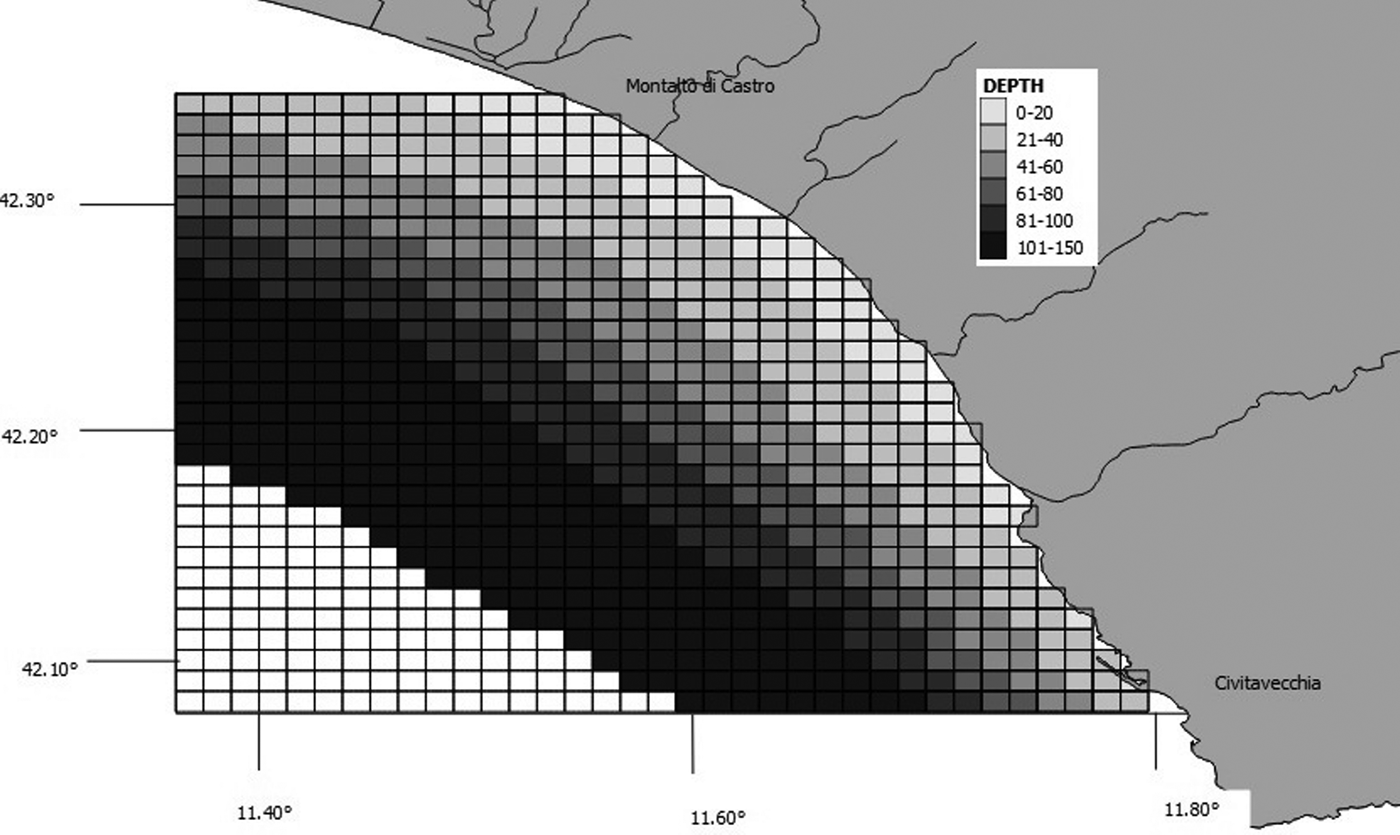
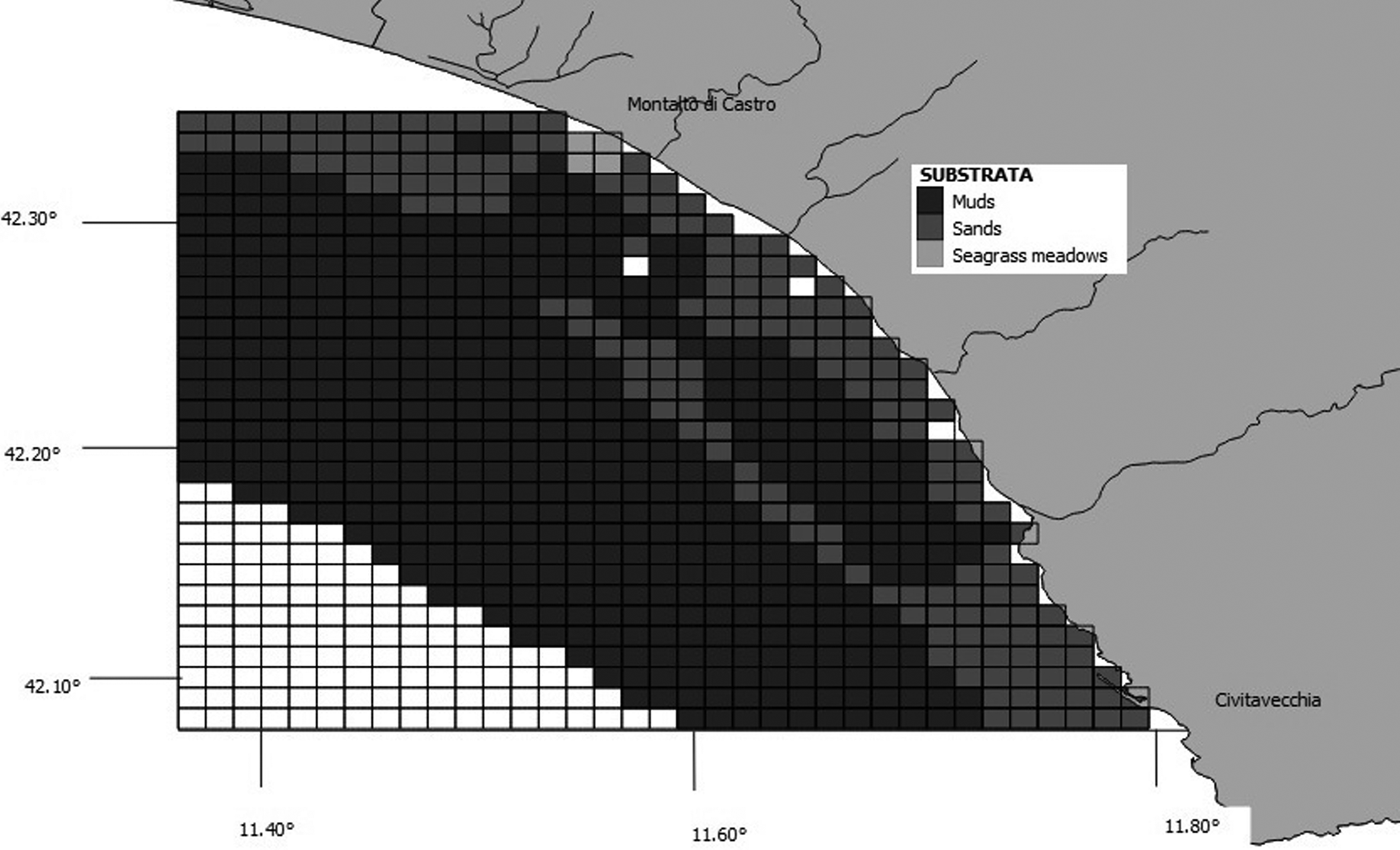
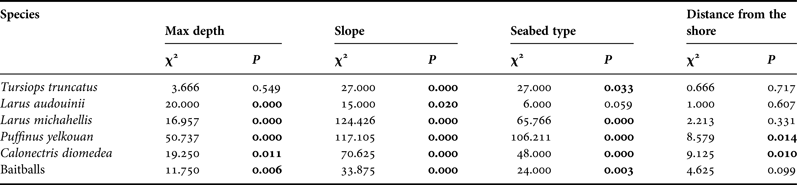
Species–habitat relations were tested using chi-squared analysis, as described by Ingram & Rogan (Reference Ingram and Rogan2002). The values of maximum depth, slope, seabed type and distance from the shore were determined for each grid cell created using GIS Mapinfo. We considered six depth classes and the cells were classified accordingly as: 0–20 m, 21–40 m, 41–60 m, 61–80 m, 81–100 m or 101–150 m (Figure 3). Slope was calculated based on the difference between maximum and minimum depth, and assigned to one of seven classes: 0, 1–5 m, 6–10 m, 11–15 m, 16–20 m, 21–25 m and 26–30 m (Figure 4). We downloaded the data related to the type of substrate from the catalogue EUSeaMap (http://jncc.defra.gov.uk/euseamap) (Figure 5). Cartography was subsequently georeferenced using Mapinfo. The distance from the shore for the centre of each cell was calculated using the MapInfo tool ‘Distance Calculator’. For each category, the total number of sightings of a single species and of baitballs was calculated as the sum of the number of sightings for cells with the same range of maximum depth, slope, seabed type and distance from the shore. For each parameter, the distribution of sightings (observed distribution) within the various classes was compared with a uniform distribution (expected distribution).
Fig. 3. Map showing grid cells and corresponding bathymetric bands.
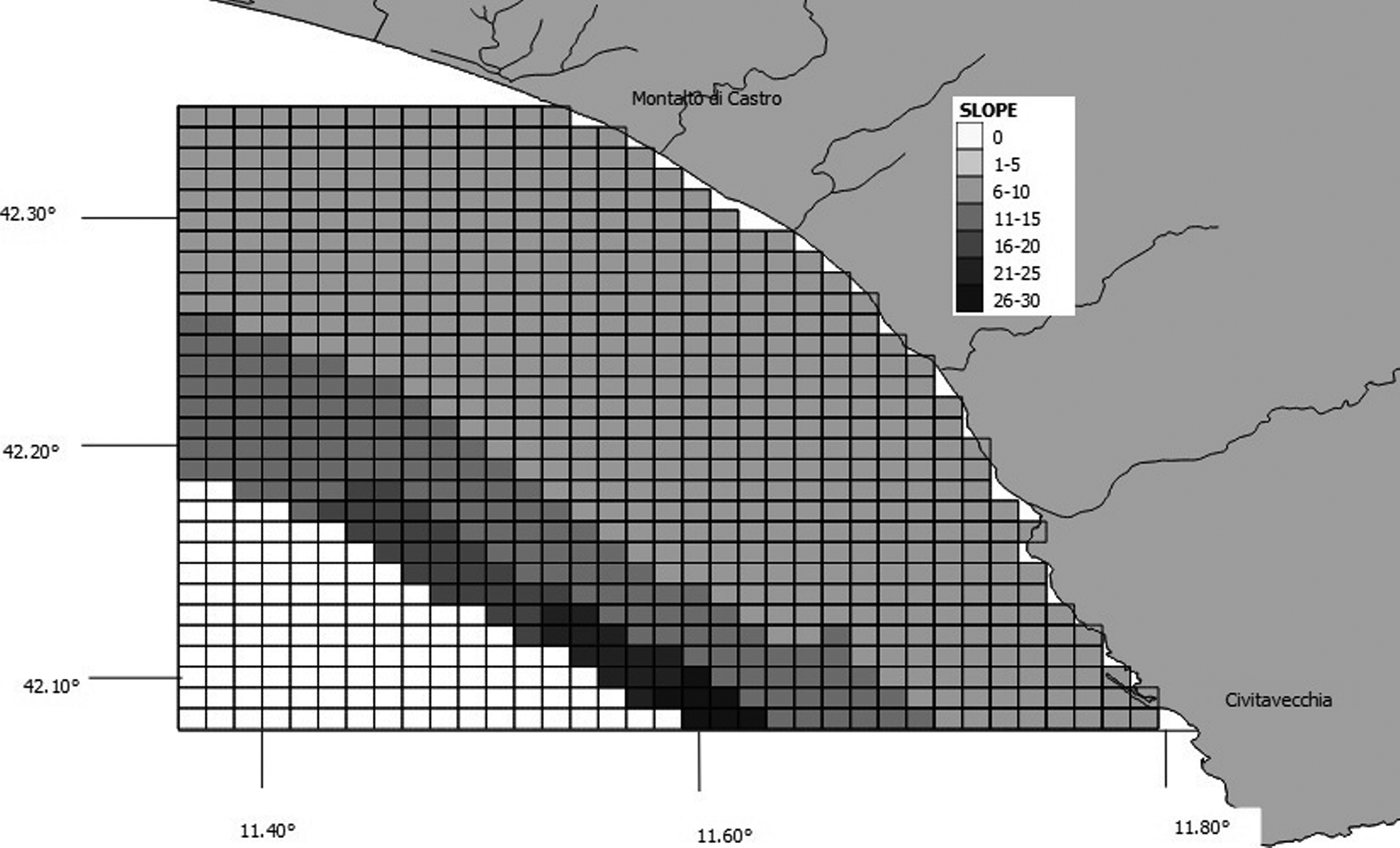
Fig. 4. Map showing grid cells and corresponding slope classes.
Fig. 5. Map showing grid cells and distribution of substrata. Copyright JNCC. EUSeaMap: http://www.jncc.gov.uk/EUSeaMap. Information contained here has been derived from EUSeaMap Consortium webGIS data (http://www.jncc.gov.uk/page-5040) which is made available under the pilot project for the European Marine Observation Data Network (EMODnet), funded by the European Commission's Directorate-General for Maritime Affairs and Fisheries (DG MARE).
RESULTS
Sightings
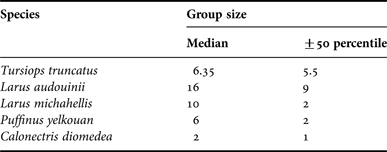
During the transects, we made eight sightings of bottlenose dolphin, 47 of Yellow-legged gull, six of Audouin's gull, 38 of Yelkouan shearwater, 16 of Cory's shearwater and 24 baitballs. Group sizes differed among species (Table 1). The number of sightings of seabirds only refers to foraging seabirds. However, although dolphins in three of the eight sightings were not foraging, we included all eight sightings because of the small sample size.
Table 1. Group size of each study species. Median ±50 percentile are listed.
Presence areas
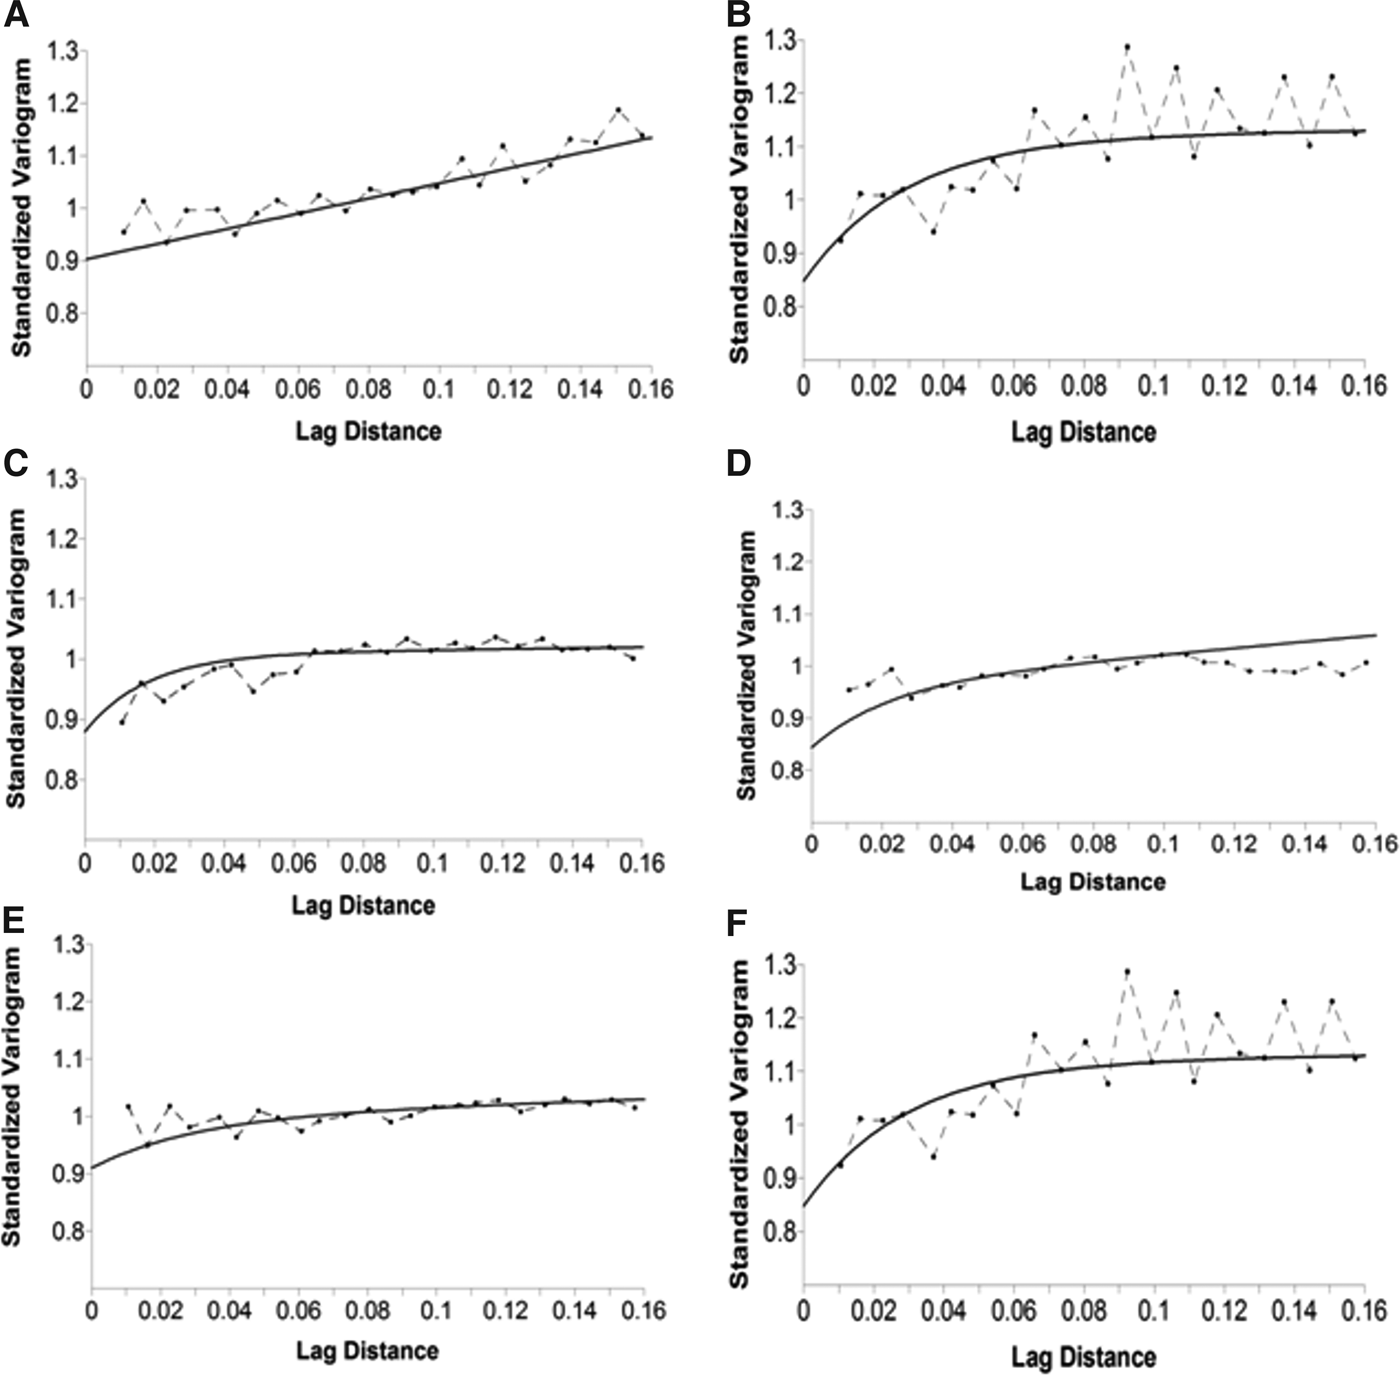
We calculated the presence areas for each species and for baitballs. All the resulting variograms reached a limit value as the lag distance increased, indicating that the function represented by the variogram was stationary or near stationary. We fitted the variograms using exponential and linear models in all five cases. In every case the two models were combined into a single model to generate the best fit for the data (Figure 6). The results of cross-validation analysis are shown in Table 2. All the results indicated that the model was valid and could thus be used to construct the map (Figure 7). The bottlenose dolphin map showed a well-defined presence in front of Montalto di Castro, in waters of 20–70 m depth, accounting for an area of 276 km2. Yellow-legged gulls were almost uniformly distributed, but were most frequent in front of Montalto di Castro and the harbour at Civitavecchia. The map for Audouin's gull showed two well-defined presence areas with a total extent of 67 km2, in waters of 10–40 m depth. The Yelkouan shearwater map also showed two well-defined presence areas, with the main area in front of Montalto di Castro, at a depth of 40–150 m, covering 174 km2. Cory's shearwaters showed a larger presence area (268 km2) extending parallel to the coast over the whole study area, with a depth range of 50–150 m. The map for baitballs showed that they were patchily distributed over a total area of 320 km2, with the highest occurrence in front of Civitavecchia and at the mouth of the Fiora river. The computed areas for dolphins, seabirds and baitballs overlapped by 57%, while those for dolphins and baitballs overlapped by up to 61% (Figure 8).
Fig. 6. Empirical variograms of species datasets (dashed line and dot) and fitted curve (black line) for (A) bottlenose dolphin; (B) Audouin's gull; (C) Cory's shearwater; (D) Yellow-legged gull; (E) Yelkouan shearwater; and (F) baitballs.
Fig. 7. Map showing the areas of species presence obtained by kriging analysis. The colour scale shows different probabilities of encounters with (A) bottlenose dolphin; (B) Audouin's gull; (C) Cory's shearwater; (D) Yellow-legged gull; (E) Yelkouan shearwater; and (F) baitballs.
Fig. 8. Map showing overlap between baitball (yellow) and bottlenose dolphin areas (light blue). The river basins are shown (blue lines).
Table 2. Cross-validation statistics of bottlenose dolphins, seabirds and baitball datasets: Mean Error of Residual Z (ME) must be close to zero indicating the accuracy of the model; Root Mean Square Error of residual (RMSE) must be close to zero to confirm the precision of the model; and Mean Squared Deviation Ratio of residuals (MSDR) must be close to one to show that the prediction model is unbiased. If the RMSE value is close the average SE value, the Z values were predicted correctly (with high accuracy).
Habitat preferences
Bottlenose dolphins were more frequently associated with muddy substrates and gentle slopes (6–10 m) (Table 3). Yellow-legged gulls, Yelkouan shearwaters and Cory's shearwaters also foraged significantly more frequently over muddy substrates. However, the seabird species appeared to be affected differently by depth: Yellow-legged gulls and shearwaters mostly ranged from 100–150 m depth, while Audouin's gulls preferred waters of 20–40 m depth. Moreover, all seabirds species were associated with seabed slopes of 6–10 m (Table 3). Only Yelkouan and Cory's shearwaters were significantly affected by distance from the shore, being observed at 10–20 km. Baitballs were significantly more frequent at depths of 20–40 m, and over gentle slopes (6–10 m) and muddy substrates.
Table 3. Results of χ2 test with significance level of 5% (P = 0.05) highlighted in bold.
DISCUSSION
Assessing the extent of spatial overlap between marine top predator habitats allows us to understand the distribution and locations of local biodiversity and productivity hotspots. In the current study, the baitball map showed two well-defined areas of presence, one of which was located in front of Sant'Agostino village, coincident with an offshore fish farm. Residual food from fish-farm cages is known to attract wild fish species (Díaz López et al., Reference Díaz López, Marini and Polo2005) such as grey mullet (Mugil cephalus), salema (Sarpa salpa) and pilchards (S. pilchardus). Notably, the overlap between dolphin, seabird and baitball areas covered approximately 295 km2, including an overlap between dolphin and baitball areas of 61%. This suggests that the area of overlap may represent an important feeding spot for bottlenose dolphins, even though this species can also easily access other deep-living prey items that are not visible from the surface. Compared with dolphins, seabirds rely more on prey near the water surface. The areas mapped for Cory's shearwater and Yellow-legged gull almost totally covered the areas for baitballs. Further, seabird areas appeared to extend between the two main baitball areas, suggesting the presence of an ecological corridor between two foraging sites.
Dolphin and seabird foraging were most frequent at the mouths of the two most important river basins in the area, the Fiora and Mignone. This is in agreement with previous studies that documented high numbers of bottlenose dolphins at the mouths of rivers, such as the Magra river (Ligurian Sea) (Alessi & Fiori, Reference Alessi and Fiori2014), the Shannon estuary (Ireland's west coast) (Ingram & Rogan, Reference Ingram and Rogan2002) and the Lagamar Delta (Brazil) (Santos et al., Reference Santos, Oshima, Pacífico and Silva2010). Rivers play an important role, at a small scale, in affecting water temperature and salinity values and in defining sediment distribution. Nutrient loads from rivers, together with local variations in temperature, can produce algal blooms and subsequent secondary production processes, which can in turn sustain animals at higher trophic levels.
The results of this study highlight the presence of concentrations of species at various levels of the trophic chain, including the coexistence of different marine top predators. As reported by Ingram & Rogan (Reference Ingram and Rogan2002) for other locations, the identification of foraging sites for top predators is fundamental in defining critical areas for the implementation of specific protection measures, while also recognizing that these areas may represent important foraging sites for breeding seabirds, not far from their nesting sites (Cecere et al., Reference Cecere, Gaibani and Imperio2014). Shearwater foraging and breeding areas were shown to be closely related at Mediterranean colonies (Linosa island, La Maddalena and Tuscan Archipelagos), given that the period of parental care lasts for about 3 months (Burger, Reference Burger, Burger, Olla and Winn1980), and the presence of suitable foraging areas is crucial for offspring survival. Consequently, the depletion of foraging areas would force adults to seek new nesting areas, or lead to the local extinction of breeding colonies (Cecere et al., Reference Cecere, Gaibani and Imperio2014).
The areas more frequented by the study species were associated with different environmental characteristics. The distribution of bottlenose dolphins was affected by the presence of a muddy seabed, while the other variables had no significant influence. This might be an indirect effect of hake distribution, which is also associated with a muddy seabed (Sinopoli et al., Reference Sinopoli, Fanelli, D'Anna, Badalamenti and Pipitone2012) and is the most abundant prey item of bottlenose dolphins in terms of biomass, based on an analysis of stomach contents (Astruc, Reference Astruc2005). However, the small sample size means that further studies are needed to confirm these preliminary results.
Recent studies have used predictive models to estimate bottlenose dolphin distributions, e.g. Generalized Additive Models and Generalized Linear Models, using depth, slope and distance from the coast as static variables, and including other dynamic factors such as sea surface temperature (SST), sea surface salinity (SSS) and chlorophyll a (Canadas et al., Reference Canadas, Sagarminaga and Garcia-Tiscara2002; Azzolin et al., Reference Azzolin, Galli, Giacoma, Giovannini, Ronchetti and Papale2011; Arcangeli et al., Reference Arcangeli, Marini and Crosti2013). These studies showed that bottlenose dolphins displayed heterogeneous habitat choices in different areas. Unfortunately, we did not have access to high-resolution data for SSS, SST and chlorophyll a for our small coastal study area, and we were therefore only able to analyse the static variables. Our study identified seabed type and slope as the only significant factors affecting bottlenose dolphin distribution. Regarding seabirds, Yellow-legged gulls and shearwaters were associated with a specific depth range (50–150 m) and muddy substrate, in accord with the ecological features of these species as generalist feeders on pelagic fish and some cephalopods that inhabit deep, muddy seabeds (Quetglas et al., Reference Quetglas, Alemany, Carbonell, Merella and Sànchez1998). The presence of Audouin's gulls was not affected by seabed type, but they preferred gentle slope (6–10 m) and 20–40 m depth. Audouin's gulls have a very selective diet, feeding on clupeids known to be present within this depth range (Oro, Reference Oro and Ogilvie1998). Notably, all the parameters that affected baitball distribution also affected most of the study species, suggesting that the distribution of top predators was directly linked to both the presence and distribution of the baitballs, as well as to the geomorphological features. The distribution of top predators has been shown to reflect prey abundance, especially when the distributions of more than one top predator overlap (Ballance et al., Reference Ballance, Pitman and Reilly1997). Because seabirds and dolphins are highly mobile species, they are able to choose highly productive areas (Ballance et al., Reference Ballance, Pitman and Reilly1997). Furthermore, seabirds and cetaceans share several features that affect their relationships with oceanographic characteristics and water masses. Although the mechanisms responsible for species–habitat associations are not completely understood, it is known that the relationships between seabirds, cetaceans and environmental characteristics may be indirect, likely mediated by the responses of their prey to these environmental features (Ballance et al., Reference Ballance, Pitman and Fiedler2006).
Previous studies have indicated that marine mammals and seabirds not only use a small set of locations but also a limited range of tidal conditions, within which they capture their prey (Johnston et al., Reference Johnston, Westagate and Read2005; Bertrand et al., Reference Bertrand, Gerlotto, Bertrand and Gutierrez2008; Stevick et al., Reference Stevick, Incze, Kraus, Rosen, Wolff and Baukus2008). Most fish that are prey for cetaceans are, in turn, also predators and their behaviour thus switches between escape from predators and their own feeding needs (Scott et al., Reference Scott, Sharples, Ross, Wang, Pierce and Camphuysen2010). The study of top predators and their relationships can thus help us to understand the statuses of populations at different trophic levels, and consequently to make inferences at the ecosystem level regarding the protection of ecologically relevant areas. From a conservation perspective, the study of static habitat features could provide an initial basis for identifying potentially important areas of coastal systems that deserve protection through the designation of wildlife reserves (Yen et al., Reference Yen, Sydeman and Hyrenbach2004).
The results of kriging analysis appeared to be consistent with the ecological characteristics of the study species and with previous studies. This approach, applied at a local level in the current study, thus seems to represent a promising tool for addressing the conservation issues of Mediterranean coastal marine ecosystems in terms of larger-scale surveys with bigger sample sizes.
ACKNOWLEDGEMENTS
This work formed part of a Master's thesis in Nature Conservation carried out by Valentina Cafaro. We are grateful to Marco Marcelli for support with data analysis and thesis co-supervision, to Enzo Savo and Emiliano De Santis for help in field identification of seabirds during some transects. We also thank Carlo Catoni for useful information on shearwater movement ecology. The authors are grateful to all the people involved in the surveys, in particular to Paolo Cipriani, Alessandro Carlini, Riccardo Vela, Anastasia Pintavalle and Sara Canensi.
CONFLICT OF INTEREST
None.