


INTRODUCTION
Spawning strongly influences the meat yield of mussels through the loss of large proportions of the mantle tissue. The spawning is also predictive for the subsequent spat settlement. Understanding the spawning process is therefore crucial for the mussel farming industry.
During gonad maturation in the common blue mussel, Mytilus edulis, the reproductive tissue expands and invades the soft tissues in the visceral mass and mantle lobes (Field, Reference Field1922). In mature individuals, the reproductive tissue may represent as much as 59% of the soft tissue weight (Thompson, Reference Thompson1979), or up to 95% of the mantle tissue (Seed, Reference Seed1969).
Series of condition index data are easy to obtain and provide relevant information about the spawning patterns of mussels, seen as steep declines in condition (Seed & Suchanek, Reference Seed, Suchanek and Gosling1992). Condition does however not only reflect the amount of gametes, since variable amounts of storage tissue also fill the mantle. From an industry and marketing point of view, this distinction is of great importance, since there is no risk of spawning and loss of quality for example during autumn if storage tissue and no ripe gametes fill the mantle. To determine the stage of filling and reproductive state of the mussels, histological studies provide additional and valuable information.
Large areas along the coast of Western Norway may be suitable for mussel production. With only a few publications with limited details (Bøhle, Reference Bøhle1965; Barkati & Ahmed, Reference Barkati and Ahmed1990), mussel reproduction has however been poorly documented in Norwegian waters. Numerous studies have been performed in other European areas (Seed, Reference Seed1975; Pieters et al., Reference Pieters, Kluytmans, Zandee and Cadee1980; Sprung, Reference Sprung1983; Okumus & Stirling, Reference Okumus and Stirling1998; Orban et al., Reference Orban, Di Lena, Nevigato, Casini, Marzetti and Caproni2002; Thorarinsdottir & Gunnarsson, Reference Thorarinsdottir and Gunnarsson2003), but as there are large geographical variations in mussel reproduction (Seed, Reference Seed and Bayne1976; Newell et al., Reference Newell, Hilbish, Koehn and Newell1982), data from other areas may not be relevant to the areas in Western Norway.
Norwegian mussel growers often report higher meat yield in mussels during their first spring compared to their second spring, and it has been suggested that the spawning patterns of these two age-classes differ. Earlier studies have suggested that all mussels mature during their first year (Seed, Reference Seed1969). Seed (Reference Seed1975) found that there were no major differences in the spawning patterns between small and large mussels, based on the different sizes of mussels present in the samples studied. However, in practical rope culture of mussels, the age-classes are often quite well separated; especially the last year's set, which is collected on ropes set out the same year. Even quite small differences in meat yield or the timing of spawning would be of interest for the mussel industry, in particular if immature but fast growing market sized mussels can be harvested in early summer when the older mussels are spent.
The aim of the present work was to compare sexual maturation and spawning and also condition in one and two year old mussels. A study of condition index and histology of the mantle tissue was carried out from April through to December, and development of gonad and storage tissue was described.
MATERIALS AND METHODS
The mussels originated from a longline mussel farm near Brekke in the outer Sognefjord, Western Norway. From there, the mussels were moved to the study site in Sogndalsfjorden (N61° 12.8′ E7° 05.6′) in the inner part of the Sognefjord. One year old mussels were harvested from collections that were mounted during spring 2001, and therefore contained no older mussels. They were transported to the study site in two batches, with 4200 mussels on 12 January and 9000 mussels on 12 April 2002. Two year old mussels had been collected during 2000 and were separated by size from the new set during the autumn 2001. 9200 of these mussels were transported to the study site on 10 March 2002. Both age groups were socked in Pergolari type socks (Intermas, Spain) of five to six metres length at densities between 230 and 600 mussels per metre, with averages of about 400 mussels per metre for both age groups. The average initial biomass densities were 1.7 and 5.1 kg/m for the one and two year old mussels respectively. The spat that settled on the experimental socks during the study period in 2002 was removed by size grading and resocking of both age groups in August 2002.
Mussels were sampled at 14 day intervals from 2 April to 26 September 2002, and an additional sample was taken on 2 December. Mussels were sampled from different areas of several socks covering all depths, altogether 150 mussels from each age-class, and all mussels within one area of a sock were collected to avoid size selection. The mussels were then transported chilled within 24 hours to the laboratory in Bergen and placed in seawater of 34‰ for 24 hours or more before further processing.
At each sampling, approximately 90 mussels from each age-class were cleaned, weighed and cooked by steaming for determination of condition index. The duration of the steaming was regulated by the boiling of the water, letting the pan boil over and letting out steam by lifting the lid three times repeatedly. Condition index (CI) was calculated according to a formula from Hickman & Illingsworth (Reference Hickman and Illingworth1980) that facilitates comparison of mussel groups with differences in shell thickness, modified to using steamed wet weight of the meat. The formula resembles the expression of meat volume as a fraction of the shell cavity volume:
The commercial meat yield (MY) was also taken for comparison:
The mussels were kept in seawater before cooking to avoid loss of mantle water. The cooked soft tissue was stored at −20 degrees for analysis of glycogen. Glycogen was analysed using an enzymatic and spectrophotometric method as described by Hemre et al. (Reference Hemre, Lie, Lied and Lambertsen1989).
Samples for histology were taken from between 18 and 32 mussels on each date of sampling. 2 × 2 mm pieces of mantle tissue were fixed in a phosphate buffered modified Karnovsky fixative adjusted to pH 7.4, where distilled water was replaced with the following Ringer's solution: 9.0 g NaCl, 0.14 g KCl, 0.12 g CaCl2, 0.2 g NaHCO3 and 2.0 g glucose in 1 l distilled water. Osmolarity was adjusted by adding sucrose to 9%. The samples were kept in fixative at room temperature for three weeks or longer, washed in a phosphate buffered sucrose solution, dehydrated through a graded series of ethanol and embedded in plastic resin (Technovit, Germany). Semithin sections (1–2 µm) were stained with 1% toluidine blue and observed in a light microscope (Olympus BX-51, Japan) at 200 to 1000 x magnification. The sections were visually categorized according to sex, gonad development and development of the two types of storage tissue: vesicular connective tissue (VCT) with glycogen stores and adipogranular tissue (ADG) with protein and lipid stores, as described below.
Classification of gonad developmental stages
The gonad development was described according to the terms used by Field (Reference Field1922), Dohmen (Reference Dohmen, Verdonk, Tompa and van den Biggelaar1983), Hodgson & Bernard (Reference Hodgson and Bernard1986), Pipe (Reference Pipe1987a) and Wourms (Reference Wourms, Giese, Pearse and Pearse1987). The gonad development was categorized into four stages, modified from Chipperfield (Reference Chipperfield1953) (Fig. 1 & 2):
Stage 0 (empty): the mantle is dominated by storage tissue and has little gonadal tissue. The earliest stages cannot be sex determined. Female acini that can be recognized have oocytes in the previtellogenic stages, and male acini have only early stages of the sperm cells and no spermatids or spermatozoa.
Stage 1 (early filling): the acini are easily recognized and all the individuals can be sex determined. Most oocytes have started vitellogenesis and some are already mature. In male acini immature sperm cells make half of the acinus radius or more. Mature residual gametes may be seen in individuals recovering from spawning.
Stage 2 (filling): most oocytes are in late vitellogenesis, with visible yolk granules and vitelline envelope, but still attached to the acinus walls. A minority of the oocytes are detached and fully mature. The males have more spermatids but still abundant immature sperm cells, and the latter make at least one-quarter of the acinus radius, typically five cells or more.
Stage 3 (mature): the stage is morphologically similar to stage 2, but the proportion of mature gametes in the acini is higher and the proportion of gonad tissue relative to storage tissue is usually higher.

Fig. 1. Schematic drawing of the stages of ovary development in Mytilus edulis from histology. Stage 0 (empty), Stage 1 (early filling), Stage 2 (filling) and Stage 3 (mature). See text for details and Figure 3 for illustration of the cell stages. Arrows indicate the development through maturation and spawning. Spawning can be complete or partial and lead to different stages of maturation.
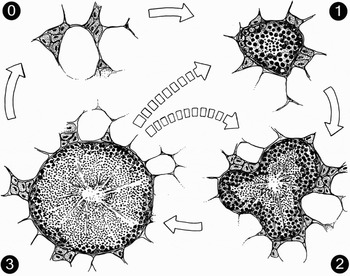
Fig. 2. Schematic drawing of the stages of testis development in Mytilus edulis from histology. Stage 0 (empty), Stage 1 (early filling), Stage 2 (filling) and Stage 3 (mature). See text for details and Figure 3 for illustration of the cell stages. Arrows indicate the development through maturation and spawning. Spawning can be complete or partial and lead to different stages of maturation.
Some individuals have acini with empty lumens and gametes along the acinus walls. These were considered as recovering from spawning and given a stage of gonad development according to the development of the gametes present. The different cell stages are illustrated in Figure 3.

Fig. 3. Photomicrographs of the reproductive tissue demonstrating the different cell stages: (A) testis with immature sperm cells (is) along the periphery of the acini and spermatozoa (sz) towards the centre; (B) ovary with young, previtellogenic (pv) oocytes along the acinus walls. Larger, stalk shaped or late pedunculated (lp) cells are still attached to the acinus wall and mature oocytes (mo) have been shed into the acinus lumen. Toluidine stained semithin sections from resin embedded material.
Classification of storage tissues stages
The vesicular connective tissue (VCT) with glycogen stores and the adipogranular tissue (ADG) with protein and lipid stores (Gabbott, Reference Gabbott and Bayne1976; Pipe, Reference Pipe1987b; Mathieu & Lubet, Reference Mathieu and Lubet1993) were categorized in three stages each (Figures 4 & 5):

Fig. 4. Schematic drawing of the stages of vesicular connective tissue (VCT) development in Mytilus edulis from histology. Stage 0 (no filled VCT cells), Stage 1 (some filled VCT cells) and Stage 2 (filled VCT cells surrounding the acini). Adipogranular (ADG) cells are also present. See text for details.

Fig. 5. Schematic drawing of the stages of adipogranular (ADG) tissue development in Mytilus edulis from histology. Stage 0 (no filled ADG cells), Stage 1 (some filled ADG cells) and Stage 2 (filled ADG cells form a web among the vesicular connective tissue (VCT) cells). See text for details.
VCT:
Stage 0: no filled VCT cells
Stage 1: filled VCT cells are accumulating between the acini and towards the mantle epithelium, but not yet surrounding the acini forming a continuous web.
Stage 2: the VCT cells are filled and almost completely surround the acini with a layer of more than one cell in thickness.
ADG:
Stage 0: no filled ADG cells
Stage 1: some filled ADG cells are seen among the VCT cells. Alternatively, less filled ADG cells form a web between the VCT cells.
Stage 2: filled ADG cells form a web between the VCT cells.
RESULTS
The one year old mussels had an initial shell length of 3.4±0.7 cm (Figure 6) and average weight of 4.18 g. The two year old mussels had an initial shell length of 5.1±0.5 cm and average weight of 12.4 g. Growth was slow between April and August. A period of faster growth was recorded with two weeks’ delay after resocking on 18 August until late September. No growth took place between September and December.

Fig. 6. Development of shell length in one and two year old mussels (Mytilus edulis) between April and December 2002.
Both age groups followed a similar pattern in development of condition index and average gonad stage (Figure 7). For the two year old mussels, a period of stable condition indices between April and May was followed by a marked increase until mid-June. The average gonad stages were stable at a high level throughout this period. The one year old mussels showed some variations in condition indices between April and May that were opposite to the variations in average gonad stage, but otherwise followed the two year old mussels. In late June both condition indices and average gonad stages dropped to minimum levels for the season. The first part of this spawning resulted in the largest drop in average gonad category, while the second part, with the largest drop in condition, coincided with a small increase in average gonad category. The amplitude of this drop was larger for the two year old mussels compared to the one year old mussels. A new increase was followed by a smaller drop in September, and by December both condition indices and gonad categories had again reached a high level.

Fig. 7. Development of (A) condition index and (B) average gonad stage, in one and two year old mussels (Mytilus edulis) from April to December 2002. See Materials and Methods section for detailed description of the histological stages.
Throughout the study the condition indices in both groups were above 35%, corresponding to meat yields above 25%. Condition indices were around 2 to 5% higher throughout the study in the one year old mussels compared to the two year old mussels, except for the sampling on 17 June, where the values were close to identical. The corresponding values for meat yield were two per cent higher in the one year old mussels also at this point, and the differences throughout the study were larger (data not shown) for meat yield than for condition index. The proportion of shell weight to whole live weight was around 10% higher in the two year old mussels throughout the study.
The distribution of the different gonad stages showed a marked change in July (Figure 8). During spring, the proportions shifted between Stages 2 and 3 as the dominating stage, while Stage 1 was low. From July, Stage 1 increased markedly to around 40% while Stage 0 gonads were seen for the first time. This lasted until December when all gonads were in Stages 2 and 3. A major increase in maturation with Stage 3 dominating was seen in both the spring period with low incidents of Stages 0 and 1, and again in the summer/autumn period, but then with high proportions of the earlier stages. Both increases in Stage 3 were followed by immediate decreases coinciding with the drops in condition indices.
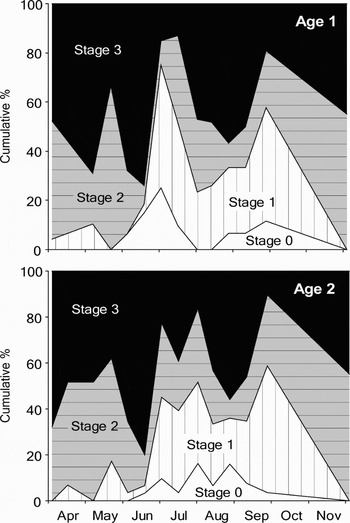
Fig. 8. Percentage distribution of stages of gonad development in one and two year old mussels (Mytilus edulis) between April and December 2002. Stage 0 (empty), Stage 1 (early filling), Stage 2 (filling) and Stage 3 (mature). See Materials and Methods section for detailed description of the histological stages.
There were no obvious differences in the patterns of average gonad stages between male and female mussels (data not shown).
There were no clear differences in the development of the storage tissue between the two age groups. During spring, both adipogranular (ADG) and vesicular connective tissue (VCT) cells developed from more or less empty to mostly filled cells. The average categories increased for both types of storage tissue until May/June coinciding with an increase in glycogen concentration (Figure 9). The average storage tissue categories then levelled off for the rest of the study. The VCT cells seemed to be fuller at the start of the study and increased faster than the ADG cells. In the early spring samples it was usually observed that the mantle tissue had to some extent filled VCT cells while the ADG cells were more or less empty in the same individuals. The glycogen concentrations showed an increase during spring in both age groups, following the development of the storage tissue categories. The concentrations decreased markedly in the two year old mussels in June and remained low until the resocking in mid-August. This was not seen in the one year old mussels, where the concentrations showed some variations, but in general remained stable during this period. Both age groups then increased until late September. A marked decrease in glycogen concentration was then seen in both groups, also in total amount of glycogen per mussel (data not shown), despite stable or decreasing average VCT categories.

Fig. 9. Development of storage tissue in one and two year old mussels (Mytilus edulis). (A) average histological category of vesicular connective tissue (VCT) and adipogranular (ADG) tissue; (B) glycogen concentrations in mg/g dry weight.
DISCUSSION
There were no clear differences in the reproductive patterns between one and two year old mussels, as seen from the condition index development, the level of average gonad stage throughout the study and the distribution of gonad stages. Both groups were mature both spring and autumn and had similar spawning patterns throughout the study. This is consistent with Wilson & Seed (Reference Wilson and Seed1974) who found no differences in rates of gametogenesis in mature mussels of different sizes, and with Seed (Reference Seed1975) who suggested that there were no marked differences in spawning time between small (young) and large (old) individuals in wild populations of M. edulis. Jensen & Spärck (Reference Jensen and Spärck1934) suggested that young mussels spawned during their first autumn, while older mussels spawned in the spring, though no detailed description of the observations was given. The first autumn was not within the scope of the present study, however, and this period is less relevant for the mussel industry since the mussels have yet not reached commercial size at that time. However, none of these authors determined the age of the mussels, while secure age determination was a main objective in the present study. The one year old mussels in the present study were collected from lines that were put out just prior to the settlement the year before, and hence should have no incidents of other ages. For the two year old mussels, the settlement the year before the study had been removed when this set still was small enough to be distinguished by size from the older mussels. The present study is hence the first to compare the reproductive patterns over time of one and two year old mussels with reliable age determination, and provide information that there are no obvious differences in neither timing of gonad development nor spawning patterns between the two age groups.
Part of the background for the present study was observations of higher meat yield in one year compared to two year old mussels by the industry, with a possible hypothesis that the younger mussels would not mature and spawn until the autumn. Despite the lack of differences in reproductive patterns, we still observed higher condition indices in the one year old mussels compared to the two year old mussels throughout most of the study. The difference of 2 to 5% was substantial compared to the variation between 36 and 48% throughout the study. As we will discuss below, differences in shell thickness, fecundity, feeding rates and biomass density can all contribute to the differences in condition.
Some differences were found in condition index, but even larger differences were seen in meat yield, which is the condition measure used by the industry, calculated as cooked meat weight over whole live weight. This is due to an approximately 10% higher proportion of shell weight to whole weight in the two year old mussels. The effect of differences in shell thickness is eliminated in the formula for condition index by subtracting shell weight from whole weight in the denominator. Similar differences in meat yields between younger and older mussels are usually observed in practical mussel farming, and this is probably also partly due to thicker shell in older mussels. Some of the differences in condition index are probably related to differences in feeding activities and food availability for the two age groups. Hickman & Illingsworth (Reference Hickman and Illingworth1980) showed that food availability was the second most important factor next to spawning in determining condition index. In general, younger mussels have higher size-specific scope for growth compared to older mussels, even under identical feeding conditions. In a previous study we observed two times more growth in one year old compared to two year old mussels (Duinker et al., Reference Duinker, Bergslien, Strand, Olseng and Svardal2007). Similar growth differences can be calculated from scope for growth data presented by Thompson & Bayne (Reference Thompson and Bayne1974), which can mainly be ascribed to around two times differences in size-specific feeding rates (Thompson & Bayne, Reference Thompson and Bayne1974; Navarro & Winter, Reference Navarro and Winter1982) (see Duinker et al., Reference Duinker, Bergslien, Strand, Olseng and Svardal2007 for a detailed discussion). In addition to this, older mussels will be food limited at lower food levels than younger mussels, since the optimum scope for growth occurs at higher rations in larger mussels (Thompson & Bayne, Reference Thompson and Bayne1974). This effect would hence have been smaller with higher food availability for both groups. However, in the present study the food availability was probably lower and more limiting for growth of the two year old mussels given the higher biomass density for this group. The difference in food limitation was probably demonstrated in the glycogen data, where the two year old mussels had a strong decline in glycogen content around June that was not seen in the younger mussels.
Higher condition indices in younger mussels could also result from lower fecundity in younger mussels (Bayne, Reference Bayne and Wiley1976; Sprung, Reference Sprung1983; Rodhouse et al., Reference Rodhouse, Mcdonald, Newell and Koehn1986) that would result in smaller losses of body mass and hence smaller drops in condition index after spawning compared to older mussels. We observed a larger drop in condition index in the two year old mussels during the main spawning in late June, compared to the one year old mussels, but this was not seen during the autumn spawning. Differences in fecundity may have been counteracted by higher food availability and growth rates of the one year old mussels according to the discussion above, since higher available food ration can increase the reproductive output (Thompson, Reference Thompson1979; Bayne & Worrall, Reference Bayne and Worrall1980). On the other hand, increased food availability could result in both a higher condition index prior to spawning as well as larger decreases during spawning, and it is not possible to predict the outcome without supporting data. The sum of all these processes, under the given environmental conditions, should in some way or the other lead to the observed differences in condition and meat yield, both in the present study and in the industry, and it seems clear that such differences can occur without differences in spawning patterns.
Since the two age groups showed no differences in reproductive patterns, the following paragraphs describe the common variations in reproductive and storage tissues for the two groups throughout the season. In April and May both average gonad indices in both age groups and condition indices in the two year old mussels were relatively stable. However, storage tissue indices and glycogen concentration increased, and young gametes were seen in the histology throughout this period, indicating continued gametogenesis. A scenario that can explain this is a period with scattered spawning and gradual replacement of reproductive tissue with storage tissue, and also cycles of rematuration and spawning as described for mussels in France (Herlin-Houtteville & Lubet, Reference Herlin-Houtteville, Lubet and Reiboth1975). The gonad indices for the one year old mussels did not follow the same pattern. However, the variations in condition index in this group were opposite to the variations in gonad indices, which indicate that unknown biological and methodological variation was the source of this variation.
From June a strong increase in condition index was seen as a result of accumulation of storage tissue as well as gametes, with increase in Stage 3 individuals, probably combined with reduced or absent spawning activity. This was followed by a major spawning period from late June to early July where presumably a larger proportion of the population participated and a larger proportion of the gametes were spawned. The largest drop in maturation was seen between 17 June 17 and 1 July, while the largest drop in condition index took place during the next two weeks, suggesting that rematuration and spawning occurred simultaneously also during this period. This kind of spawning activity, with both scattered spawnings and a major spawning, has previously been described for several populations of M. edulis in European waters (Seed, Reference Seed1975; Sprung, Reference Sprung1983; Pieters et al., Reference Pieters, Kluytmans, Zandee and Cadee1980) including Eastern Norway (Bøhle, Reference Bøhle1965). However, also spawning patterns with a single spawning period has been reported (Bruce, Reference Bruce1926; Thorson, Reference Thorson1946; Chipperfield, Reference Chipperfield1953), and annual variations may give different types of spawning patterns at the same locality (Seed, Reference Seed1969, Reference Seed and Bayne1976; Lowe et al., Reference Lowe, Moore and Bayne1982; Brousseau, Reference Brousseau1983). The synchronous induction of spawning among many individual bivalves in an area is a response to an environmental parameter acting as a spawning stimulus (Galtsoff, Reference Galtsoff1961), and scattered spawning activity may reflect that such stimuli are not strong enough to evoke spawning (Newell et al., Reference Newell, Hilbish, Koehn and Newell1982).
Typical for the fjord area in the present study, as reported by growers, is one major spawning with a strong fall in meat yield during May, although larvae are seen in the water throughout spring, summer and autumn. One major spawning was also observed in the Hardanger area (N59° 44.6′ E5° 43.3′) in 2001 (Duinker, unpublished data). The reproductive pattern in the present study hence deviates from what is regarded as normal. A similar alternation between a well defined cycle to parts of a season with more continuous spawning was observed by Lowe et al. (Reference Lowe, Moore and Bayne1982). It may be speculated that this year's reproductive pattern may have masked normally occurring differences between the age-classes. However, histological samples from the study in Hardanger in 2001 also showed mature gonads in both one and two year old mussels in spring as well as autumn (Håland & Duinker, unpublished data). Alterations of the reproductive cycle like this have obvious implications for the mussel industry. With respect to meat yield, the mussels in the present study could have been harvested at any time of the season, while a classical spawning with drops to low meat yields in May will give harvest closure for several months until the meat yield has recovered.
During major spawnings early in the season, the meat yield in Norwegian mussel farms usually drops to below 20%. The high condition indices after the spawning in June in the present study, corresponding to more than 25% in meat yield, can probably be explained by the fact that larger amounts of storage tissue had been accumulated by that time, compared to earlier in the season.
Following the major spawning, the population seemed to separate into two alternative strategies. Between July and August, the proportion of individuals in Stage 3 increased from about 20 to about 50% on expense of the lower stages, while about 30% remained in Stages 0 and 1. Individuals in Stages 0 and 1 were probably in a resting stage as described by Seed (Reference Seed1969), while the rest of the population matured new gametes. McKenzie (Reference McKenzie1986) suggested that mussels have a mechanism deciding whether an individual has enough energy to mature for a late spawning, or to save the energy for maturation and maintenance metabolism during winter. Thus feeding conditions during the summer may be determining whether there will be an autumn spawning or not. The maturation in August culminated in a spawning in September, as seen from the decline in condition index, average gonad stage and the proportion of individuals in Stage 3. Autumn spawning has been documented in many earlier studies as seen in the review by Seed (Reference Seed and Bayne1976), including a Norwegian population (Bøhle, Reference Bøhle1965).
From September to December the condition index and average gonad stage increased, and there were no more individuals in the Stages 0 or 1. This indicates that all the mussels had started the winter maturation described by Seed (Reference Seed1969) and Wilson & Seed (Reference Wilson and Seed1974), starting in November and culminating with fully mature gonads in February or March in British waters. The glycogen content decreased between September and December in the present study, at the same time as condition indices increased. This probably reflects a consumption of glycogen for fuelling gametogenesis (Wilson & Seed, Reference Wilson and Seed1974; Zandee et al., Reference Zandee, Kluytmans, Zurburg and Pieters1980; Lowe et al., Reference Lowe, Moore and Bayne1982), with higher demands from the energy stores after food levels drop to minimum values during late autumn (Frette et al., Reference Frette, Erga, Hamre, Aure and Stamnes2004).
ACKNOWLEDGEMENTS
This manuscript is based on the Masters thesis of Liv Håland, and the authors wish to thank her co-supervisor Professor Kåre Julshamn for valuable help with formalities. We also thank Ingrid Uglenes Fiksdal and Anne Torsvik for valuable advice regarding histology. The work was supported by NIFES and the Norwegian Research Council/Innovation Norway project ‘Quality variations in cultured mussels’.


