INTRODUCTION
Dissolved oxygen (DO) is a critical constraint that can affect aquatic animals in ecological systems. If the DO level falls to hypoxic concentrations, the habitability decreases rapidly for aerobic organisms (Deutsch et al., Reference Deutsch, Brix, Ito, Frenzel and Thompson2011). DO concentrations below ~60 µM (1.92 mg l−1), known as hypoxia, are lethal for more than 50% of marine benthic animals, and this proportion increases to more than 90% when the DO concentration falls below ~10 µM (0.32 mg l−1) (Vaquer-Sunyer & Duarte, Reference Vaquer-Sunyer and Duarte2008). Hypoxia has become a severe problem and it can have significant deleterious effects on ecological dynamics and fishery sustainability throughout coastal ecosystems worldwide (Nestlerode & Diaz, Reference Nestlerode and Diaz1998; Diaz, Reference Diaz2001).
The sea cucumber Apostichopus japonicus is a deposit-feeder and vital for marine benthic ecosystems, and it is a common temperate species that lives in the shallow sea off north-west China (Liao, Reference Liao1980; Sloan, Reference Sloan, Keegan and O'Connor1984). Due to its high nutritional value and health benefits, A. japonicus is highly desirable in the East Asian consumer market, particularly in China (Zhou et al., Reference Zhou, Dong, Sun, Yang, Chen, Gao, Jiang, Guan, Jiang and Wang2014; Ren et al., Reference Ren, Stenton-Dozey and Zhang2017). Apostichopus japonicus is now the most common economic species that is released and cultured in the marine ranches of northern China (Zhang et al., Reference Zhang, Song, Hamel, Mercier, Yang, Hamel and Mercier2015b). O2 is a primary factor that affects sea cucumbers living on the sea floor. When the DO concentration dropped to a hypoxic extent in some parts of Laizhou Bay during 2013, A. japonicus climbed to the tops of artificial or natural reefs, where individuals attached and overlapped with each other. If hypoxia lasts for several days, massive mortality of A. japonicus might occur.
As is shown in the previous studies, asteroids such as Asterias rubens (Theede et al., Reference Theede, Ponat, Hiroki and Schlieper1969), Asterias rubens (Holm et al., Reference Holm, Hernroth and Thorndyke2008; Oweson et al., Reference Oweson, Li, Söderhäll and Hernroth2010) and Ctenodiscus crispatus (Shick, Reference Shick1976) are sensitive to hypoxia. Hypoxia also has negative effects on the regeneration and reproduction of brittle star, Amphiura filiformis (Nilsson & Sköld, Reference Nilsson and Sköld1996). The green sea urchin, Strongylocentrotus droebachiensis, also shows low tolerance to hypoxia with low gonad growth and total food consumption (Siikavuopio et al., Reference Siikavuopio, Dale, Mortensen and Foss2007). Previous studies have tried to understand the biological basis and mechanism of movement and feeding behaviours (Pan et al., Reference Pan, Zhang, Lin, Sun, Kan and Yang2015; Sun et al., Reference Sun, Zhang, Pan, Lin, Wang, Kan and Yang2015; Zhang et al., Reference Zhang, Pan, Song, Yang, Hamel and Mercier2015a), growth (Li & Li, Reference Li and Li2010), development (Kashenko, Reference Kashenko2000), respiration and excretion (Sui et al., Reference Sui, Dong, Tian, Wang and Dong2010), the energy budget (Yuan et al., Reference Yuan, Yang, Wang, Zhou and Gabr2010), immune responses (Wang et al., Reference Wang, Yang, Gao and Liu2008, Reference Wang, Yang, Wang, Xing and Gao2011), physiological responses in terms of osmoregulation and heat shock protein expression (Dong et al., Reference Dong, Dong and Meng2008; Meng et al., Reference Meng, Dong, Dong, Yu and Zhou2011), molecular responses to pathogen challenge (Shao et al., Reference Shao, Li, Ou, Zhang, Lu, Su, Li and Li2013; Zhang et al., Reference Zhang, Li, Zhu, Su, Li, Jin and Li2013, Reference Zhang, Li, Zhang, Jin, Pan and Bao2014) and the molecular responses of differentially expressed genes (DEGs) in the aestivation stage (Zhao et al., Reference Zhao, Yang, Storey and Chen2014) and intestine regeneration stage (Sun et al., Reference Sun, Yang, Chen, Ma and Lin2013) in A. japonicus. In these studies, the effects of environmental factors were investigated, such as temperature, salinity, light, pH and water flow. However, few studies have considered the effects of hypoxia on the behaviour, physiology and molecular responses of DEGs in A. japonicus. Thus, the molecular mechanisms responsible for adaptation to acute changes in the DO concentration are poorly understood.
In recent years, global change and human activities have intensified, and anthropogenic nutrient loading has increased the frequency and severity of hypoxia in estuaries and semi-enclosed seas (Grantham et al., Reference Grantham, Chan, Nielsen and Fox2004). Hypoxia poses a great challenge to the aquaculture of A. japonicus. The respiratory tree, which is the respiratory organ in A. japonicus, might be sensitive to the stress induced by a low DO concentration and the differential expression of genes may occur in different DO environments. Thus, the aim of this study was to obtain a better understanding of the molecular responses of A. japonicus when exposed to changes in the ambient acute DO concentration in order to provide a theoretical basis for hypoxia risk prevention and control in aquaculture.
MATERIALS AND METHODS
Animals
The sea cucumbers, A. japonicus involved in this study were not endangered or protected. In total, 60 fresh and healthy sea cucumbers, A. japonicus were collected from the coast of Laizhou, China, with wet weights of 80–130 g. After weighing, they were acclimated in tanks containing aerated sand-filtered seawater (salinity 30‰, pH 8.0) at 15 ± 0.5°C for one week before use and they were fed once each day at 8:00 am during this period. All of the animals were then assigned randomly to three groups (20 individuals in each group). One group of sea cucumbers was maintained as the control group with high DO water (DO8) at around 8 mg l−1, whereas the other two groups were kept in seawater with nitrogen injection where the DO concentration gradually decreased to ~4 mg l−1 DO (DO4) and 2 mg l−1 DO (DO2) in 1 h, which is defined as hypoxia (Diaz & Rosenberg, Reference Diaz and Rosenberg1995), and they were maintained for three days. Next, nine individuals were selected randomly from each group (three groups) and dissected rapidly, where the respiratory tree was sampled and preserved in liquid nitrogen for RNA extraction and sequencing.
RNA isolation and sequencing
According to the manufacturer's instruction, an RNeasy mini kit (Qiagen Inc., Hilden, Germany/Cat No. 74104) including DNase treatment was used to isolate total RNA from nine samples of the respiratory tree from each group (DO2, DO4 and DO8). The RNA samples from every three individuals in the same group were pooled in equal amounts for library construction as one replicate (three replicates in each group). Libraries were prepared from the nine RNA pools by Beijing Genomics Institute, Shenzhen, China (BGI-Shenzhen). Strict quality control (QC) was applied in each experimental step to obtain highly reliable sequencing data. Magnetic beads with poly-T-oligos attached were used to isolate poly(A) mRNA. The target RNA was then purified. The target RNA was fragmented into short sequences, reverse-transcribed into single-strand cDNA using the N6 random primer (Promega, Madison, WI, USA), and synthesized into double-stranded cDNA (dscDNA) with DNA polymerase I and RNase H (Promega, Madison, WI, USA). Next, the end of the dscDNA was repaired and ligated with a sequencing adapter. The ligation product was amplified using specific primers. The PCR product was denatured by heating and the single strand DNA was cyclized using splint oligo and DNA ligase. Finally, high throughput sequencing was performed with the prepared cDNA libraries using the BGISEQ-500 RS platform at BGI-Shenzhen.
Data filtering, read mapping and sequence QC
QC was applied to the raw reads from primary sequencing to determine whether a resequencing step was required. Data filtering was performed after QC to decrease the data noise. Reads with adapters, reads with more than 10% unknown bases, and low quality reads (if the percentage of low quality bases was over 50% in a read, a low quality base was a base with a sequencing quality of no more than 5%) were removed. After filtering, the remaining reads were designated as ‘clean reads’. Clean reads were mapped to the reference transcriptome in a 454 sequence transcriptomic database for A. japonicus (NCBI accession nos. SRA020994 and SRA046386) (Sun et al., Reference Sun, Chen, Yang, Wang, Liu, Shu and Gardiner2011; Du et al., Reference Du, Bao, Hou, Wang, Su, Yan, Tian, Li, Wei, Lu, Hu, Wang and Hu2012) using Bowtie2 (Langmead et al., Reference Langmead, Trapnell, Pop and Salzberg2009) and to the reference genome using hierarchical indexing for spliced alignment of transcripts (HISAT) (Kim et al., Reference Kim, Langmead and Salzberg2015). The alignment was also subjected to QC to determine whether resequencing was necessary. The distribution of the reads in the reference genes and the mapping ratio were calculated using the alignment data. If the alignment result passed QC, deep analysis was implemented, including gene expression and related analyses based on gene expression.
Gene quantification, DEG screening and functional classification
Transcripts that were isoforms of the same gene were determined by computing maximum likelihood abundance estimates with the quantification tool for RNA-Seq by Expectation Maximization (RSEM) (Li & Dewey, Reference Li and Dewey2011).
The fragments per kilobase of exon per million fragments mapped (FPKM) method (Mortazavi et al., Reference Mortazavi, Williams, McCue, Schaeffer and Wold2008) was used to calculated gene expression levels. The NOISeq method (Tarazona et al., Reference Tarazona, García-Alcalde, Dopazo, Ferrer and Conesa2011) was used to identify the DEGs in groups of sea cucumbers exposed to different DO concentrations. In the NOISeq method, the gene expression level in each group was used to compute log2 ratio (fold change), M, and the absolute difference value, D, for all paired conditions in order to build a noise distribution model. For a specific gene, the P-value estimated how much M and D both diverged from the noise distribution. The criteria of fold change ≥2 and divergence probability ≥0.8 were used as thresholds to screen the DEGs.
To identify the functional classifications of DEGs, Gene Ontology (GO) terms were determined for the DEGs using Blast2GO (Hemandez et al., Reference Hemandezl, Robles and Talon2006) and pathway analysis was performed based on the Kyoto Encyclopedia of Genes and Genomes (KEGG) database. The gene numbers were computed for every term and the DEGs were subjected to a hypergeometric test, where significantly enriched GO terms were determined based on a P-value ≤ 0.05 after Bonferroni correction (Abdi, Reference Abdi2007). The formula used to calculate the P-values for determining significantly enriched KEGG pathways was the same as that used for GO analysis. In addition, the significantly enriched KEGG pathways were determined based on corrected P-values ≤ 0.05. A strict algorithm based on Bonferroni correction (Abdi, Reference Abdi2007) was employed to calculate the P-values.
Real-time PCR (RT-qPCR) validation
RT-qPCR was performed in order to validate the RNA-seq results obtained for some significant DEGs. Primers (Table 1) were designed for optimal performance with primer3 according to the sequence information in the transcriptome database. The input RNA used for template cDNA synthesis was run in triplicate of each group. According to our previous study (Sun et al., Reference Sun, Yang, Chen, Ma and Lin2013), the first strand cDNA was synthesized in a 25-μl reaction system. Eppendorf Mastercycler® eprealplex (Eppendorf, Hamburg, Germany) was used to determine the mRNA expression levels with the SYBR Green® real-time PCR assay. The total volume used for amplification was 20 µl, which comprised 8 µl of RNase-free water, 10 µl of SYBR GreenMasterMix (Takara), 1 µl of diluted cDNA and 0.5 µl each of the forward and reverse primers (10 mM). Thermal cycling was performed according to the following procedure: 95°C for 5 s, followed by 40 cycles at 95°C for 10 s, 60°C for 20 s and 72°C for 30 s. The specificity of the amplification products was validated by melting curve analysis. All of the data were expressed as the mean ± SD and the threshold for significant differences was P < 0.05. Significant differences between groups for each gene were determined by one-way ANOVA with Tukey's test using SPSS 18 software (IBM Corp., Armonk, NY, USA).
Table 1. Selected genes and primers designed for real-time PCR.

RESULTS
Analysis of the sequencing data quality
Libraries of nine samples from three different groups (DO2, DO4 and DO8) were constructed from sea cucumber respiratory tree samples using RNA-Seq. In total, there were 24,097,736 raw sequencing reads and 23,847,854 clean reads were obtained after filtering out low quality sequences. The clean reads from the three groups were submitted to NCBI (accession no. GSE100042). The sequencing raw reads number and clean reads number for each sample were listed in Table 2. Among these reads, the statistics for read alignments with reference genes and the whole genome, i.e. the total mapped reads rate and unique match rate were shown in Table 3.
Table 2. Summary of the sequencing data obtained for each sample.

Table 3. Statistics for read alignments with reference genes and the whole genome.

Strict QC was applied to each sample (Table S1) to evaluate the quality of the sequencing data. Saturation analysis based on the sequencing data indicated that when a certain amount of sequencing reads were reached, the growth curve flattened for the identified genes and the number of genes identified tended to reach saturation (Figure S1). The sequencing randomness assessment determined the distribution of the reads and the aligned reads appeared to be distributed evenly in the three libraries (Figure S2).
DEG analysis
RNA-seq provided a general overview of the gene expression profiles in the respiratory trees of A. japonicus specimens exposed to different DO concentrations of 2, 4 and 8 mg l−1. In total, 27,214 unigenes were identified in the three different groups. The three samples from the same DO environments were grouped into DO2, DO4 and DO8. DEG screening with the NOISeq method identified 51, 59 and 61 DEGs according to the criteria of fold change ≥2 and divergence probability ≥0.8 in the comparisons of DO2 vs DO4, DO2 vs DO8 and DO4 vs DO8, respectively (Figure 1).
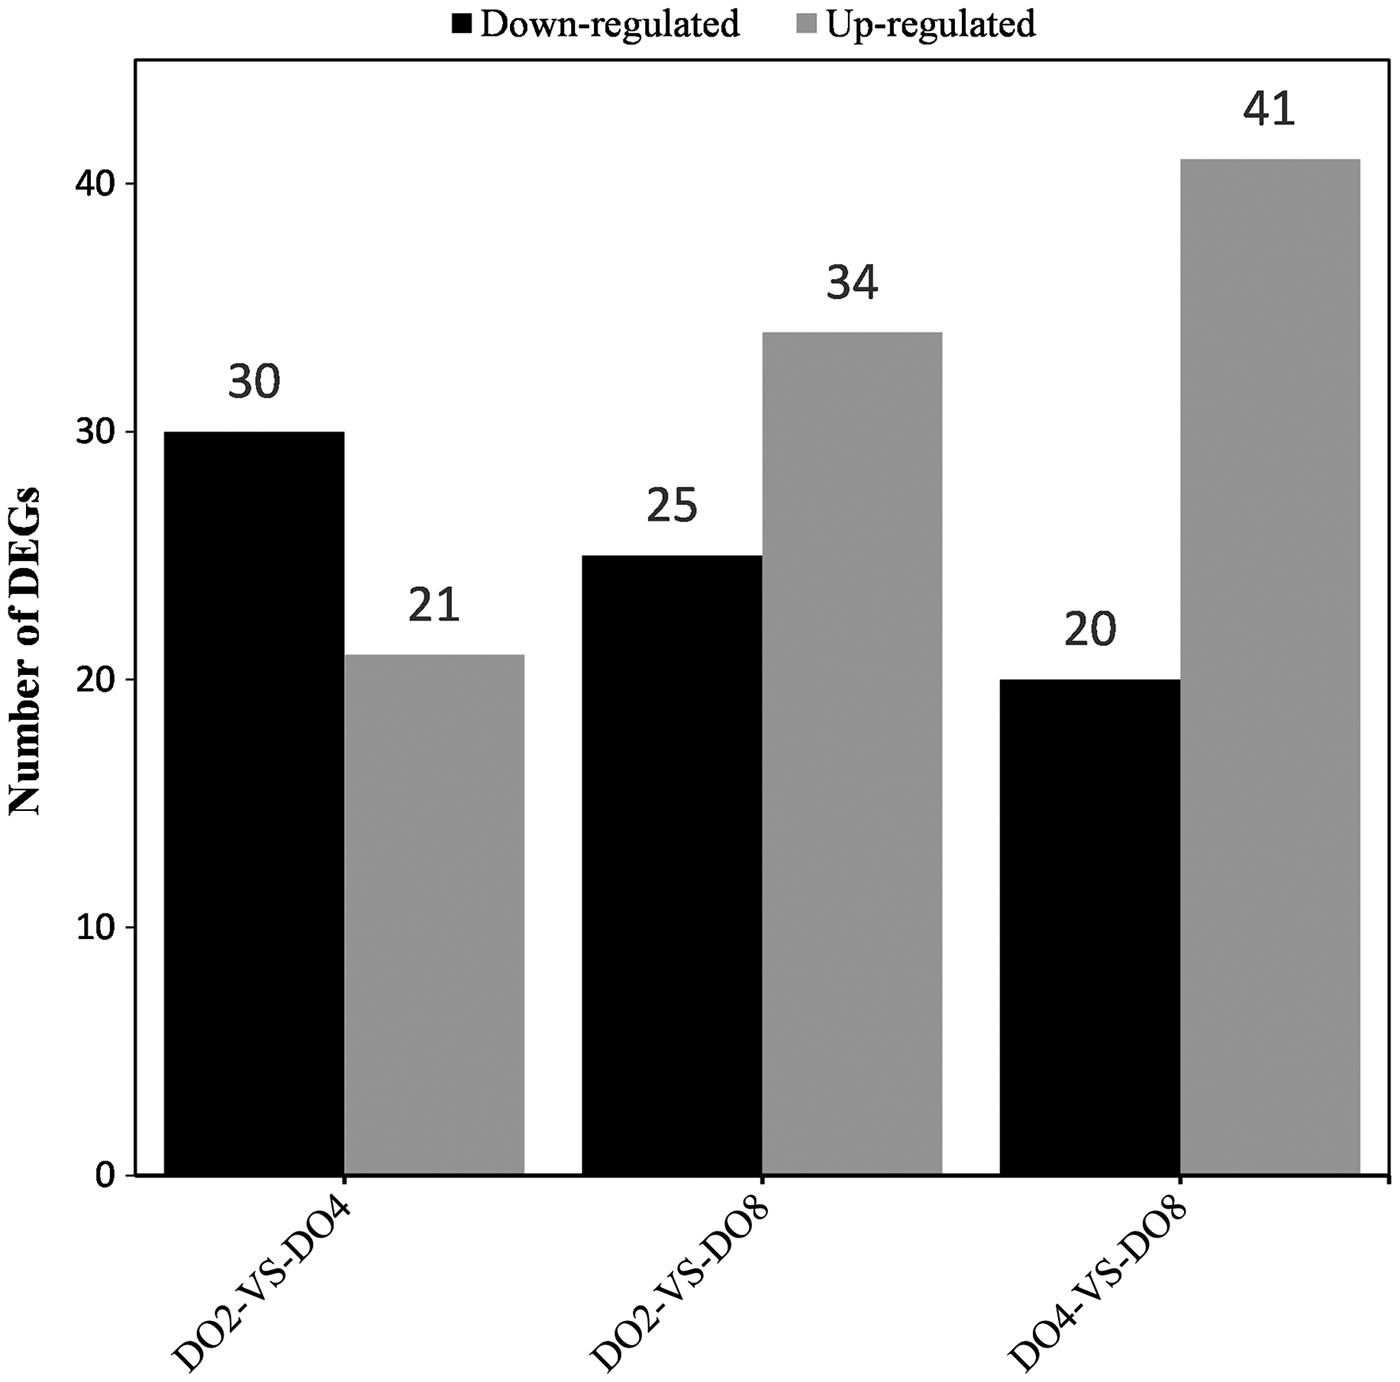
Fig. 1. Statistics for the DEGs. The x-axis represents the pairwise comparisons and the y-axis shows the number of DEGs screened. Black bars denote downregulated genes and grey bars are upregulated genes.
In particular, 30 downregulated DEGs (0.11%, 30/27,214) and 21 upregulated DEGs (0.08%, 21/27,214) were identified based on the comparison of DO2 vs DO4, 25 downregulated DEGs (0.09%, 25/27,214) and 34 upregulated DEGs (0.12%, 34/27,214) were identified based on the comparison of DO2 and DO8, and 20 downregulated DEGs (0.07%, 20/27,214) and 46 upregulated DEGs (0.15%, 41/27,214) were identified based on the comparison of DO4 vs DO8.
The down- or upregulated DEGs annotated based on these three comparisons are listed in Tables S2–S4. Several DO-specific expression genes were found. DEGs such as ATP synthase subunit f, mitochondrial, cyclophilin A isoform 1, phytanoyl-CoA dioxygenase, peroxisomal-like and thioredoxin had significantly higher expression levels in the DO2 and DO4 groups compared with the DO8 group, where the mean expression level was 0.01. In addition, other genes such as cysteine-rich secretory protein LCCL domain containing 2-like, major vault protein and RNA-directed DNA polymerase from mobile element jockey-like had significantly higher expression levels in the DO2 group compared with the DO4 and DO8 groups, with a mean expression level of 0.01. Moreover, counting factor associated protein D-like and scavenger receptor cysteine-rich protein precursor had significantly higher expression levels in the DO8 group compared with the DO2 and DO4 groups, where the mean expression level was 0.01.
Based on the primary results, some genes appeared to have functions that were important for understanding the response of the respiratory tree in A. japonicus to different DO concentrations, as shown in Table 4. The key DEGs associated with different DO concentrations were classified into four groups.
Table 4. Key DEGs associated with the effects of different DO concentrations.

GO classification
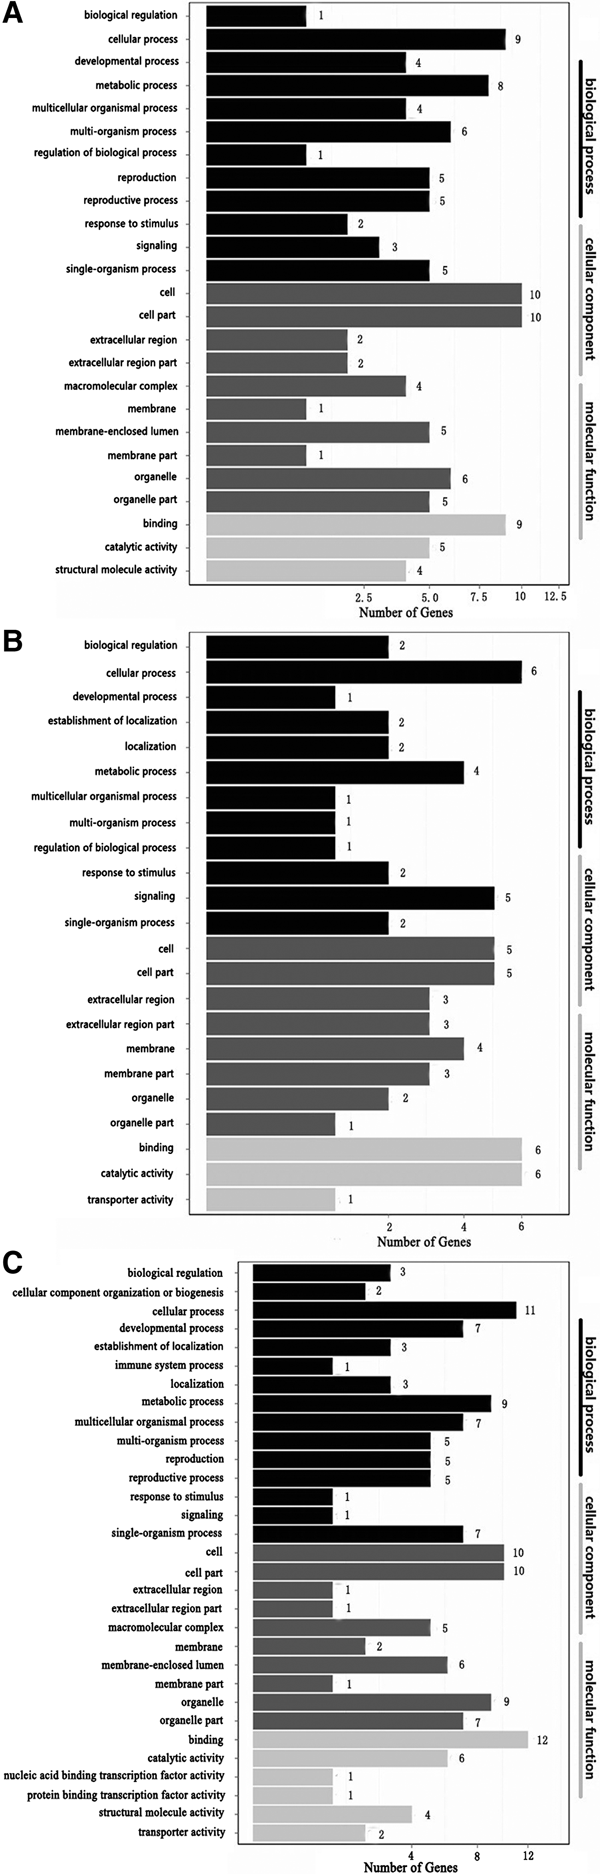
Complete functional information can be obtained by assigning DEGs to three major categories (‘cellular component’, ‘molecular function’ and ‘biological process’). In order to identify the functions of the DEGs, they were subjected to GO analysis. GO term enrichment analysis detected 17, 2 and 26 significantly over-represented enriched GO terms based on the comparisons of DO2 vs DO4, DO2 vs DO8 and DO4 vs DO8, respectively, where P < 0.05.
In the three comparisons, ‘cellular process’ and ‘binding’ had the most enriched DEGs in the categories of ‘biological process’ and ‘molecular function’, respectively (catalytic activity also had the most enriched DEGs in the category of ‘molecular function’ based on the comparison of DO2 vs DO8), while ‘cell’ and ‘cell part’ had the most enriched DEGs in the category of ‘cellular component’ (Figure 2).

Fig. 2. GO functional classifications of DEGs based on each pairwise comparison. The x-axis shows the number of DEGs (as the square root of the value). The y-axis shows the GO terms. All of the GO terms are grouped into three ontologies: blue = biological process, brown = cellular component and orange = molecular function (A. DO2 vs DO4, B. DO2 vs DO8, C. DO4 vs DO8).
KEGG classifications
Genes usually interact with each other and play roles in specific biological functions. The DEGs were also mapped to KEGG metabolic and regulatory pathways with a correct P-value cutoff of <0.05. The DEGs detected in the comparisons of DO2 vs DO4, DO2 vs DO8 and DO4 vs DO8 affected a range of KEGG pathways. The top 20 KEGG enrichment results are shown in Figure 3. The DEGs were mapped to 79, 81 and 104 pathways in the KEGG database, and 8, 29 and 16 pathways were significantly enriched, respectively (corrected P-value <0.05). The most representative KEGG pathways included Ribosome (ko03010), MicroRNAs in cancer (ko05206), and Hematopoietic cell lineage (ko04640) in the comparison of DO2 vs DO4; Epstein-Barr virus infection (ko05169), Viral myocarditis (ko05416) and Pertussis (ko05133) in the comparison of DO2 vs DO8; and HIF-1 signalling pathway (ko04066), Ribosome (ko03010), and Carbon metabolism (ko01200) in the comparison of DO4 vs DO8.

Fig. 3. Statistics for the pathway enrichment of DEGs in each pairwise comparison. ‘RichFactor’ is the ratio of the number of DEGs annotated to a pathway term relative to all the genes annotated for this pathway term. A higher ‘RichFactor’ indicates greater intensity. The Q-value is the corrected P-value ranging from 0–1, where a lower Q-value denotes greater intensity. Only the top 20 enriched pathway terms are shown in the figure (A. DO2 vs DO4, B. DO2 vs DO8, C. DO4 vs DO8).
Validation of DEG analyses
In order to validate the DEGs identified, five genes (chloride channel calcium activated 3-like, phytanoyl-CoA dioxygenase, counting factor associated protein D-like, major vault protein and lysozyme) were selected to determine their relative mRNA expression levels using RT-qPCR. The results showed that the expression levels obtained for these five genes using RT-qPCR were similar to the DEG analysis patterns (Figure 4) under different DO exposure levels. This comparison of the data obtained by DEG analysis and the data produced using RT-qPCR suggest that the sequencing data were credible.

Fig. 4. Real-time qPCR analysis of five genes under DO2, DO4, and DO8. Different letters indicate significant differences between groups (P < 0.05). Values indicate the mean ± SD.
DISCUSSION
Oxygen (O2) is a very important constraint on marine ecosystems. Many biological and physiological processes are related to O2 thresholds, which restrict the activity and habitat of marine organisms (Deutsch et al., Reference Deutsch, Brix, Ito, Frenzel and Thompson2011). Apostichopus japonicus is very sensitive to changes in the DO concentration and its optimal DO range is 4–8 mg l−1. However, in some ocean areas, the DO concentration in the water may drop to 2 mg l−1 or even lower during the hot season. When A. japonicus is exposed to low DO concentrations, physiological stress may occur and various molecular regulation mechanisms can be affected. The results showed that the exposure of A. japonicus to different DO concentrations was associated with thousands of transcriptional variations. Numerous stimuli response, immune defence and signal transduction related genes differed in terms of their expression levels when A. japonicus was exposed to different DO concentrations. These genes may be excellent candidates for further studies of the molecular mechanisms associated with behaviour and physiology in A. japonicus under different DO concentrations.
Genes associated with stimuli response and signal transduction
If the DO concentration in seawater is excessively low, this can serve as a stimulus for A. japonicus, where several key genes are associated with responses to stimuli and signal transduction processes.
Calcium-activated chloride channels are involved in various physiological processes, such as oocyte fertilization, transepithelial transport and the excitability of neurons and muscle cells (Eggermont, Reference Eggermont2004). Calcium-activated chloride channel regulator 1 may mediate calcium-activated chloride conductance and it plays a critical role in calcium-activated chloride channels (Gruber et al., Reference Gruber, Elble, Ji, Schreur, Fuller and Pauli1998). Calcium-activated chloride channel regulator 1-like was downregulated in A. japonicus under DO2 compared with DO4 and DO8, thereby indicating that the normal regulation of calcium-activated chloride channels was influenced under hypoxia.
Gamma-aminobutyric acid type B receptor subunit 1 is a component of a heterodimeric G-protein coupled receptor for gamma-aminobutyric acid. In the heterodimeric gamma-aminobutyric acid receptor, only the gamma-aminobutyric acid type B receptor subunit 1 may bind agonists. Ligand binding leads to a conformational change, which triggers signalling via G-proteins and activates downstream effectors. In this study, the downregulation of gamma-aminobutyric acid type B receptor subunit 1-like under a DO concentration of 2 mg l−1 might indicate that the signalling pathway related to the gamma-aminobutyric acid type B receptor subunit 1 in A. japonicus was restrained under hypoxia.
Genes associated with metabolism
When A. japonicus is exposed to stress due to hypoxia, various hypoxia survival mechanisms might be induced, where energy-consuming and ATP-generating pathways can be affected (Gracey et al., Reference Gracey, Troll and Somero2001).
Ribosomes are organelles that catalyse protein synthesis, and they comprise a small 40S subunit and a large 60S subunit. The 60S ribosomal protein L35 is a component of the 60S subunit, and the 40S ribosomal protein S24 is a component of the 40S subunit. Some ribosomal proteins are known to be expressed in both the intestine and respiratory tree in aestivated A. japonicus (Zhao et al., Reference Zhao, Yang, Storey and Chen2014), and when the animals discontinued using energy for feeding, weight loss occurred and anabolism decreased (Yuan et al., Reference Yuan, Yang, Wang, Zhou, Zhang and Liu2007). The differential expression of ribosomal proteins under different DO conditions is vitally important for protein synthesis inhibition, mRNA-rRNA processing and signal transduction (Kim & Jang, Reference Kim and Jang2002; Warner & McIntosh, Reference Warner and McIntosh2009). The downregulation of ribosomal proteins in A. japonicus under a DO concentration of 2 mg l−1 compared with 8 mg l−1 might indicate the inhibition of normal protein synthesis, whereas the upregulation compared with a DO concentration of 4 mg l−1 might be explained by the initiation of the synthesis of specific proteins that have functions associated with hypoxia.
In addition, genes associated with redox reactions, such as alcohol dehydrogenase [NADP+]-like, epidermal retinol dehydrogenase 2-like, and phytanoyl-CoA dioxygenase, peroxisomal-like also had different expression levels under various DO concentrations, and the corresponding metabolism function might have been affected.
Genes associated with immune defence
Apostichopus japonicus can only survive under a specific DO range, where a low DO concentration acts as a stimulus and certain biological processes will be induced to respond to or resist a changing environment, and thus immune defence processes may be affected and function in an disordered manner.
Lysozyme is a component of the innate immune system. Lysozyme is abundant in a number of secretions. It is also present in cytoplasmic granules in polymorphonuclear neutrophils and macrophages. Immunoglobulin G (IgG) complexes are associated with numerous functions, where they are responsible for the lytic potential of cytotoxic lymphocytes and monocytes, and they regulate the activation of B lymphocytes via different receptors when IgGFc is expressed on different cells (Ravetch & Kinet, Reference Ravetch and Kinet1991). The downregulation of lysozyme and IgGFc-binding protein, partial in A. japonicus under DO2 compared with DO4 and DO8 suggest that the basic immune system could be affected by hypoxia in A. japonicus.
Fibrinogen is the principal protein responsible for blood clotting in vertebrates and its major function is as the precursor to fibrin. Fibrin also plays a key role in the inflammatory response (Gilliam et al., Reference Gilliam, Reed, Chauhan, Dehlendorf and Moore2011). The different expression levels of fibrinogen C domain-containing protein 1-B, partial, fibrinogen-like protein 1-like and fibrinogen-like protein A in A. japonicus under low DO conditions might indicate a disordered immune defence system.
Genes associated with hypoxia
When A. japonicus is stressed by hypoxia, some genes that are directly associated with hypoxia may be over-expressed. Angiopoietin-like 4 is induced under hypoxic conditions in various cell types and it is the target of peroxisome proliferator-activated receptors (Kim et al., Reference Kim, Park, Kim, Lee, Wang and DuBois2011). The encoded protein is a serum hormone, which is directly involved in the regulation of lipid metabolism. The overexpression of angiopoietin-related protein 4-like in A. japonicus under DO2 compared with DO4 and DO8 may be an indicator of the reaction to hypoxia.
Genes that are related to redox reactions associated with hypoxia were also involved. Thioredoxins were upregulated in A. japonicus under DO2 and DO4 compared with DO8, and they play important roles in maintaining cellular homeostasis in all living organisms. They participate in many important biological processes, including the positive regulation of various redox reactions via the reversible oxidation of its active centre dithiol to a disulphide, as well as catalysing dithiol-disulphide exchange reactions (Lemaire, Reference Lemaire2004; Park et al., Reference Park, Jung, Shim, Kim, Kim, Jeong and Kim2012).
SUPPLEMENTARY MATERIAL
The supplementary material for this article can be found at https://doi.org/10.1017/S002531541700162X.
ACKNOWLEDGEMENTS
The authors thank Beijing Genomics Institute (Shenzhen, China) for high throughput sequencing of the mRNA library.
FINANCIAL SUPPORT
This study was supported by National Natural Science Foundation of China (41676136), the Strategic Priority Research Program of the Chinese Academy of Sciences (XDA11020703), the Science and Technology Major Project of Shandong Province (Industry Transformation and Upgrading) (2015ZDZX05002).