INTRODUCTION
Cephalopods are one of the most important groups in marine ecosystems (Boyle & Rodhouse, Reference Boyle and Rodhouse2005; Jereb et al., Reference Jereb, Roper, Vecchione, Jereb and Roper2010). Their biomass and abundance can reach very high values in the north Pacific, south-western Atlantic and some other parts of the World Ocean (Pierce & Guerra, Reference Pierce and Guerra1994; Boyle & Rodhouse, Reference Boyle and Rodhouse2005). The significance of this group among the commercial invertebrates is great: the annual worldwide catch of cephalopods can exceed 4 million tonnes (Jereb et al., Reference Jereb, Roper, Vecchione, Jereb and Roper2010; Arkhipkin et al., Reference Arkhipkin, Rodhouse, Pierce, Sauer, Sakai, Allcock, Arguelles, Bower, Castillo, Ceriola, Chen, Chen, Diaz-Santana, Downeye, Gonzãlez, Amores, Green, Guerra, Hendrickson, Ibanez, Ito, Jereb, Kato, Katugin, Kawano, Kidokoro, Kulik, Laptikhovsky, Lipinski, Liu, Mariategui, Marin, Medina, Miki, Miyahara, Moltschaniwskyj, Moustahfid, Nabhitabhata, Nanjo, Nigmatullin, Ohtani, Pecl, Perez, Piatkowski, Saikliang, Salinas-Zavala, Steer, Tian, Ueta, Vijai, Wakabayashi, Yamaguchi, Yamashiro, Yamashita and Zeidberg2015). It is obvious that studies of biomass and abundance stock assessment should precede commercial fisheries.
Recently the Arctic has attracted the attention of scientists from all over the world especially because of the ongoing climate changes there (Walther et al., Reference Walther, Post, Convey, Menzel, Parmessan, Beebee, Fromentin, Hoegh-Guldberg and Bairlein2002; Jakobsen & Ozhigin, Reference Jakobsen and Ozhigin2012). The environmental conditions of the Arctic, such as the low temperatures and salinity (mean surface values are −1°C and 30o/oo, respectively), are unfavourable for cephalopods, so only a few species constantly live there (Treshnikov, Reference Treshnikov1985; Nesis, Reference Nesis2001; Golikov et al., Reference Golikov, Sabirov, Lubin and Jørgensen2013b). According to Nesis (Reference Nesis1987, Reference Nesis2001), and our own data, the most abundant cephalopod species in the Arctic are Rossia palpebrosa Owen, 1834 (Sepiolida) and Gonatus fabricii (Lichtenstein, 1818) (Teuthida). Bobtail squid, R. palpebrosa, is the most abundant species of demersal cephalopods and has a nektobenthic lifestyle (Nesis, Reference Nesis2001; Golikov et al., Reference Golikov, Sabirov, Lubin, Jørgensen and Beck2014). There are only scarce data on the quantitative distribution of R. palpebrosa: its densities of biomass and/or abundance are known for the Spitsbergen area (Lubin & Sabirov, Reference Lubin, Sabirov and Matishov2007), along the southern shore of Greenland (Frandsen & Wieland, Reference Frandsen and Wieland2004) and for the western part of the Baffin Sea (Treble, Reference Treble2007). In the two latter sources density has been calculated for all of the Arctic species of the Rossia genus, and denoted as Rossia sp. Thus, the importance of this species for the ecosystem is not fully understood, and there are no fisheries of this species. The squid G. fabricii is the only pelagic species of Arctic cephalopods (Nesis, Reference Nesis1987, Reference Nesis2001). It is a very important food source for whales, pinnipeds and fish in the Arctic, but no fisheries are currently known (Bjørke & Gjøsaeter, Reference Bjørke and Gjøsaeter1998; Bjørke, Reference Bjørke2001; Nesis, Reference Nesis2001; Roper et al., Reference Roper, Jorgensen, Katugin, Jereb, Jereb and Roper2010). Due to its importance for the food chains, there are more data on the quantitative distribution of G. fabricii, but most of these are only for certain parts of the Greenland area, the Greenland and Norwegian Seas (Nesis, Reference Nesis1965; Kristensen, Reference Kristensen1977, Reference Kristensen1984; Wiborg, Reference Wiborg1979, Reference Wiborg1980, Reference Wiborg1982; Wiborg et al., Reference Wiborg, Gjøsaeter and Beck1982, Reference Wiborg, Gjøsaeter and Beck1984; Sennikov et al., Reference Sennikov, Muchin and Bliznichenko1989; Piatkowski & Wieland, Reference Piatkowski and Wieland1993; Frandsen & Wieland, Reference Frandsen and Wieland2004; Treble, Reference Treble2007). These researches contain only the densities of biomass and/or abundance. The density is expressed in specimens or g (kg) per time period, and the data are usually obtained using different catching gear in each case. It all makes it hard to obtain a comprehensive picture. The total stock of G. fabricii biomass in the Norwegian and Greenland Seas with the Harstad pelagic trawl was assessed by Bjørke (Reference Bjørke1995, Reference Bjørke2001), Bjørke & Gjøsaeter (Reference Bjørke and Gjøsaeter1998) and Dalpadado et al. (Reference Dalpadado, Ellertsen, Melle and Skjøldal1998). The biomass of G. fabricii from these papers was extrapolated to the Barents Sea by Dommasnes et al. (Reference Dommasnes, Christensen, Ellertsen, Kvamme, Melle, Nøttestad, Pedersen, Tjelmeland, Zeller, Guenette, Christensen and Pauly2001) and Blanchard et al. (Reference Blanchard, Pinnegar and Mackinson2002). The Barents Sea differs from the Norwegian and Greenland Seas greatly due to its oceanographic conditions and bottom relief: it is much shallower, with the main part being occupied by a shelf, and it is located further into the Arctic, at a much greater distance from the reach of the warm Atlantic water masses (Boitsov et al., Reference Boitsov, Karsakov and Trofimov2012; Jakobsen & Ozhigin, Reference Jakobsen and Ozhigin2012). This all makes the mentioned extrapolations of G. fabricii biomass stock values from the Norwegian and Greenland Seas (Dommasnes et al., Reference Dommasnes, Christensen, Ellertsen, Kvamme, Melle, Nøttestad, Pedersen, Tjelmeland, Zeller, Guenette, Christensen and Pauly2001; Blanchard et al., Reference Blanchard, Pinnegar and Mackinson2002) incorrect.
As the studies on the quantitative distribution of cephalopods in the Arctic are rather limited, and almost completely absent for the Barents Sea, the main goal of our paper was to assess the biomass and abundance of the two most plentiful species of cephalopods in the Barents Sea. Also, an additional goal was to check whether recent climate changes in the Arctic influence the mentioned cephalopod species’ biomass and abundance there.
MATERIALS AND METHODS
Sampling and material analysis
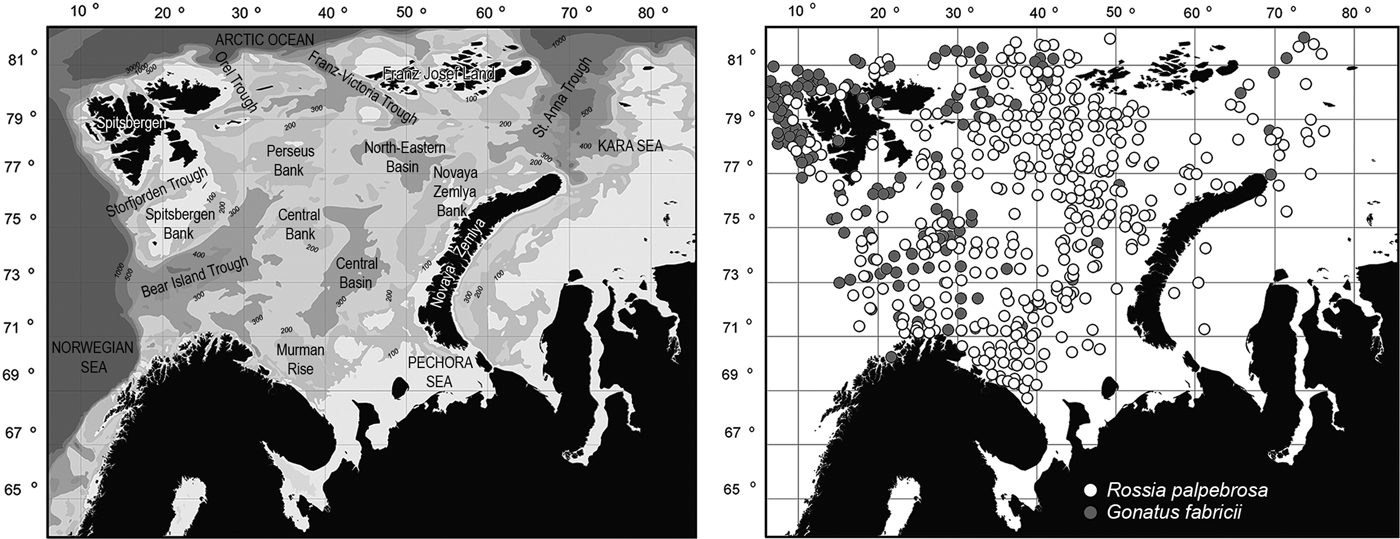
Samples of R. palpebrosa collected during the period 2007–2012 and of G. fabricii collected between 2009 and 2012 in the Barents Sea and adjacent parts of the Kara, Norwegian and Greenland Seas and of the Central Polar Basin were analysed. The borders of the studied area are ~68°42′N–82°31′N and 4°45′E–76°29′E (Figure 1). The samples were obtained annually in August to September during cruises of RV ‘Vilnus’, ‘Smolensk’ and ‘F. Nansen’ of the Polar Research Institute of Marine Fisheries and Oceanography and RV ‘G.O. Sars’, ‘Johan Hjort’, ‘Jan Mayen’ (later ‘Helmer Hanssen’) and ‘Christina E’ of the Institute of Marine Research.

Fig. 1. Study area in the Barents Sea and adjacent waters with main bottom relief elements, depths and positions of trawl catches.
In total, 871 specimens of R. palpebrosa and 699 specimens of G. fabricii were studied. We only had biomass and quantity, no other data, for 183 specimens of R. palpebrosa and 231 specimens of G. fabricii; for all others additional biological analysis was performed: mantle length (ML) was measured, and sex and maturity stage were assigned. Maturity stages of G. fabricii were assigned using the scales for squids (Lipinski & Underhill, Reference Lipinski and Underhill1995; Nigmatullin et al., Reference Nigmatullin, Sabirov and Zalygalin2003). The scale of maturity stages used for R. palpebrosa was developed (Golikov et al., Reference Golikov, Morov, Sabirov, Lubin and Jørgensen2013a) based on the mentioned cephalopod scales.
Rossia palpebrosa were sampled with bottom trawl gear. Gonatus fabricii were sampled with the same gear and pelagic trawl gear. The bottom trawl gear was a Campelen 1800 shrimp bottom trawl with rockhopper gear. The mesh size was 80 mm (stretched) in the front and 16–22 mm at the cod end. The horizontal opening was 20 m, and the vertical opening was 5 m (McCallum & Walsh, Reference McCallum and Walsh1997; Johannesen et al., Reference Johannesen, Lindstrom, Michalsen, Skern-Mauritzen, Fauchald, Bogstad and Dolgov2012). The pelagic trawl gear used was a Harstad trawl with a 20 × 20 m mouth opening; the mesh sizes of the panels ranged from 100 mm in the first panel to 30 mm in the last. The cod end consists of three nets of different mesh sizes, with the smallest being 7 mm (Eriksen et al., Reference Eriksen, Bogstad and Nakken2011; Johannesen et al., Reference Johannesen, Lindstrom, Michalsen, Skern-Mauritzen, Fauchald, Bogstad and Dolgov2012).
Data analysis
The relations of sampled biomass/abundance and total biomass/abundance at the point of sampling are shown by the following equations (Walsh, Reference Walsh1996):
where f – fishing effort, q – catchability coefficient, b – sampled biomass, B c – total biomass at the point of sampling, n – sampled abundance and N c – total abundance at the point of sampling. The fishing effort value (f) is not usually used in scientific surveys because the trawls used are standardized by using the same tow duration and the catches obtained are recalculated for the same towing time (Walsh, Reference Walsh1996). The standard towing time for the bottom trawl gear was 15 min at 3 knots, equivalent to a towing area of about 25,000 m2. If the towing duration was different, the biomass and abundance of catch were recalculated for the mentioned standard square. The pelagic trawl was towed for a standard time of 60 min (20 min each at the surface, 20 m and 40 m, and additional tows deeper if there were hydro-acoustic registrations of 0-group fish farther down). This method is detailed in Eriksen et al. (Reference Eriksen, Bogstad and Nakken2011). For convenient comparison with the bottom trawl gear we recalculated the catch for 15 min also, equivalent to a towing area of about 18,000 m2. There are no catchability coefficients (q) for Arctic cephalopods in the literature. Nonetheless, we presume it is necessary to use a catchability coefficient, as its efficacy was proved by modern papers on cephalopod stock assessment (Pierce & Guerra, Reference Pierce and Guerra1994; Walsh, Reference Walsh1996; Shuntov & Bocharov, Reference Shuntov and Bocharov2003) as well as classical works on fisheries biology (Baranov, Reference Baranov1918; Gulland, Reference Gulland1964). There are no catchability coefficients for bobtail squids at all in the literature. With our bottom gear, Campelen 1800, the only catchability coefficients known for the invertebrates are the ones from Lubin (Reference Lubin, Sokolov and Alekseev2006, Reference Lubin and Matishov2010): q = 0.002 for all macrobenthic (the ones bigger than a few millimetres in size) invertebrates and q = 0.28 for nektobenthic shrimp, Pandalus borealis Krøyer, 1838. The latter one was used in calculations for R. palpebrosa. Catchability coefficients for boreopacific Gonatidae from Shuntov & Bocharov (Reference Shuntov and Bocharov2003) were used in calculations for G. fabricii: q = 0.01 if ML < 40 mm, q = 0.05 if ML 41–80 mm, q = 0.1 if ML > 80 mm. With the mentioned coefficients, the total biomass at the point of sampling with bottom and pelagic trawl gears was respectively:
 $$\eqalign{& B_{\rm c} = \displaystyle{{b \times {10}^6} \over {q \times S_{\rm C} \times {10}^{ - 3}}}, \cr & B_{\rm c} = \displaystyle{{b \times {10}^6} \over {q \times S_{\rm H} \times {10}^{ - 3}}},} $$
where b – sampled biomass (g per 15 min towing), B c – total biomass at the point of sampling (kg km−2), q – catchability coefficient, S C – standard area of bottom towing (25,000 m2), S H – standard area of pelagic towing (18,000 m2), 106 – coefficient to convert m2 to km2 and 10−3 – coefficient to convert g to kg. In this case, total abundance at the point of sampling with bottom and pelagic trawl gears was respectively:
 $$\eqalign{& N_{\rm c} = \displaystyle{{n \times {10}^6} \over {q \times S_{\rm C}}}, \cr & N_{\rm c} = \displaystyle{{n \times {10}^6} \over {q \times S_{\rm H}}},} $$
where n – sampled abundance (specimens per 15 min towing), N c – total abundance at the point of sampling (specimens km−2), q – catchability coefficient, S C – standard area of bottom towing (25,000 m2), S H – standard area of pelagic towing (18,000 m2) and 106 – coefficient to convert m2 to km2.
Isoline maps of biomass and abundance distribution were plotted based on the obtained data using the method of kriging (Cressie, Reference Cressie1990; Levin, Reference Levin1994). Total stocks of biomass and abundance for the studied area were calculated as:
where s i – cohort area (km2), B i – mean biomass inside the cohort (kg km−2), B – total stock of biomass (kg), N i – mean abundance inside the cohort (specimens km−2) and N – total stock of abundance (specimens). The obtained values of biomass and abundance were extrapolated to the whole area of the species’ range in the studied sea.
It was decided to check whether the climate conditions of the Barents Sea influence the quantitative character of the cephalopod distribution there. This is especially timely at present bearing in mind the ongoing climate changes, which have led to the warming of the Arctic (Walther et al., Reference Walther, Post, Convey, Menzel, Parmessan, Beebee, Fromentin, Hoegh-Guldberg and Bairlein2002; Jakobsen & Ozhigin, Reference Jakobsen and Ozhigin2012). As has already been demonstrated, the warming has caused the appearance of new boreal-subtropical cephalopod species in the Arctic (Sabirov et al., Reference Sabirov, Lubin and Golikov2009, Reference Sabirov, Golikov, Nigmatullin and Lubin2012; Golikov et al., Reference Golikov, Sabirov, Lubin and Jørgensen2013b, Reference Golikov, Sabirov, Lubin, Jørgensen and Beck2014). The mean inter-annual values of the Barents Sea water temperatures in the different layers were taken from Jakobsen & Ozhigin (Reference Jakobsen and Ozhigin2012). The climate index of the Barents Sea was used as a measure of its climate conditions. It is a complex indicator that is calculated based on many environmental factors (Boitsov et al., Reference Boitsov, Karsakov and Trofimov2012). The exact values of the climate index of the Barents Sea for the studied years were provided to us by one of the authors of this term (Trofimov, personal communication). We had only a limited series of annual data, six years for R. palpebrosa and four for G. fabricii, and they do not fit normal distribution. So, the best correlation coefficient to use in that situation was Kendall's tau correlation. Also ANOVA with a posteriori Tukey's honestly significant difference test was used to estimate the significance level of mean value differences (Hammer & Harper, Reference Hammer and Harper2006; Zar, Reference Zar2010).
Surfer 8.0, MapViewer 7.1 (Golden Software) and AreaS 2.1 (Permyakov, http://www.ssaa.ru) were used for map creation and post-processing; Statistica 10 (Statsoft), PAST 2.17c (Hammer & Harper, http://folk.oio.no/ohammer/past) and MS Excel 2003, 2010 were used for statistical analyses and other calculations.
RESULTS
Rossia palpebrosa
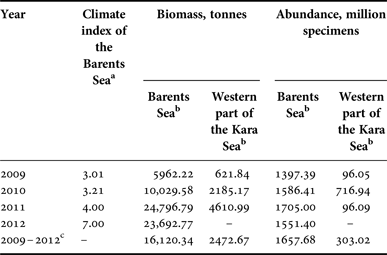
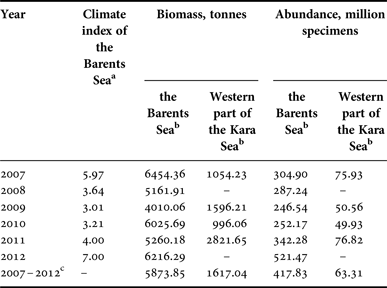
Interannual changes in the biomass and abundance of R. palpebrosa were characterized by quite low values. The maximum difference in the interannual biomass during the study period was about 1.5 times, and in abundance about two times. The maximum biomass in the Barents Sea was detected in 2007, 2010 and 2012, when it exceeded 6 thousand tonnes. The minimum biomass, about 4 thousand tonnes, was detected in 2009 (Figures 2 & 3, Table 1). The maximum abundance in the Barents Sea was detected in 2012, when it exceeded 520 million specimens, and this was much lower in all the other studied years. The minimum abundance was detected in 2009, the same as the minimum biomass, and reached about 250 million specimens. So the biomass and abundance of R. palpebrosa changed inter-annually with no significant relationship to each other, and Kendall's tau correlation between them (t = 0.466634, P = 0.1886) was not significant.

Fig. 2. Biomass of Rossia palpebrosa in the Barents Sea and adjacent waters.

Fig. 3. Abundance of Rossia palpebrosa in the Barents Sea and adjacent waters.
Table 1. Biomass and abundance of Rossia palpebrosa in the Barents Sea and western part of the Kara Sea.
a Values of the Barents Sea climate index were taken from Boitsov et al., Reference Boitsov, Karsakov and Trofimov2012, and Trofimov, personal communication.
b Extrapolated for the whole area of the species’ range in the sea;
c Mean data for all studied years.
The areas with the highest density values of biomass (10.1–30.0 kg km−2) were located mostly in the northern and eastern parts of the Barents Sea: from the Franz Victoria Trough to the North-Eastern Basin, North-Eastern Plateau, Novaya Zemlya Bank (except for the most shallow areas with depths of less than 100 m) and the northern part of the Central Basin (Figure 2). In addition, the maximum densities of biomass were recorded in the southern and south-eastern parts of the Central Basin in 2007, and at Isfjorden to the west of Spitsbergen in 2011. According to our data, most of the areas with maximum biomass lay within isotherms of −1.0 to 0.0°С at depths of 150–400 m. The areas with the minimum density of biomass (lower than 1.0 kg km−2) were concentrated mostly in the western and occasionally in the south-eastern parts of the Barents Sea. They annually represented up to 25% of the studied area. The patterns of abundance density distribution were quite similar to those described above. The areas with the maximum density of abundance (1–2 thousand specimens km−2) were located in 2007 and 2011–2012 from the Franz Victoria Trough to the North-Eastern Basin, in the southern part of the Central Basin and at Isfjorden to the west of Spitsbergen. The depths were 200–450 m and the mean inter-annual bottom temperatures varied from −1.0 to +3.0°С. The biggest part of the studied area was usually characterized by low densities of abundance, with fewer than 150 specimens km−2 (Figure 3). Correlation analysis of the biomass and abundance of R. palpebrosa in relation to the climate index of the Barents Sea for the current and previous years showed that Kendall's tau correlation was not significant in all cases, except for abundance vs ongoing year's climate index, when t = 0.866667, P = 0.0411.
Data for the western part of the Kara Sea are still rather scarce and therefore showed only an approximate pattern. The maximum biomass there, about 2.8 thousand tonnes, was detected in 2011. The minimum biomass, less than 1 thousand tonnes, was detected in 2010 (Figures 2 & 3, Table 1). The maximum abundance in the Kara Sea was detected in 2007 and 2011, when it exceeded 75 million specimens, and it was 1.5 times less in all the other studied years, at about 50 million specimens (Table 1). The area with the maximum density of biomass with average values of abundance was located in St. Anna's Trough.
Gonatus fabricii
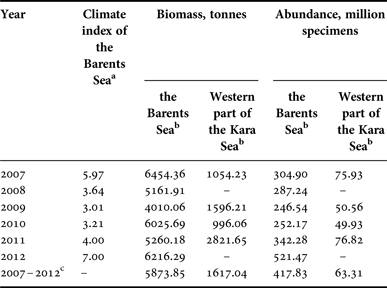
Interannual changes in the biomass of G. fabricii were much bigger than in previous species. The maximum biomass in the Barents Sea was detected in 2011, when it exceeded 24.5 thousand tonnes, while the minimum biomass of about 6 thousand tonnes was detected in 2009. At the same time, inter-annual differences in abundance varied slightly, from about 1.4 billion to more than 1.7 billion specimens (Table 2). A significant Kendall's tau correlation was not observed between biomass and abundance with the climate index of the Barents Sea for current and previous years. Data on the quantitative distribution of G. fabricii in St. Anna's Trough in the Kara Sea are still limited, and therefore showed only an approximate pattern. Biomass varied from about 0.6 thousand tonnes to about 4.6 thousand tonnes with abundance from about 100 million up to more than 700 million specimens (Table 2).
Table 2. Biomass and abundance of Gonatus fabricii in the Barents Sea and western part of the Kara Sea.
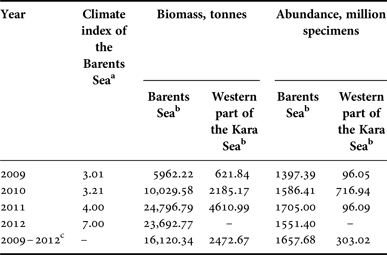
a Values of the Barents Sea climate index were taken from Boitsov et al., Reference Boitsov, Karsakov and Trofimov2012, and Trofimov, personal communication.
b Extrapolated for the whole area of the species’ range in the sea;
c Mean data for all studied years.
In most parts of the Barents Sea the density of biomass was about 10.0 kg km−2 with abundance of about 1 thousand specimens km−2 (Figures 4 & 5). The areas with high density of biomass (more than 100 kg km−2) and abundance (more than 10 thousand specimens km−2) were concentrated in deep-water troughs and trenches in the marginal parts of the Barents Sea and in adjacent deep-water areas: the north-eastern part of the Greenland Sea, the Bear Island Trough and its border with the Norwegian Sea, the Franz Victoria Trough and Orel Trough in the Barents Sea, and St. Anna's Trough in the Kara Sea (Figures 4 & 5). The first two areas were located above the big depths and mostly consisted of aggregations from epipelagic immature squids (maturity stages I–II) and meso-/bathypelagic maturing ones (late II and III–IV maturity stages). The maximum values of biomass and abundance were recorded in the upper 100-metre layer in the north-eastern part of the Greenland Sea, where the density of epipelagic immature squids reached 279 kg km−2 and 96 thousand specimens km−2. The mean ML of the squids in the area was 19 ± 3.3 mm. In the western part of the Barents Sea, the mean ML was significantly (P = 0.0047) higher and reached 47 ± 1.9 mm. In the eastern part of the Barents Sea and the western part of the Kara Sea, including two remaining areas with high densities of biomass and abundance, only meso-/bathypelagic specimens were sampled. In the eastern part of the Barents Sea, the mean ML increased up to 83 ± 4.4 mm (P = 0.0036) and reached 91 ± 2.8 mm (P = 0.0042) in St. Anna's Trough in the Kara Sea.

Fig. 4. Biomass of Gonatus fabricii in the Barents Sea and adjacent waters.

Fig. 5. Abundance of Gonatus fabricii in the Barents Sea and adjacent waters.
DISCUSSION
Species biomass and abundance in the Barents Sea
Values of biomass and abundance densities of R. palpebrosa assessed in the Spitsbergen area, along the southern shore of Greenland and in the western part of the Baffin Sea (Frandsen & Wieland, Reference Frandsen and Wieland2004; Lubin & Sabirov, Reference Lubin, Sabirov and Matishov2007; Treble, Reference Treble2007) were lower than our mean values of densities (4.06 ± 0.22 kg km−2 and 278 ± 13.07 specimens km−2) in the Barents Sea. Thus the environmental conditions in the north-eastern parts of the Barents Sea with mean inter-annual temperatures ranging from −1.0 to 0.0°С at depths of 200–400 m fitted most perfectly for R. palpebrosa to reach maximum concentrations. In other parts of the World Ocean, the density of Sepiolida abundance was assessed in the Mediterranean Sea (Lefkaditou et al., Reference Lefkaditou, Maiorano and Mytilineou2001; Lefkaditou & Kaspiris, Reference Lefkaditou and Kaspiris2005) and Porcupine Seabight and Porcupine Abyssal Plain in the north-east Atlantic (Collins et al., Reference Collins, Yau, Allcock and Thuston2001). Different bottom trawls without any catchability coefficients shown (most probably they are different) were used in those reports, resulting in lower values than ours from the Barents Sea. The most abundant species in the north-eastern Atlantic were Sepiola atlantica Orbigny, 1839 and Sepietta oweniana (Orbigny, 1839) with an abundance of up to 116 specimens km−2 (Collins et al., Reference Collins, Yau, Allcock and Thuston2001) and S. oweniana in the Mediterranean Sea with an abundance of up to 44 specimens per unit effort (Lefkaditou et al., Reference Lefkaditou, Maiorano and Mytilineou2001; Lefkaditou & Kaspiris, Reference Lefkaditou and Kaspiris2005).
Macrozoobenthos of the Barents Sea as a whole is quite well studied, often with usage of Campelen 1800 bottom trawl gear (reviews: Wassmann et al., Reference Wassmann, Reigstad, Haug, Rudels, Carroll, Hop, Gabrielsen, Falk-Petersen, Denisenko, Arashkevich, Slagstad and Pavlova2006; Jakobsen & Ozhigin, Reference Jakobsen and Ozhigin2012). In the north-eastern parts of the sea, where the biggest aggregations of R. palpebrosa were found, interannual values of total macrozoobenthos density of biomass are usually below average, which is about 147 tonnes km−2. Moreover, the main areas with maximum densities of macrozoobenthos biomass were mostly located in the southern, south-eastern and north-central parts of the Barents Sea, where the biomass density of R. palpebrosa did not reach more than 5–7 kg km−2, which is 5.5–6 times below the maximum assessed values. This all shows that even if R. palpebrosa is quite abundant for the bobtail squid compared with other studies (Collins et al., Reference Collins, Yau, Allcock and Thuston2001; Lefkaditou et al., Reference Lefkaditou, Maiorano and Mytilineou2001; Frandsen & Wieland, Reference Frandsen and Wieland2004; Lefkaditou & Kaspiris, Reference Lefkaditou and Kaspiris2005; Lubin & Sabirov, Reference Lubin, Sabirov and Matishov2007; Treble, Reference Treble2007), it is definitely not very abundant in comparison to the major taxa of benthic invertebrates of the Barents Sea (reviews: Wassmann et al., Reference Wassmann, Reigstad, Haug, Rudels, Carroll, Hop, Gabrielsen, Falk-Petersen, Denisenko, Arashkevich, Slagstad and Pavlova2006; Jakobsen & Ozhigin, Reference Jakobsen and Ozhigin2012).
The total stock of G. fabricii biomass in the Norwegian and Greenland Seas based on Harstad pelagic trawl catches was previously assessed as 1.5 million tonnes of epipelagic immature squids (Bjørke, Reference Bjørke2001), 2 million tonnes of epipelagic immature squids and 6.4 million tonnes of meso-/bathypelagic squids with a mean interannual density of 2.63 tonnes km−2 (Bjørke, Reference Bjørke1995; Bjørke & Gjøsaeter, Reference Bjørke and Gjøsaeter1998) or 4.1 million tonnes (Dalpadado et al., Reference Dalpadado, Ellertsen, Melle and Skjøldal1998). All the mentioned assessments are much bigger than our values for the Barents Sea. The main reason for the difference is that the bottom relief of the Norwegian and Greenland Seas mostly consists of deep-water trenches and troughs, where four out of seven G. fabricii reproductive spots are located (Bjørke, Reference Bjørke1995, Reference Bjørke2001). The squid is supposed to live in these seas throughout its life cycle (Bjørke, Reference Bjørke1995, Reference Bjørke2001; Arkhipkin & Bjørke, Reference Arkhipkin and Bjørke2000). The Barents Sea in its marginal westernmost part is comparable to the Norwegian and Greenland Seas due to its primary production values (Sakshaug et al., Reference Sakshaug, Johnsen and Kovacs2009; Dalpadado et al., Reference Dalpadado, Arrigo, Hjøllo, Rey, Ingvaldsen, Sperfeld, van Dijken, Stige, Olsen and Ottersen2014). In these parts of the Barents Sea the areas with maximum densities of G. fabricii are located. Considerable densities of abundance of immature epipelagic stages of this squid in the border area of the Barents, Norwegian and Greenland Seas have been known since the 1980s (Wiborg, Reference Wiborg1979, Reference Wiborg1980, Reference Wiborg1982; Wiborg et al., Reference Wiborg, Gjøsaeter and Beck1982, Reference Wiborg, Gjøsaeter and Beck1984; Sennikov et al., Reference Sennikov, Muchin and Bliznichenko1989). But the rest, the main part of the Barents Sea, its shelf, is far less productive (Sakshaug et al., Reference Sakshaug, Johnsen and Kovacs2009; Dalpadado et al., Reference Dalpadado, Arrigo, Hjøllo, Rey, Ingvaldsen, Sperfeld, van Dijken, Stige, Olsen and Ottersen2014). The values of G. fabricii biomass and abundance there were low and aggregations were formed only in deep-water troughs and trenches in the marginal parts of the Barents Sea and in adjacent deep-water areas. The aggregations found on the western side of the studied area were much bigger. The density of G. fabricii biomass and abundance in Greenland waters outside the Greenland Sea (Nesis, Reference Nesis1965; Kristensen, Reference Kristensen1977, Reference Kristensen1984; Piatkowski & Wieland, Reference Piatkowski and Wieland1993; Frandsen & Wieland, Reference Frandsen and Wieland2004) is less than in aggregations we found, but bigger than mean values from the main shelf parts of the Barents Sea. The biomass of scyphozoan jellyfish and major commercial fish species in the Barents Sea was also assessed with Harstad pelagic trawl gear (Eriksen et al., Reference Eriksen, Bogstad and Nakken2011, Reference Eriksen, Prozorkevich, Trofimov and Howell2012; Jakobsen & Ozhigin, Reference Jakobsen and Ozhigin2012; Johannesen et al., Reference Johannesen, Lindstrom, Michalsen, Skern-Mauritzen, Fauchald, Bogstad and Dolgov2012). Mostly the values varied from 900 thousand tonnes up to several million tonnes and more. The stock of G. fabricii biomass we found was comparable only to lumpfish, Cyclopterus lumpus L., 1758, which had a mean interannual biomass in the Barents Sea of about 48 thousand tonnes (Eriksen et al., Reference Eriksen, Durif and Prozorkevich2014).
So our estimated values of the biomass and abundance of R. palpebrosa and G. fabricii are much lower than those of major groups of pelagic and bottom fishes and invertebrates in the Barents Sea (Wassmann et al., Reference Wassmann, Reigstad, Haug, Rudels, Carroll, Hop, Gabrielsen, Falk-Petersen, Denisenko, Arashkevich, Slagstad and Pavlova2006; Eriksen et al., Reference Eriksen, Bogstad and Nakken2011, Reference Eriksen, Prozorkevich, Trofimov and Howell2012; Jakobsen & Ozhigin, Reference Jakobsen and Ozhigin2012; Johannesen et al., Reference Johannesen, Lindstrom, Michalsen, Skern-Mauritzen, Fauchald, Bogstad and Dolgov2012). It was concluded that even if R. palpebrosa and G. fabricii are quite abundant in the Barents Sea, they obviously are not the major components of the Barents Sea ecosystems according to their biomass and abundance. Thus, it was suggested that the importance of cephalopods in the Arctic ecosystems, at least in terms of quantitative distribution, could be somewhat lower than in the Antarctic (Collins & Rodhouse, Reference Collins and Rodhouse2006) or tropical parts of the World Ocean (Jereb et al., Reference Jereb, Roper, Vecchione, Jereb and Roper2010).
Influence of climate change
The impact of the ongoing warming of the Arctic (Walther et al., Reference Walther, Post, Convey, Menzel, Parmessan, Beebee, Fromentin, Hoegh-Guldberg and Bairlein2002; Boitsov et al., Reference Boitsov, Karsakov and Trofimov2012) on the distribution of cephalopods there has already been recorded repeatedly: the range of G. fabricii has increased and three new boreal-subtropical species have appeared in the Arctic (Sabirov et al., Reference Sabirov, Lubin and Golikov2009, Reference Sabirov, Golikov, Nigmatullin and Lubin2012; Golikov et al., Reference Golikov, Sabirov, Lubin and Jørgensen2013b, Reference Golikov, Sabirov, Lubin, Jørgensen and Beck2014). The previously known border of the G. fabricii range was at ~40°Е in the Barents Sea (Kristensen, Reference Kristensen1984; Gardiner & Dick, Reference Gardiner and Dick2010; Roper et al., Reference Roper, Jorgensen, Katugin, Jereb, Jereb and Roper2010). It was established that its range has increased to the whole eastern part of the Barents Sea, except the margins of Novaya Zemlya Bank, and the western part of the Kara Sea, St. Anna's Trough (Golikov et al., Reference Golikov, Sabirov and Lubin2012, Reference Golikov, Sabirov, Lubin and Jørgensen2013b). Its quantity inside the new parts of the range is low, except inside the deep-water trenches and troughs in the north-eastern part (Figures 4 & 5). But does climate change really affect the abundance and biomass values of R. palpebrosa and G. fabricii in the Barents Sea? It is unknown what the values of studied species’ biomass and abundance in the Barents Sea were before climate change. The climate index of the Barents Sea was higher than the average values throughout the studied period, 2007–2012 (Boitsov et al., Reference Boitsov, Karsakov and Trofimov2012; Trofimov, personal communication), which means that these were warm years. The warmest of them were 2007 and 2012, the same years as when the maximum biomass of R. palpebrosa was recorded (Figure 6). Also, there was a point of view that the biomass of some benthos taxa in the Barents Sea can ‘respond’ to changes in climate conditions with a lag of up to a few years, according to the taxa's life cycle duration (Matishov et al., Reference Matishov, Moiseev, Lyubina, Zhichkin, Dzhenyuk, Karamushko and Frolova2012). To check this assumption with our species we performed a correlation analysis of the biomass and abundance of the studied cephalopod species in relation to the climate index of the Barents Sea for the current and previous years, because the exact duration of the species’ life cycles in the Barents Sea is not known for sure; it is only known for other close species or areas (von Boletzky & von Boletzky, Reference von Boletzky and von Boletzky1973; Arkhipkin, Reference Arkhipkin1995; Arkhipkin & Bjørke, Reference Arkhipkin and Bjørke2000). The climate of the current and previous years showed no significant impact on the biomass and abundance of the studied species in the correlation analysis performed. The only exception was the abundance of R. palpebrosa, which correlated with the current year's climate conditions. This is also noticeable from the graph presented (Figure 6). This could be explained by suggesting greater survival of juveniles due to larger amounts of food available to them, because during the warmer years the total macrozoobenthos biomass is usually bigger (Jakobsen & Ozhigin, Reference Jakobsen and Ozhigin2012).
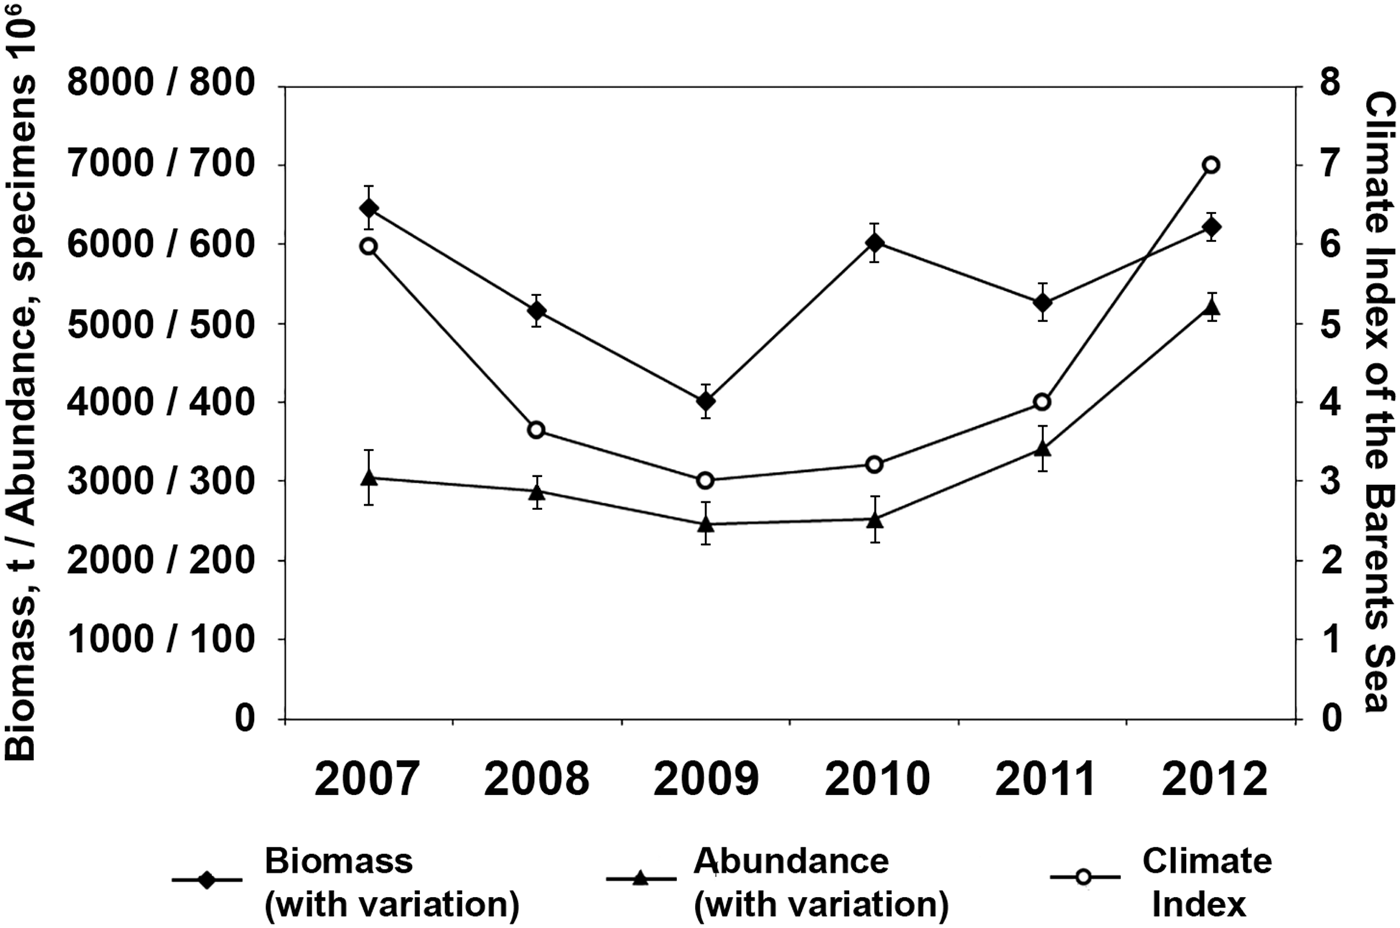
Fig. 6. Biomass and abundance of Rossia palpebrosa in the Barents Sea in relation to its climate index.
ACKNOWLEDGEMENTS
We are grateful to Denis V. Zakharov (PINRO) and Lis L. Jørgensen (IMR) for providing parts of material, to Alexander G. Trofimov (PINRO) for help with climate index of the Barents Sea, to scientific groups and crews of mentioned RVs. Also we wish to thank three anonymous referees for valuable comments which helped to improve the paper.
FINANCIAL SUPPPORT
This research was partly supported by the Norwegian-Russian Programme of the Barents Sea ecosystem survey.


