


Introduction
Estuaries are highly productive systems (McLusky & Elliott, Reference McLusky and Elliott2004) that support nursery areas for many marine fish species (Kerstan, Reference Kerstan1991; Beck et al., Reference Beck, Heck, Able, Childers, Eggleston, Gillanders, Halpern, Hays, Hoshino, Minello, Orth, Sheridan and Weinstein2001; Potter et al., Reference Potter, Tweedley, Elliott and Whitfield2015). Early life stages of fishes find suitable conditions in nursery habitats that enhance body condition, growth and survival through high food availability and shelter from predation (Boesch & Turner, Reference Boesch and Turner1984; Gibson, Reference Gibson1994; Pihl et al., Reference Pihl, Cattrijsse, Codling, Mathieson, McLusky and Roberts2007). Ultimately, nursery conditions promote recruitment, and therefore maintain the adult populations (Gibson, Reference Gibson1994; Rijnsdorp et al., Reference Rijnsdorp, Berghahn, Miller and Van Der Veer1995; Beck et al., Reference Beck, Heck, Able, Childers, Eggleston, Gillanders, Halpern, Hays, Hoshino, Minello, Orth, Sheridan and Weinstein2001). The quantity and quality of habitat together with food availability are major determinants of nursery carrying capacity (Gibson, Reference Gibson1994; Nunn et al., Reference Nunn, Tewson and Cowx2012; Le Pape & Bonhommeau, Reference Le Pape and Bonhommeau2015), in terms of the maximum number of individuals or biomass that can ecologically be supported by an area (Elliott et al., Reference Elliott, Burdon, Hemingway and Apitz2007). However, historically there has been a high loss of estuarine areas and habitats (Wolanski & Elliott, Reference Wolanski and Elliott2015; Amorim et al., Reference Amorim, Ramos, Elliott, Franco and Bordalo2017), and there is a need for management measures promoting remediation of these habitats (Elliott et al., Reference Elliott, Mander, Mazik, Simenstad, Valesini, Whitfield and Wolanski2016). Hence, it is important to know whether food and space resources have diminished for fishes, including economically valuable species, and whether this has in turn decreased the estuarine carrying capacity.
The dispersal of juveniles supports ecological interactions between the different units that comprise nursery habitats, ensuring connectivity (Sheaves, Reference Sheaves2009; Palmer et al., Reference Palmer, Coulon and Travis2014). Losses in connectivity may decrease trophic interactions and lead to food web fragmentation, compromising the system resilience and nursery function (Vinagre et al., Reference Vinagre, Salgado, Cabral and Costa2011; Selleslagh et al., Reference Selleslagh, Blanchet, Bachelet and Lobry2015). Similarly, a loss of connectivity would increase competition for scarce resources within an area. Moreover, distribution patterns will reflect abiotic factors, such as temperature, salinity, depth, sediment type (Power et al., Reference Power, Attrill and Thomas2000; Andersen et al., Reference Andersen, Schou, Sparrevohn, Nicolajsen and Støttrup2005a; Ramos et al., Reference Ramos, Ré and Bordalo2009; Vasconcelos et al., Reference Vasconcelos, Reis-Santos, Maia, Fonseca, França, Wouters, Costa and Cabral2010) and biotic factors such as prey availability, predation and competition (van der Veer et al., Reference van der Veer, Berghahn, Miller and Rijnsdorp2000; Darnaude et al., Reference Darnaude, Harmelin-Vivien and Salen-Picard2001; Amara et al., Reference Amara, Selleslagh, Billon and Minier2009; Sheaves et al., Reference Sheaves, Baker, Nagelkerken and Connolly2015). In particular, prey availability is likely to affect the condition and growth of juveniles (Cabral et al., Reference Cabral, Lopes and Loeper2002; Amara et al., Reference Amara, Selleslagh, Billon and Minier2009; De Raedemaecker et al., Reference De Raedemaecker, Brophy, O'Connor and O'Neill2012b), and hence nursery value. Therefore, migrations and recruitment to areas with high prey availability may either optimize resource use or prevent food limitation, thus minimizing competition (Tableau et al., Reference Tableau, Brind'Amour, Woillez and Le Bris2016). These migrations may shape habitat and resource partitioning between different life stages and species in nursery habitats (Darnaude et al., Reference Darnaude, Harmelin-Vivien and Salen-Picard2001; Russo et al., Reference Russo, Pulcini, O'Leary, Cataudella and Mariani2008). Apart from migration, other resource use and resource partitioning strategies include feeding on highly abundant prey (Molinero & Flos, Reference Molinero and Flos1992; Vinagre et al., Reference Vinagre, França, Costa and Cabral2005), ontogenetic shifts in the diet (Aarnio et al., Reference Aarnio, Bonsdorff and Rosenback1996; Kopp et al., Reference Kopp, Le Bris, Grimaud, Nérot and Brind'Amour2013) and temporal differences in habitat use (Cabral & Costa, Reference Cabral and Costa1999).
Stomach contents analysis offers a snapshot of the fish diet (Hyslop, Reference Hyslop1980; Marshall & Elliott, Reference Marshall and Elliott1997), which can be combined with stable isotope information to give broader temporal information (DeNiro & Epstein, Reference DeNiro and Epstein1978; Minagawa & Wada, Reference Minagawa and Wada1984; Peterson & Fry, Reference Peterson and Fry1987) to gauge trophic relationships. Carbon (δ13C) stable isotope ratios help to explain the diet composition of consumers (DeNiro & Epstein, Reference DeNiro and Epstein1978; Fry & Sherr, Reference Fry, Sherr, Rundel, Ehleringer and Nagy1989), while δ15N can also indicate trophic position (DeNiro & Epstein, Reference DeNiro and Epstein1981; Post, Reference Post2002). Recently, stable isotope mixing models (Parnell et al., Reference Parnell, Phillips, Bearhop, Semmens, Ward, Moore, Jackson, Grey, Kelly and Inger2013; Phillips et al., Reference Phillips, Inger, Bearhop, Jackson, Moore, Parnell, Semmens and Ward2014) have been used to identify the main prey and organic matter sources (Le Pape et al., Reference Le Pape, Modéran, Beaunée, Riera, Nicolas, Savoye, Harmelin-Vivien, Darnaude, Brind'Amour, Le Bris, Cabral, Vinagre, Pasquaud, França and Kostecki2013; Hoffman et al., Reference Hoffman, Kelly, Peterson and Cotter2015; Dias et al., Reference Dias, Morais, Faria, Antunes and Hoffman2017), and to characterize trophic niche widths and niche overlap between species (Kostecki et al., Reference Kostecki, Roussel, Desroy, Roussel, Lanshere, Le Bris and Le Pape2012; Vaslet et al., Reference Vaslet, Phillips, France, Feller and Baldwin2015). This information may then be integrated to track movements over variable temporal and spatial scales, and identify key habitats regarding food use (Green et al., Reference Green, Smith, Grey and Underwood2012; Kopp et al., Reference Kopp, Le Bris, Grimaud, Nérot and Brind'Amour2013; Selleslagh et al., Reference Selleslagh, Blanchet, Bachelet and Lobry2015).
Indices of fish condition are valuable in assessing nursery habitat quality (Gilliers et al., Reference Gilliers, Amara and Bergeron2004; Fonseca et al., Reference Fonseca, Vinagre and Cabral2006; De Raedemaecker et al., Reference De Raedemaecker, Brophy, O'Connor and Comerford2012a), by measuring individual somatic nutritional status, and hence the potential for growth and reproduction. These indices, including morphometric and biochemical ones, respond to environmental conditions over various temporal scales (Suthers et al., Reference Suthers, Fraser and Frank1992; Fonseca et al., Reference Fonseca, Vinagre and Cabral2006). The Fulton condition factor, K (Ricker, Reference Ricker1975) is a morphometric index widely used to measure fish somatic condition (Amara et al., Reference Amara, Selleslagh, Billon and Minier2009; Vasconcelos et al., Reference Vasconcelos, Reis-Santos, Fonseca, Ruano, Tanner, Costa and Cabral2009; De Raedemaecker et al., Reference De Raedemaecker, Brophy, O'Connor and Comerford2012a), considering that for a given length, the heavier fish are in better condition. The Fulton K is sensitive to the nutritional status of the juveniles (Ferron & Leggett, Reference Ferron and Leggett1994; Selleslagh & Amara, Reference Selleslagh and Amara2013) and integrates condition over the preceding weeks to months (e.g. Caldarone et al., Reference Caldarone, MacLean and Sharack2012; De Raedemaecker et al., Reference De Raedemaecker, Brophy, O'Connor and Comerford2012a). Complementary to this, the biochemical RNA:DNA ratio indicates recent nutritional condition and growth (Clemmesen, Reference Clemmesen1994; Malloy & Targett, Reference Malloy and Targett1994; Chícharo & Chícharo, Reference Chícharo and Chícharo2008). It assumes that the DNA content in a somatic cell remains constant, while the RNA concentration reflects changes in protein synthesis rates (Bulow, Reference Bulow1970; Buckley et al., Reference Buckley, Caldarone and Ong1999), i.e. in a non-stressful situation, higher RNA:DNA ratio reflects higher somatic growth of the fish. Furthermore, the RNA:DNA responds to changes in food availability within days (e.g. Clemmesen, Reference Clemmesen1994; Selleslagh & Amara, Reference Selleslagh and Amara2013; Foley et al., Reference Foley, Bradley and Höök2016).
The flatfish European flounder Platichthys flesus (L. 1758) uses estuarine habitats as nurseries (Henderson & Holmes, Reference Henderson and Holmes1991; Kerstan, Reference Kerstan1991; Martinho et al., Reference Martinho, Leitão, Neto, Cabral, Lagardère and Pardal2008), including the Lima estuary (northern Portugal) (Ramos et al., Reference Ramos, Ré and Bordalo2010) where they are an important component of the estuarine fish community. The NW Portuguese coast represents the southern limit of the distribution of flounder (Nielsen, Reference Nielsen, Whitehead, Bauchot, Hureau, Nielsen and Tortonese1986), with a recent decline in abundance associated with increasing seawater temperatures (Cabral et al., Reference Cabral, Vasconcelos, Vinagre, França, Fonseca, Maia, Reis-Santos, Lopes, Ruano, Campos, Freitas, Santos and Costa2007). Moreover, food limitation has been linked to interspecific competition and higher metabolic demands in southern European nurseries, resulting in reduced growth rates of flounder compared with higher latitudes (Freitas et al., Reference Freitas, Kooijman and van der Veer2012).
Flounder spawning typically occurs from winter to early spring (Summers, Reference Summers1979; Muus & Nielsen, Reference Muus and Nielsen1999; Primo et al., Reference Primo, Azeiteiro, Marques, Martinho, Baptista and Pardal2013) although the exact location of the spawning grounds off the Portuguese Coast remains unknown (Amorim et al., Reference Amorim, Ramos, Elliott and Bordalo2016). Larvae usually enter the Lima estuary between February and July (Ramos et al., Reference Ramos, Ré and Bordalo2010; Amorim et al., Reference Amorim, Ramos, Elliott and Bordalo2016). Direct settlement occurs inside the estuary (Ramos et al., Reference Ramos, Ré and Bordalo2010; Amorim et al., Reference Amorim, Ramos, Elliott and Bordalo2018), and most likely in the upper section (Ramos et al., Reference Ramos, Ré and Bordalo2010), as indicated by the high larval (Ramos et al., Reference Ramos, Paris and Angélico2017) and newly settled flounder abundances found in this area (Ramos et al., Reference Ramos, Ré and Bordalo2010; Mendes et al., Reference Mendes, Ramos and Bordalo2014; Amorim et al., Reference Amorim, Ramos, Elliott and Bordalo2016). As in other estuaries (Elliott & Hemingway, Reference Elliott and Hemingway2002), the spatial distribution of flounder in the Lima estuary varies with age (Ramos et al., Reference Ramos, Ré and Bordalo2009; Mendes et al., Reference Mendes, Ramos and Bordalo2014, Amorim et al., Reference Amorim, Ramos, Elliott and Bordalo2018). Young-of-the-year flounder aggregate in the upper estuary, while older flounder juveniles are more abundant in the middle section (Ramos et al., Reference Ramos, Ré and Bordalo2009; Mendes et al., Reference Mendes, Ramos and Bordalo2014; Amorim et al., Reference Amorim, Ramos, Elliott and Bordalo2018). The juvenile flounder typically feed on common prey such as polychaetes (Summers, Reference Summers1980; Piet et al., Reference Piet, Pfisterer and Rijnsdorp1998; Martinho et al., Reference Martinho, Leitão, Neto, Cabral, Lagardère and Pardal2008) and amphipods (Aarnio et al., Reference Aarnio, Bonsdorff and Rosenback1996; Vinagre et al., Reference Vinagre, França, Costa and Cabral2005; Mendes et al., Reference Mendes, Ramos and Bordalo2014). These studies have led to the hypothesis that juvenile distribution and feeding in any nursery area will be structured to minimize competition through resource partitioning and ensure good growth and condition. In order to test this hypothesis, the present study aimed to: (1) determine the main feeding areas of 0-group (<1 year old) and 1-group (juveniles 1–2 year old) flounder, using dietary indices and stable isotope mixing models, and (2) assess flounder juveniles' condition through morphometric and RNA:DNA indices in the Lima estuary. This, in turn, is needed to indicate the feeding use of flounder in a nursery system near its southern geographic distribution limit, which is crucial information needed for better management decisions.
Materials and methods
Study area
The Lima estuary, NW Atlantic coast of Portugal, is a small open temperate estuary with a semidiurnal and mesotidal regime (3.7 m tidal range). Salt intrusion can extend up to 20 km upstream, with an average flushing rate of 0.4 m s−1, and a residence time of 9 days (Ramos et al., Reference Ramos, Cowen, Ré and Bordalo2006). This study sampled at five stations covering the lower, middle and upper estuary (Figure 1). The lower estuary (station 1, average depth of 7.0 m), located within the first 2.5 km, is a narrow, 9-m deep navigational channel, industrialized, with walled banks, including a shipyard, commercial seaport and fishing harbour; the middle estuary (stations 2–3, average depth 5.1 m) comprises a broad shallow intertidal saltmarsh zone, mainly colonized by the common rush (Juncus spp.); the upper estuary (Stations 4–5, average depth 2.1 m) is a narrow shallow channel, less disturbed, with natural banks and small exposed sandbanks (Ramos et al., Reference Ramos, Ré and Bordalo2010).
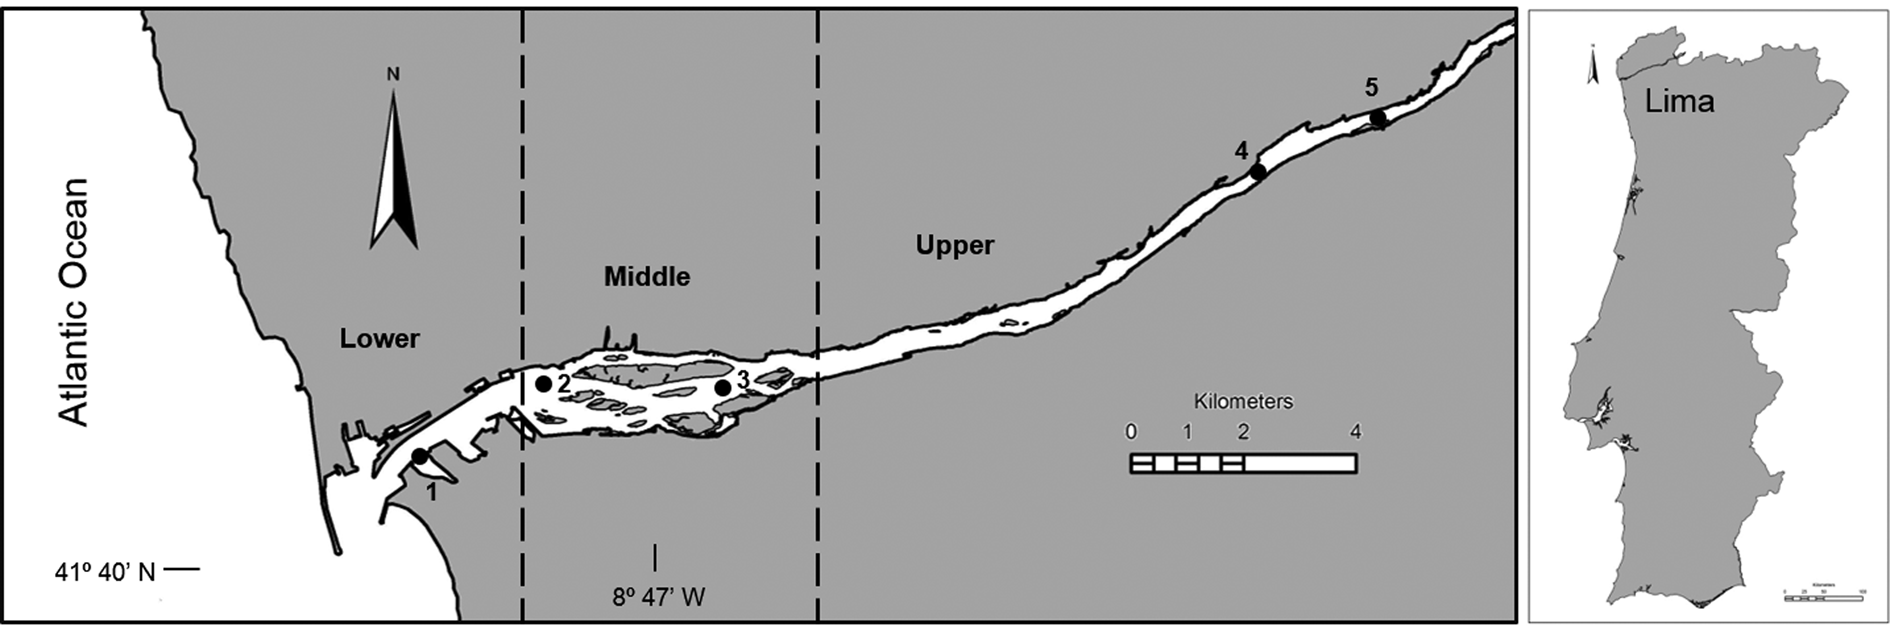
Fig. 1. The Lima estuary with the location of the sampling stations (1 – lower estuary; 2 and 3 – middle estuary; 4 and 5 – upper estuary).
Data collection
Juvenile European flounder Platichthys flesus, macroinvertebrates, sediment and water samples were collected in August 2013. This sampling date ensured that 0-group flounder should have reached isotopic equilibrium to the estuarine habitats, considering that this process could take weeks to months (Herzka, Reference Herzka2005), given the typical late spring estuarine colonization (Martinho et al., Reference Martinho, Leitão, Neto, Cabral, Lagardère and Pardal2008; Ramos et al., Reference Ramos, Ré and Bordalo2009). Vertical profiles of temperature and salinity were obtained at each site by means of a multi-parameter water quality probe YSI 6820. Bottom water samples for particulate organic matter (POM) analysis were collected at each sampling site with a Van Dorn bottle. Samples for sediment organic matter (SOM), and macroinvertebrate analysis were retrieved at each station with a Petite Ponar grab of area 0.023 m2. Juvenile flounder, as well as the shore crab Carcinus maenas were collected during two-nightly ebb tides with a 2 m beam trawl, with a cod-end of 5 mm mesh, and a tickler chain, and sorted immediately. All samples were kept on ice until further processing in the laboratory. The geographic location of each sampling station was recorded with a Magellan 315 GPS, and vertical profiles of water temperature and salinity were obtained using a multi-parameter probe YSI 6820.
Stomach content analysis
Juvenile flounder were measured for total length (TL; ±1 mm), and wet weight (W; ±0.01 g) and sorted according to total length at first sexual maturity (assumed to be 200 mm; Dinis, Reference Dinis1986). The stomachs were excised, and the contents removed and preserved in 70% alcohol. The prey items were identified to the highest taxonomic separation possible, using a binocular microscope (Leica MZ12-5), counted and weighed (wet weight; 0.001 g) after blotting on a tissue paper (Mendes et al., Reference Mendes, Ramos and Bordalo2014).
Stable isotope analysis
POM samples were obtained by pre-filtering 1 litre of water sample through a 200 μm nylon mesh to remove zooplankton and debris, and then through pre-combusted GF/F glass fibre filters (Harmelin-Vivien et al., Reference Harmelin-Vivien, Loizeau, Mellon, Beker, Arlhac, Bodiguel, Ferraton, Hermand, Philippon and Salen-Picard2008; Suzuki et al., Reference Suzuki, Kasai, Isoda, Nakayama and Tanaka2008). Filters were acidified with 10% HCl for carbonate removal (Vizzini et al., Reference Vizzini, Sarà, Michener and Mazzola2002; Kennedy et al., Reference Kennedy, Kennedy and Papadimitriou2005), which is δ13C enriched compared with organic carbon (DeNiro & Epstein, Reference DeNiro and Epstein1978), dried at 60°C for 48 h, and stored at −80°C. Sediment samples for SOM analysis were dried at 60°C, and ground to a fine powder. In addition, SOM samples for δ13C analysis were acidified with 10% HCl to remove carbonates, and dried at 60°C. Samples were stored in a desiccator until further analysis. Bivalvia, Carcinus maenas, Chironomidae, Corophium spp., Gastropoda, Isopoda and Polychaeta were considered as main prey groups (Vinagre et al., Reference Vinagre, França, Costa and Cabral2005; Martinho et al., Reference Martinho, Leitão, Neto, Cabral, Lagardère and Pardal2008; Mendes et al., Reference Mendes, Ramos and Bordalo2014) and sorted from the sediment samples. Samples from the upper estuary comprised Chironomidae, Corophium spp. and Polychaeta. The prey C. maenas and Polychaeta from the lower and middle sections were analysed, as well as Gastropoda from the lower estuary. Rare prey groups such as Bivalvia and Isopoda were not included due to insufficient material available for the stable isotope analysis. Whole individuals were used for prey stable isotope analysis, except for larger prey (C. maenas), for which muscle tissue was collected from the claws. Dorsal white muscle was removed from the flounder juveniles. Prey and fish samples were kept frozen (−80°C) until analysis. Prior to stable isotope analysis, animal tissue samples were dried and ground to a fine powder, using a mortar and pestle. Corophium spp. and gastropods were acidified (10% HCl) to remove carbonates (Ng et al., Reference Ng, Wai and Williams2007; Selleslagh et al., Reference Selleslagh, Blanchet, Bachelet and Lobry2015) from the samples for δ13C analysis. Carbon and nitrogen stable isotope analysis were performed on individual samples of fish and crabs. For other prey groups, several individuals were pooled in order to have sufficient material for analysis. Ratios of 13C/12C and 15N/14N in each sample were determined by continuous flow isotope mass spectrometry (CF-IRMS) (Preston & Owens, Reference Preston and Owens1983), using a Thermo Scientific Delta V Advantage IRMS via a Conflo IV interface. The delta (δ) notation was used to express the stable isotope ratios as ppt differences from a standard reference material:
 $$\partial X\;\lpar \perthousand \rpar = \lpar {R_{{\rm sample}}\;\times R_{{\rm standard}}^{{-}1} -1} \rpar \times \;10^3$$
where X is 13C or 15N and R is the ratio of 13C/12C or 15N/14N. Isotope ratios were measured relative to the international standards of PeeDee Belemnite for carbon and atmospheric N2 for nitrogen. Analytical precision (standard deviation) was ±0.2‰ of reference material for carbon and nitrogen.
Condition analysis
The individual somatic condition of the European flounder juveniles was assessed through the Fulton index and RNA:DNA ratio indices. The Fulton condition factor, K (Ricker, Reference Ricker1975) was determined following the formula:
 $$K = W \times \lpar {\rm T}{\rm L}^3\rpar ^{{-}1} \times 100\comma \;$$
where W is the wet weight (mg) and TL is the total length (mm). For the RNA:DNA, dorsal white muscle samples from European flounder juveniles were preserved in liquid nitrogen upon collection, and kept at −80°C until analysis. Prior to analysis, muscle samples were homogenized in 500 μl TEN-SDS buffer (0.05 M Tris, 0.01 M EDTA, 0.1 M NaCl, 0.01% SDS, pH 8). RNA:DNA was determined for three replicate samples of dorsal white muscle (10 mg) of each juvenile flounder, by the fluorometric method described in Caldarone et al. (Reference Caldarone, Wagner, Onge-Burns and Buckley2001), and modified by De Raedemaecker et al. (Reference De Raedemaecker, Brophy, O'Connor and O'Neill2012b). Fluorescence was measured on a FluoroSkan Ascent FL microplate reader with 535 nm excitation wavelength and 586 nm emission wavelength. RNA and DNA concentrations were determined based on standard curves prepared with baker's yeast RNA (Sigma) and pure calf-thymus DNA (Sigma). The RNA:DNA was determined as the ratio between average RNA and DNA concentrations of each sample. The ratio between the slopes of the RNA and DNA standard curve was 2.5, which can be used as a standardization factor for inter-calibration with other studies (Caldarone et al., Reference Caldarone, Clemmesen, Berdalet, Miller, Folkvord, Holt, Olivar and Suthers2006).
Data analysis
Temperature and salinity parameters of the bottom water column (1 m above bottom depth) were averaged for each location. European flounder juveniles were sorted according to length that would broadly equate with <150 mm for 0-group flounder and <200 mm for 1-group flounder in Portuguese populations (Dinis, Reference Dinis1986; Martinho et al., Reference Martinho, Leitão, Neto, Cabral, Marques and Pardal2007; Primo et al., Reference Primo, Azeiteiro, Marques, Martinho, Baptista and Pardal2013). These are literature classifications based on size-frequency distributions which may present an associated error due to inter-individual and inter-annual variability in growth rates. For each group, feeding activity was evaluated by the vacuity index (Iv), defined as the per cent of empty stomachs (Hyslop, Reference Hyslop1980). Key prey were identified based on the numerical (NI) and weight (WI) percentages of each prey item in the diet (Hyslop, Reference Hyslop1980). The average δ13C of POM and SOM sources was determined for each estuarine sector. The high δ15N variability between replicates for POM and SOM sources, possibly linked to the low nitrogen content of the samples, did not allow the use of this isotope to assess POM and SOM sources. The stable isotope signatures of POM and SOM, and samples from each prey category were sorted into estuarine classification, namely upstream (comprising the upper estuarine sector), and downstream (including pooled data from the lower and middle sections, see Supplementary material for details). The main feeding locations of juvenile flounder were also investigated. Therefore, the relative contribution of each prey to the diet of 0-group and 1-group flounder were determined with stable isotope mixing models, using the SIAR package in R software (Parnell et al., Reference Parnell, Inger, Bearhop and Jackson2010). The stable isotope mixing models estimate probability distributions of food source contributions based on Bayesian inference and accounting for different levels of uncertainty (sources, consumer and contributions of individual sources, Parnell et al., Reference Parnell, Inger, Bearhop and Jackson2010). One general set of trophic enrichment factors (TEF), 1% for δ13C and 3.4% for δ15N per trophic level, was used based on a meta-analysis from the scientific literature, and with an associated standard error of ±0.5 (Kostecki et al., Reference Kostecki, Roussel, Desroy, Roussel, Lanshere, Le Bris and Le Pape2012). Differences of δ13C and δ15N between flounder groups were tested with a permutational multivariate analysis of variance (PERMANOVA). Multivariate dispersion was tested with the PERMDISP routine. The PERMANOVA and PERMDISP analyses were based on the Euclidean distance dissimilarity matrix, and performed with PRIMER v6.1 (Primer-E Ltd, UK) and PERMANOVA + 1.0.1 add-on software (Clarke & Gorley, Reference Clarke and Gorley2006; Anderson et al., Reference Anderson, Gorley and Clarke2008). Possible length effects were investigated through Pearson correlations between total length and (a) isotopic values of carbon and nitrogen, and (b) condition indices of the 0-group and 1-group flounder. The relationship between condition indices Fulton K and RNA:DNA was also investigated through Pearson correlations. Differences in condition indices between respective flounder age groups were investigated with a t-test. A significance level of P < 0.05 was used for all the statistical analyses that were performed using R software (R Development Core Team, 2007).
Results
Physical-chemical parameters
The bottom temperature ranged between 13.7 and 22.8°C, with an average of 17.1 ± 3.4°C. The temperature increased from the lower (14.6 ± 0.7°C) to the middle (14.8 ± 0.8°C) and upper (21.4 ± 1.1°C) sections. Salinity, as expected, decreased from the lower (29.9. ± 0.1) and middle (29.5 ± 0.3) sections to the upper estuary (7.2 ± 5.4).
Stomach contents analysis
A total of 42 European flounder juveniles were collected in the Lima estuary, which were allocated to two age groups based on total length (0-group flounder, N = 22; 1-group flounder, N = 20; Figure 2; Table 1). Most of the 0-group flounder were caught in the upper estuary (N = 20), but two 0-group flounder were retrieved from the middle estuary. The 1-group flounder were collected from the middle estuary. The 0-group flounder presented a lower vacuity index (8%), compared with the 70% vacuity of the 1-group flounder.

Fig. 2. Size frequency distribution of the sampled 0-group (N = 22) and 1-group (N = 20) European flounder in the Lima estuary.
Table 1. Number (N) of 0-group and 1-group European flounder sampled in the Lima estuary, mean total length (mm), total weight (g), Fulton K, RNA:DNA and muscle carbon (δ13C) and nitrogen (δ15N) stable isotope signatures (‰)

The diet of the 0-group flounder was dominated by the amphipod Corophium spp. (NI = 94%, WI = 88%), followed by the polychaete Hediste diversicolor that reached 12% of the WI (Figure 3A). Other prey such as Crangon crangon, Chironomidae, Mysidae and Oligochaeta were also identified as minor items (< 1%). The diet of the 1-group flounder comprised mainly polychaetes (NI = 48%; WI = 69%). Isopoda (NI = 20%, WI = 3%), and C. crangon (NI = 16%, WI = 17%) were also important prey items (Figure 3B). Other prey of 1-group flounder included Bivalvia, Carcinus maenas and Corophium spp. Both 0- and 1-groups also had plant debris and sand in their stomach contents.
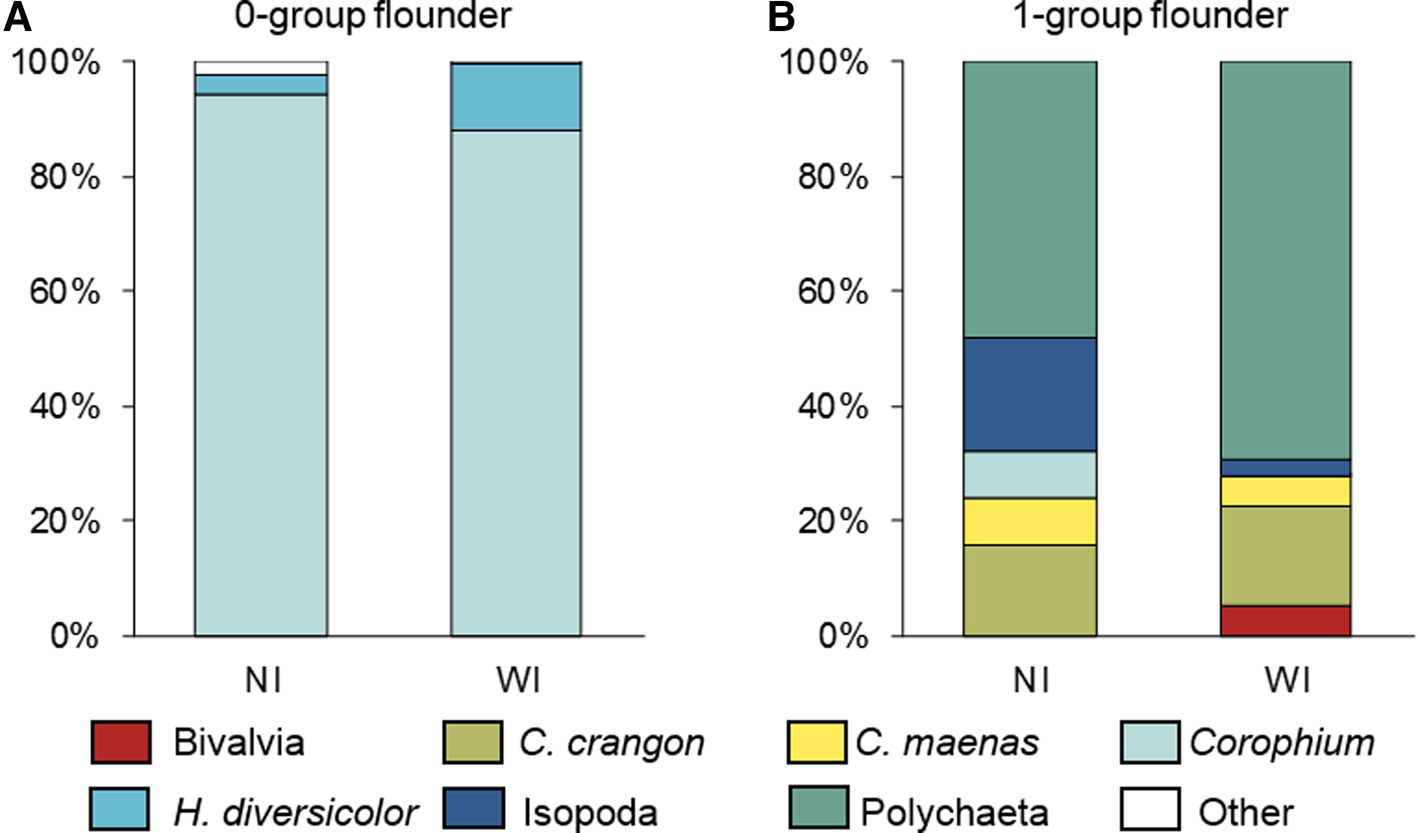
Fig. 3. Numerical (NI) and weight (WI) indices for stomach contents of (A) 0-group, and (B) 1-group European flounder in the Lima estuary.
Stable isotope analysis
Organic matter sources
The carbon signature of the upstream areas ranged from −32.66 to −25.55‰, and was significantly lower (see Supplementary material) than downstream areas with δ13C varying from −24.57 to −19.45‰ (Table 2, Figure 4A).

Fig. 4. Carbon (δ13C), and nitrogen (δ15N) stable isotopes (‰) of (A) sediment (SOM, upstream and downstream), and water particulate (POM, upstream and downstream) organic matter sources; (B) 0-group and 1-group European flounder, and respective upstream and downstream prey. Trophic enrichment factors were applied to sources (δ13C: ± 2‰, i.e. ±1‰ per trophic level), and to prey (δ13C: ± 1‰, δ15N: ± 3.4‰).
Table 2. Mean carbon stable isotope δ13C (‰) of particulate organic matter (POM) and sediment organic matter (SOM) sources in the upstream and downstream areas of the Lima estuary

Prey
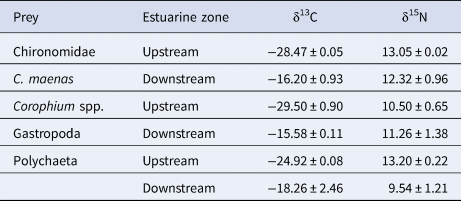
The upstream prey (Corophium spp., Polychaeta and Chironomidae) presented lower δ13C compared with other prey (Table 3). In upstream areas, Corophium spp. presented the lowest δ13C, while polychaetes presented enriched δ15N compared with other prey. In the downstream areas, C. maenas and gastropods presented the most enriched δ13C, while polychaetes presented the lowest δ15N values (Table 3, Figure 4B).
Table 3. Mean carbon (δ13C) and nitrogen (δ15N) stable isotope signatures of the main prey groups of European flounder juveniles in the upstream and downstream areas of Lima estuary
European flounder juveniles
European flounder juvenile carbon (0-group flounder: R = 0.16, P = 0.46; 1-group flounder: R = −0.16, P = 0.50) and nitrogen (0-group flounder: R = 0.04, P = 0.86; 1-group flounder: R = 0.14, P = 0.56) stable isotope ratios did not vary significantly with total length. Therefore, it was not necessary to correct the data for length effects. The stable isotopes varied significantly between flounder groups (PERMANOVA, Pseudo-F = 13.62, P = 0.02). The 1-group flounder had higher δ13C and lower δ15N values than the 0-group flounder (Table 1).
SIAR outputs
The diet of 0-group flounder depended primarily on Corophium spp. and other prey from the upper estuary (Figure 4B), with a total of 74% contribution according to SIAR (Figure 5A). However, some 0-group flounder had higher δ13C values (Figure 4B), between −24 and −18‰, than expected if the diet depended only on the upper estuary resources. Indeed, polychaetes from the downstream areas constituted 26% of the diet. The dual isotope plots displayed one cluster of 1-group flounder (Figure 4B), with isotopic signatures similar to Corophium spp., and sources from upstream, while the remaining individuals presented more scattered values consistent with the sources and prey from downstream areas. Indeed, the SIAR model applied to 1-group flounder data showed that their diet relied equally on prey both from upstream (48%), and downstream areas (52%) (Figure 5B). Specifically, downstream polychaetes (46%), and upstream Corophium spp. (42%), represented the main prey of 1-group flounder.
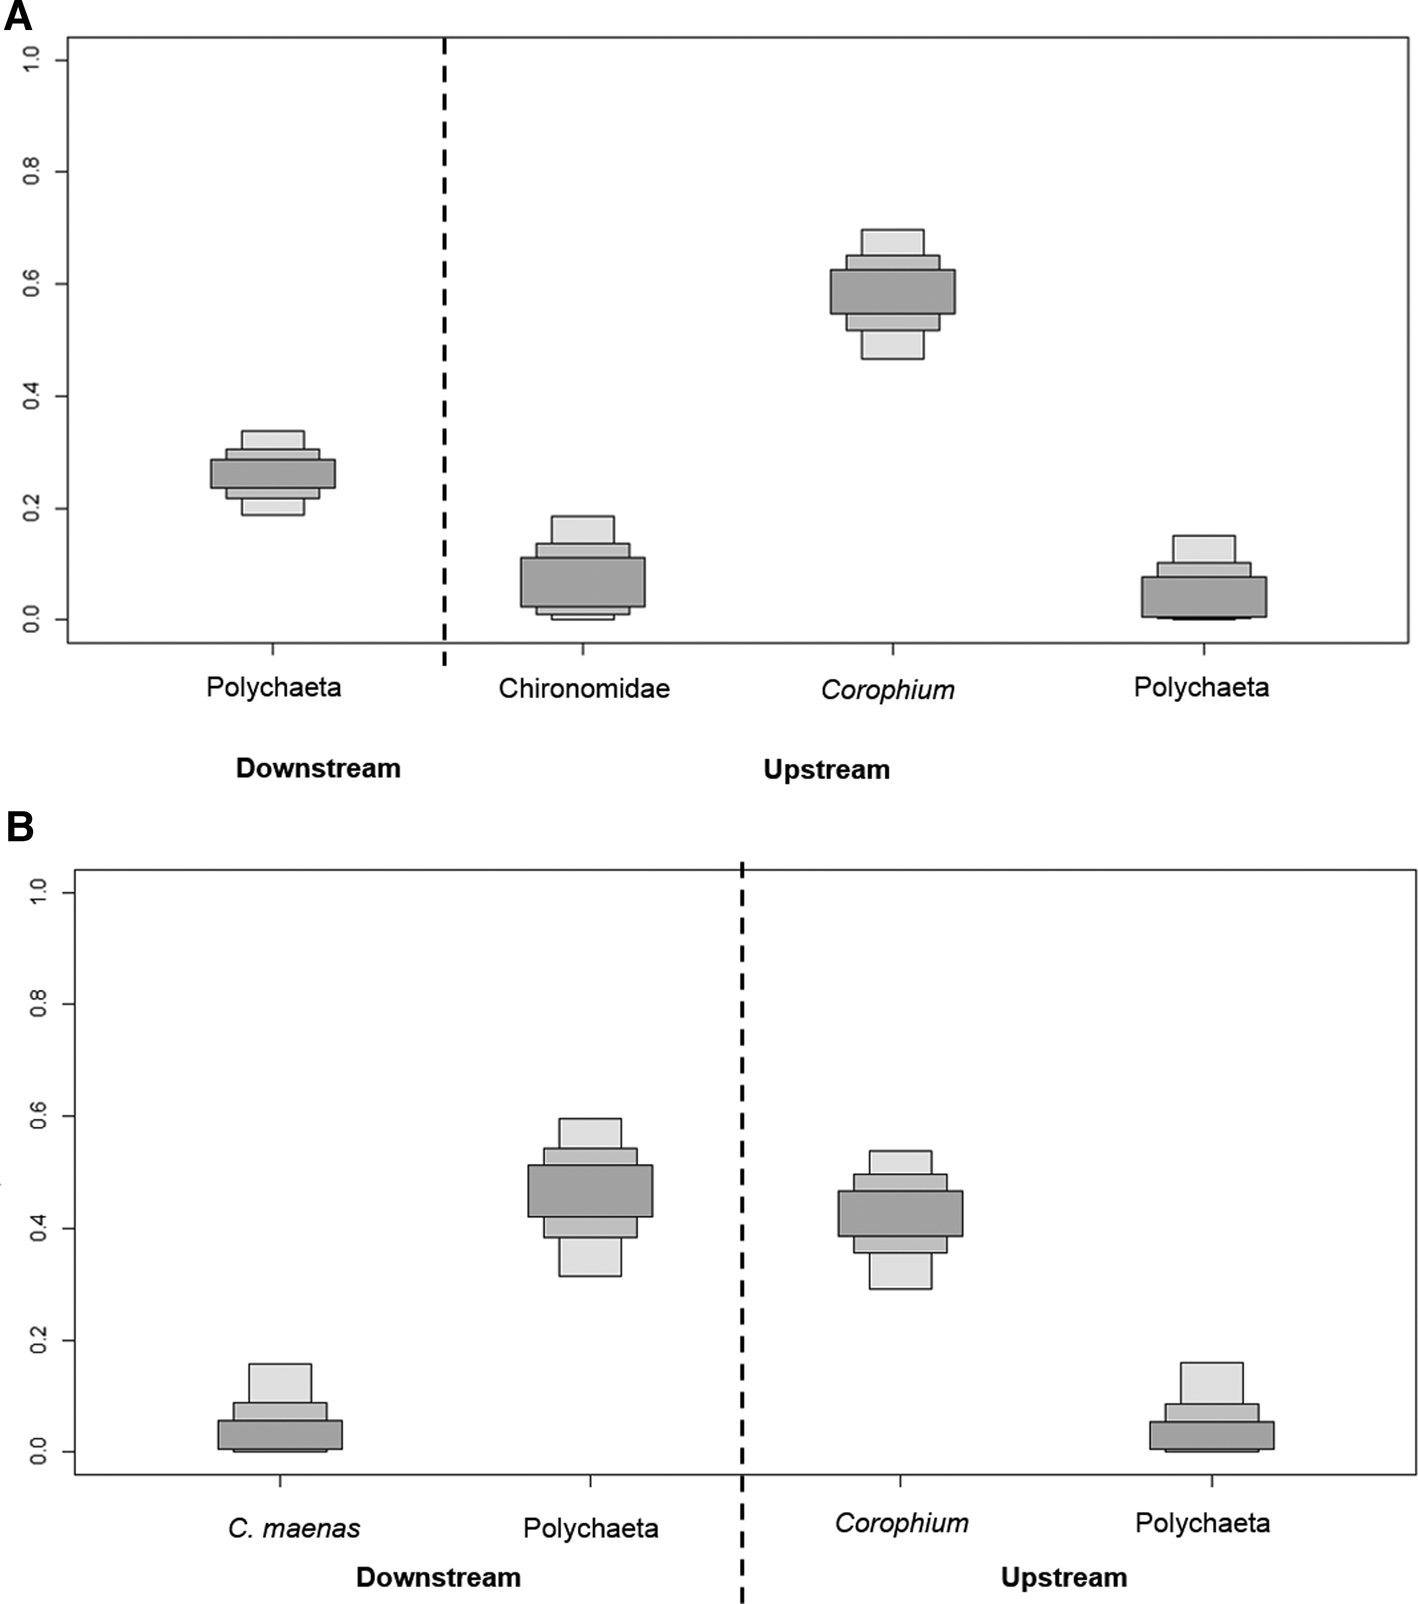
Fig. 5. Boxplots of the mixing models estimates of prey contribution to the diet of (A) 0-group and (B) 1-group European flounder. Prey groups divided according to upstream and downstream areas.
Condition analysis
There was no correlation between flounder juvenile total length and Fulton K (0-group flounder: R = 0.03, P = 0.87; 1-group flounder: R = −0.25, P = 0.28), or RNA:DNA (0-group flounder: R = 0.25, P = 0.24; 1-group flounder: R = 0.21, P = 0.40). Therefore, no corrections for length effect were applied to the indices. Also, there were no significant differences in condition between 0-group flounder and 1-group flounder (Table 1), in terms of Fulton K (t-test, t = −0.89, df = 40, P = 0.38), or in terms of RNA:DNA (t-test, t = 1.58, df = 40, P = 0.12). The two condition indices Fulton K and RNA:DNA were also not correlated (0-group flounder: R = 0.06, P = 0.78, 1-group flounder: R = −0.44, P = 0.06).
Discussion
Integrating stomach contents and stable isotope analysis
Stomach content analysis provided a first indication of the recent diet of juvenile flounder, enabling identification of the main prey (polychaetes, Corophium spp. and Carcinus maenas) that could be included in the stable isotope analysis. A discrimination between sources and prey signatures was necessary to reconstruct the consumer diet based on stable isotope analysis (Vander Zanden et al., Reference Vander Zanden, Cabana and Rasmussen1997; Post, Reference Post2002). The δ13C depletion usually increases along the horizontal salinity gradient from marine to estuarine and terrestrial sources (Fry, Reference Fry2002). In the Lima estuary, the δ13C similarity between lower and middle estuaries reflected the euhaline regime of both areas. The depleted δ13C signatures in the upper estuary were related to the increasing terrestrial input in the upstream areas (Darnaude et al., Reference Darnaude, Salen-Picard and Harmelin-Vivien2004; França et al., Reference França, Vasconcelos, Tanner, Máguas, Costa and Cabral2011). The POM and SOM presented similar δ13C values, providing good indicators of local δ13C signatures.
In general, prey from upstream stretches consistently presented higher δ15N values than the downstream prey, which may result from differences in the organic matter sources between estuarine sections. However, the high variability between replicates did not allow the determination of δ15N of the organic matter sources to corroborate this hypothesis. The δ15N variability between prey groups within each estuarine area may reflect differences in trophic position (Minagawa & Wada, Reference Minagawa and Wada1984; Peterson & Fry, Reference Peterson and Fry1987; Post, Reference Post2002). For example, the epibenthic predator C. maenas (Raffaelli et al., Reference Raffaelli, Conacher, McLachlan and Emes1989) showed the highest δ15N from the downstream prey, while the omnivorous polychaetes from upstream areas had higher δ15N than Chironomidae and Corophium, which are opportunistic omnivores (Armitage et al., Reference Armitage, Pinder and Cranston1995), and suspension and deposit feeders (Gerdol & Hughes, Reference Gerdol and Hughes1995), respectively. Prey from the upstream areas showed markedly depleted δ13C compared with the more brackish downstream areas, thus reflecting the use of local OM sources. This discrimination between upstream and downstream prey enabled the use of stable isotope mixed models to identify the main feeding locations, and trace movements of European flounder juveniles in the Lima estuary.
The stomach content results complemented those provided by the stable isotope analysis. Discrepancies between these two methods may be related to the fact that stomach contents reflect recent feeding (Hyslop, Reference Hyslop1980), while stable isotope analysis indicates and integrates long-term patterns (Vander Zanden et al., Reference Vander Zanden, Cabana and Rasmussen1997). Hence, easily digested prey, such as polychaetes, were probably underestimated in 0-group flounder dietary indices even though these were important prey, together with Corophium, according to SIAR results. Also, the near absence of the upper estuary prey Corophium spp. in 1-group flounder dietary indices contrary to SIAR, reflected the recent feeding on polychaetes in the middle estuary, where juveniles were caught.
The diet of 0-group flounder was mostly composed by the amphipod Corophium as observed in other nursery areas, including the Douro (Vinagre et al., Reference Vinagre, França, Costa and Cabral2005), Mondego (Martinho et al., Reference Martinho, Leitão, Neto, Cabral, Lagardère and Pardal2008), Schelde (Hampel et al., Reference Hampel, Cattrijsse and Elliott2005) and Ythan estuaries (Summers Reference Summers1980). Corophium was highly abundant and mostly restricted to the Lima upper estuary where the 0-group flounder were also concentrated (Ramos et al., Reference Ramos, Ré and Bordalo2009; Mendes et al., Reference Mendes, Ramos and Bordalo2014). Corophium is highly active and may become energetically more advantageous to the European flounder (Andersen et al., Reference Andersen, Carl, Grønkjær and Støttrup2005b; Grønkjær et al., Reference Grønkjær, Carl, Rasmussen and Hansen2007) as a visual predator (De Groot, Reference De Groot1971), especially in the scarce vegetation conditions of the upper estuary (Mendes et al., Reference Mendes, Ramos and Bordalo2014). The polychaetes were the main prey of the 1-group flounder as observed in other estuaries (e.g. Summers et al., 1980; Doornbos & Twisk, Reference Doornbos and Twisk1984; Pasquaud et al., Reference Pasquaud, Elie, Jeantet, Billy, Martinez and Girardin2008). The 1-group flounder consumed less Corophium, reflecting their ability to handle larger prey such as polychaetes (Vinagre et al., Reference Vinagre, Cabral and Costa2008), and the increased use of downstream areas (Ramos et al., Reference Ramos, Ré and Bordalo2009; Mendes et al., Reference Mendes, Ramos and Bordalo2014) where amphipods were less abundant (Sousa et al., Reference Sousa, Dias and Antunes2006; Mendes et al., Reference Mendes, Ramos and Bordalo2014). Molluscs were more abundant in the lower estuary (Sousa et al., Reference Sousa, Dias and Antunes2006) and were only occasionally consumed by juvenile flounder that were distributed over other estuarine areas. Moreover, sedentary prey such as molluscs may become major prey in high turbidity systems such as the Severn estuary (Moore & Moore, Reference Moore and Moore1976), where reduced visibility does not favour the predation on mobile prey. This is not the case in the Lima estuary, where low turbidity can be found in the summer months (Ramos et al., Reference Ramos, Cowen, Ré and Bordalo2006), associated with the presence of higher salinity coastal waters. Shrimps, crabs and isopods were only occasionally consumed as observed in other estuaries (Hampel et al., Reference Hampel, Cattrijsse and Elliott2005; Vinagre et al., Reference Vinagre, França, Costa and Cabral2005).
European flounder juvenile movements and main feeding areas within the Lima estuary
The upper estuary was the main feeding area of 0-group flounder in line with the typical preference of early stage flounder for upstream areas (e.g. Kerstan, Reference Kerstan1991; van der Veer et al., Reference van der Veer, Bergman, Dapper and Witte1991; Freitas et al., Reference Freitas, Costa-Dias, Campos, Bio, Santos and Antunes2009). Moreover, the lower δ13C confirms the dependence on freshwater-derived sources observed from late larval (Dias et al., Reference Dias, Morais, Faria, Antunes and Hoffman2017) to juvenile stages (Pasquaud et al., Reference Pasquaud, Elie, Jeantet, Billy, Martinez and Girardin2008; Selleslagh et al., Reference Selleslagh, Blanchet, Bachelet and Lobry2015) of European flounder. Prey availability (Bos, Reference Bos1999; Florin & Lavados, Reference Florin and Lavados2010; Vasconcelos et al., Reference Vasconcelos, Reis-Santos, Maia, Fonseca, França, Wouters, Costa and Cabral2010), and reduced competition for space and food (Beaumont & Mann, Reference Beaumont and Mann1984; Złoch & Sapota, Reference Złoch and Sapota2010; Souza et al., Reference Souza, Dias, Nogueira, Campos, Marques and Martins2013) may explain this preference for upstream areas, especially as prey availability and salinity have been previously correlated with the concentration of 0-group flounder in the Lima upper estuary (Ramos et al., Reference Ramos, Ré and Bordalo2009; Mendes et al., Reference Mendes, Ramos and Bordalo2014). Despite this, 0-group flounder feeding was not restricted to the upper estuary, since polychaetes from downstream areas were also identified as prey items.
Limited mobility, and consequent patchy segregation along upstream-downstream estuarine gradients, have been reported for 0-group flatfish (Raffaelli et al., Reference Raffaelli, Richner, Summers and Northcott1990; Le Pape & Cognez, Reference Le Pape and Cognez2016). However, these movements between feeding habitats (Summers, Reference Summers1980; Wirjoatmodjo & Pitcher, Reference Wirjoatmodjo and Pitcher1984; Dando, Reference Dando2011; Souza et al., Reference Souza, Dias, Nogueira, Campos, Marques and Martins2013) may be the result of the 0-group flounder's increased mobility given that the individuals sampled were approaching 1-group age class (≥150 mm). The risk from predation inherent in feeding in downstream areas was reduced as individuals attained size-based refuge from predation by the crustaceans C. maenas (>50 mm TL), and C. crangon (>30 mm TL) (van der Veer & Bergman, Reference van der Veer and Bergman1987; Burrows et al., Reference Burrows, Gontarek, Nash and Gibson2001). Laboratory experiments have showed that low salinity typically found in the upstream section may limit somatic condition and growth (Gutt, Reference Gutt1985; O'Neill et al., Reference O'Neill, De Raedemaecker, McGrath and Brophy2011) of the juvenile flounder. The predator–prey trade-offs mentioned above may explain why the juveniles remained upstream despite these limitations. In parallel, the downstream areas may have promoted higher condition as the juveniles approached 1-group age size, and became less vulnerable to predation, while consuming larger and more diverse prey (Mendes et al., Reference Mendes, Ramos and Bordalo2014).
The 1-group fed throughout the estuary, in contrast to the 0-group flounder that fed mostly on upstream prey. These differences between feeding patterns of 0-group and 1-group flounder were clear and consistent both in stomach content and stable isotope data, despite the low number of sampled individuals (N = 42). The 1-group flounder relied equally on prey from downstream where they were more abundant (Ramos et al., Reference Ramos, Ré and Bordalo2009), and upstream areas. It is of note that a limited home range and high site fidelity have been reported for juvenile flounder (Raffaelli et al., Reference Raffaelli, Richner, Summers and Northcott1990; Dando, Reference Dando2011). However, diel and tidal migrations (Edwards & Steele, Reference Edwards and Steele1968; Edwards et al., Reference Edwards, Steele and Trevallion1970; Gibson, Reference Gibson1973), to areas with high prey availability (Modin & Pihl, Reference Modin and Pihl1996), reflected movements between estuarine habitats. Moreover, a gradual use of the downstream areas throughout development (Kerstan, Reference Kerstan1991; Primo et al., Reference Primo, Azeiteiro, Marques, Martinho, Baptista and Pardal2013; Souza et al., Reference Souza, Dias, Nogueira, Campos, Marques and Martins2013), is typical of the flounder life cycle (Elliott & Hemingway, Reference Elliott and Hemingway2002). Thus, the wide range of 1-group flounder δ13C may indicate recent migration from upstream to downstream areas, where most 1-group flounder were caught, given that muscle tissue takes many weeks to reach isotopic equilibrium (Vander Zanden et al., Reference Vander Zanden, Cabana and Rasmussen1997; Herzka, Reference Herzka2005). Overall, connectivity between upstream and downstream estuarine habitats has also been observed for 1-group flounder in other estuarine habitats (Vinagre et al., Reference Vinagre, Salgado, Cabral and Costa2011; Selleslagh et al., Reference Selleslagh, Blanchet, Bachelet and Lobry2015). Such a connectivity may also allow the use of alternative resources if one of the habitats is compromised (i.e. resource partitioning), hence increasing the ability of flounder to tolerate environmental change (Selleslagh et al., Reference Selleslagh, Blanchet, Bachelet and Lobry2015). Overall, these feeding strategies corroborated the life cycle described for the European flounder in the Lima estuary (Ramos et al., Reference Ramos, Ré and Bordalo2010; Mendes et al., Reference Mendes, Ramos and Bordalo2014; Amorim et al., Reference Amorim, Ramos, Elliott and Bordalo2018). The larvae settled in early summer in the upper estuary (Ramos et al., Reference Ramos, Ré and Bordalo2010; Amorim et al., Reference Amorim, Ramos, Elliott and Bordalo2016) that was also the main feeding habitat of the 0-group flounder. The juveniles increasingly used the middle estuary as they grew (Ramos et al., Reference Ramos, Ré and Bordalo2009; Mendes et al., Reference Mendes, Ramos and Bordalo2014; Amorim et al., Reference Amorim, Ramos, Elliott and Bordalo2018), with the 1-group flounder feeding between upstream and downstream areas. Adults representing 23% of the total population were mostly found in the lower and middle estuaries (Ramos et al., Reference Ramos, Ré and Bordalo2010). These differences in habitat use and feeding strategies between life-stages may prevent intraspecific competition.
Feeding strategies promoting European flounder condition in the Lima estuary and management implications
The issue of food limitation in nursery habitats is still debated (Le Pape & Bonhommeau, Reference Le Pape and Bonhommeau2015), as several authors suggest that feeding on abundant prey (van der Veer et al., Reference van der Veer, Berghahn, Miller and Rijnsdorp2000; Amara et al., Reference Amara, Selleslagh, Billon and Minier2009; Selleslagh & Amara, Reference Selleslagh and Amara2013), and resource partitioning strategies (Evans, Reference Evans1983; Besyst et al., Reference Besyst, Cattrijsse and Mees1999; Hampel et al., Reference Hampel, Cattrijsse and Elliott2005; Haynes et al., Reference Haynes, Brophy, De Raedemaecker and McGrath2011) may reduce the effects of niche overlap and prevent competition. Accordingly, the distinct isotopic signatures of 0-group and 1-group flounder and their feeding on highly abundant prey (e.g. Corophium and polychaetes) in the Lima estuary (Sousa et al., Reference Sousa, Dias and Antunes2006), did not support evidence for competition. Moreover, the morphometric condition (mean = 1.06 ± 0.07) of European flounder juveniles in the Lima estuary was within the same range observed for this species in estuaries such as Canche (mean = 0.89), Authie (mean = 1.0) (Amara et al., Reference Amara, Selleslagh, Billon and Minier2009), Minho, Mondego and Douro (mean = 0.70, Vasconcelos et al., Reference Vasconcelos, Reis-Santos, Fonseca, Ruano, Tanner, Costa and Cabral2009) suggesting good somatic condition. Thus, the differential distribution and feeding strategies of the 0-group and 1-group flounder may have minimized competition and sustained somatic condition over the summer months preceding collection of juveniles. Overall, these results did not suggest food limitation, i.e. the carrying capacity of the Lima estuary may not have been fully exploited, at least at the time scale integrated by the Fulton K and stable isotope analysis. However, it has been suggested that limitation of food resources may be underestimated by individual condition indices (Le Pape & Bonhommeau, Reference Le Pape and Bonhommeau2015), as size-selective mortality favours survival of fast-growing individuals (Sogard, Reference Sogard1997). The growth of the surviving individuals would be close to maximal values even when there was food limitation (Le Pape & Bonhommeau, Reference Le Pape and Bonhommeau2015). Thus, further studies are required to estimate the relative amounts of prey available to predators and carrying capacity.
The RNA:DNA of the European flounder in the Lima estuary (mean = 1.57 ± 0.62) was well above the critical starvation value (0.32), and close to optimal feeding values (1.71) defined for newly settled plaice Pleuronectes platessa L. 1758 (Selleslagh & Amara, Reference Selleslagh and Amara2013). However, it was lower than RNA:DNA of well-fed metamorphosing flounder (>2, O'Neill et al., Reference O'Neill, De Raedemaecker, McGrath and Brophy2011), common sole Solea solea L., 1758 (>1.5, Richard et al., Reference Richard, Bergeron, Boulhic, Galois and Person-Le Ruyet1991) and Japanese flounder Paralichthys olivaceus Temminck and Schlegel, 1846 (>2, Gwak & Tanaka, Reference Gwak and Tanaka2001). These comparisons must be taken with caution as RNA:DNA is species and size dependent (Ferron & Leggett, Reference Ferron and Leggett1994; Buckley et al., Reference Buckley, Caldarone and Clemmesen2008; Tanaka et al., Reference Tanaka, Satoh, Yamada, Takebe, Nikaido and Shiozawa2008). Decreased growth rates of juvenile flounder have been linked to food limitation, which may be caused by changes in prey quality and availability (Teal et al., Reference Teal, de Leeuw, van der Veer and Rijnsdorp2008), and intraspecific (Edwards et al., Reference Edwards, Steele and Trevallion1970; Laffargue et al., Reference Laffargue, Lagardère, Rijnsdorp, Fillon and Amara2007) and interspecific competition (Jager et al., Reference Jager, Kleef and Tydeman1995; van der Veer et al., Reference van der Veer, Freitas, Koot, Witte and Zuur2010; Freitas et al., Reference Freitas, Kooijman and van der Veer2012; Ciotti et al., Reference Ciotti, Targett, Nash and Burrows2013b). It is of note that European flounder juveniles were sampled in the late summer when sub-optimal growth has been suggested for juveniles of this species (Jager et al., Reference Jager, Kleef and Tydeman1995; Freitas et al., Reference Freitas, Kooijman and van der Veer2012), and similar to other flatfish such as plaice (Freitas et al., Reference Freitas, Kooijman and van der Veer2012; Ciotti et al., Reference Ciotti, Targett and Burrows2013a; van der Veer et al., Reference van der Veer, Jung, Freitas, Philippart and Witte2016) and common sole (Fonseca et al., Reference Fonseca, Vinagre and Cabral2006; Laffargue et al., Reference Laffargue, Lagardère, Rijnsdorp, Fillon and Amara2007; Teal et al., Reference Teal, de Leeuw, van der Veer and Rijnsdorp2008). However, Poiesz et al. (Reference Poiesz, de Vries, Cardoso, Witte, van der Veer and Freitas2019) found no trend in flounder growth over time in the Wadden Sea, and suggested that this species, as an epibenthic predator, was not affected by reduced infauna activity in late summer, and thus reduced prey availability, in contrast to plaice which is a benthic feeder (van der Veer et al., Reference van der Veer, Jung, Freitas, Philippart and Witte2016). The RNA:DNA ratio of European flounder in the Lima estuary was lower than in the nearby Minho and Douro (Vasconcelos et al., Reference Vasconcelos, Reis-Santos, Fonseca, Ruano, Tanner, Costa and Cabral2009), while in the same range as Canche, Authie (Amara et al., Reference Amara, Selleslagh, Billon and Minier2009) and Mondego (Vasconcelos et al., Reference Vasconcelos, Reis-Santos, Fonseca, Ruano, Tanner, Costa and Cabral2009). Although this may suggest suboptimal food conditions, differences in methodology may limit comparisons of the RNA:DNA ratio between studies (Caldarone et al., Reference Caldarone, Clemmesen, Berdalet, Miller, Folkvord, Holt, Olivar and Suthers2006), and temperature effects must also be considered. Indeed, temperature is a controller of enzymatic activity and metabolic reactions (Fry, Reference Fry, Hoar and Randall1971), and influences RNA synthesis and activity (Buckley et al., Reference Buckley, Caldarone and Clemmesen2008). Therefore, temperature affects RNA:DNA ratios and the relationship between RNA:DNA and growth (Ferron & Leggett, Reference Ferron and Leggett1994; Buckley et al., Reference Buckley, Caldarone and Ong1999). Lower temperatures were observed in Lima downstream areas (T = 14.7 ± 0.7) compared with upstream areas (T = 21.4 ± 1.1°C). Therefore, temperature differences between the Lima estuary (T = 17.1 ± 3.4°C) and other estuaries within the same geographic area (>20°C, Vasconcelos et al., Reference Vasconcelos, Reis-Santos, Fonseca, Ruano, Tanner, Costa and Cabral2009) may have contributed to the lower RNA:DNA observed in this study, even though temperature in the upper estuary was within the optimal range (18–22°C) for flounder growth (Fonds et al., Reference Fonds, Cronie, Vethaak and Van Der Puyl1992). The different lag response to environmental conditions of the Fulton K and the RNA:DNA ratio may explain the lack of a correlation between these indices (Suthers et al., Reference Suthers, Fraser and Frank1992; Ferron & Leggett, Reference Ferron and Leggett1994; De Raedemaecker et al., Reference De Raedemaecker, Brophy, O'Connor and O'Neill2012b). Hence, the Lima estuary appeared to promote good condition of the juveniles during summer, while short-term changes in environmental conditions or prey availability and competition may justify the low RNA:DNA as this index is sensitive to fish recent feeding (Clemmesen, Reference Clemmesen1994; Malloy & Targett, Reference Malloy and Targett1994), and condition (Buckley, Reference Buckley1984; Gwak & Tanaka, Reference Gwak and Tanaka2001). These condition patterns observed over a brief summer period may not be reflected at the seasonal and interannual scales.
Historical habitat loss is a major environmental problem in estuaries (Wolanski & Elliott, Reference Wolanski and Elliott2015; Amorim et al., Reference Amorim, Ramos, Elliott, Franco and Bordalo2017), and there are increasing measures to remedy that loss (Elliott et al., Reference Elliott, Mander, Mazik, Simenstad, Valesini, Whitfield and Wolanski2016). Coordinated management initiatives (e.g. Lonsdale et al., Reference Lonsdale, Weston, Barnard, Boyes and Elliott2015) aim to balance the effects of the various estuarine users, and their demands on the systems. The Lima estuary is located at the southern limit of the distribution of flounder where increased temperatures, especially in the shallow upstream areas, may limit the food and habitat available with effects on juvenile flounder condition and growth (Freitas et al., Reference Freitas, Kooijman and van der Veer2012). Hence, the present study is important in determining which species and stages use habitats within and adjacent to the estuary, thereby guiding the habitat management within the estuary. Further studies are required to assess how the juvenile flounder condition will respond to changes in food availability and temperature related to climate change.
Supplementary material
The supplementary material for this article can be found at https://doi.org/10.1017/S0025315420000600.
Acknowledgements
The authors wish to thank two anonymous referees and the Editor for their valuable comments made on an earlier version of the paper.
Financial support
This research was partially supported by FCT – The Portuguese Foundation for Science and Technology through the PhD fellowship awarded to C. Mendes (SFRH/BD/86325/2012). This study was also partially funded through the project “Mytag – Integrating natural and artificial tags to reconstruct fish migrations and ontogenetic niche shifts” (PTDC/MAR-EST/2098/2014), under the Project 9471 – Reforçar a Investigação, o Desenvolvimento Tecnológico e a Inovação (Projeto 9471-RIDTI) and subsidized by the European Regional Development Fund (FEDER, POCI-01-0145-FEDER- 016787), and by the Strategic Funding UID/Multi/04423/2013 and UID/Multi/04423/2019 through national funds provided by FCT – Foundation for Science and Technology and European Regional Development Fund (ERDF), in the framework of PT2020.


