


INTRODUCTION
Swordfish longline fishery is probably the most spatially extensive economic activity in the eastern Mediterranean Sea. It is carried out in a fairly intensive way over the greater part of the maritime areas since the late 1960s (Ward et al., Reference Ward, Porter and Elscot2000; Megalofonou et al., Reference Megalofonou, Yannopoulos, Damalas, De Metrio, Deflorio, de la Serna and Macias2005b). The most important fleet in the region accountable for the bulk of landings is the Greek fleet (ICCAT, 2004). Blue sharks and oilfish are two of the non-target species caught incidentally in the Mediterranean longline fisheries targeting swordfish (Compagno, 1984; Megalofonou et al., Reference Megalofonou, Santamaria, Giacchetta and De Metrio1993, Reference Megalofonou, Damalas and Yannopoulos2005a,Reference Megalofonou, Yannopoulos, Damalas, De Metrio, Deflorio, de la Serna and Maciasb; Buencuerpo et al., Reference Buencuerpo, Rios and Moron1998; Tserpes et al., Reference Tserpes, Tatamanidis and Peristeraki2005; Gilman et al., Reference Gilman, Clarke, Brothers, Alfaro-Shigueto, Mandelman, Mangel, Petersen, Piovano, Thomson, Dalzell, Donoso, Goren and Werner2007; Megalofonou et al., 2009a). The contribution of these two species in landings is significant comprising as much as 20% of total catches in certain years and areas. There are no direct fisheries targeting blue sharks or oilfish in the Mediterranean and surface drifting longlining can be considered as the principal (if not exclusive) source of fishing mortality on them (Megalofonou et al., Reference Megalofonou, Yannopoulos, Damalas, De Metrio, Deflorio, de la Serna and Macias2005b). The blue shark (Prionace glauca, Carcharhiniformes, Carcharhinidae, Linnaeus, 1758) belongs to the pelagic ecosystem and could probably be considered as one of the most successful species in this system. Recent estimates of stock assessment reference points suggest that current trade volumes in numbers of blue sharks are close to or possibly exceeding the maximum sustainable yield levels (Clarke et al., Reference Clarke, McAllister, Milner-Gulland, Kirkwood, Michielsens, Agnew, Pikitch, Nakano and Shivji2006). Oilfish (Ruvettus pretiosus, Cocco, 1829) is a member of the family Gempylidae (snake mackerels) which is widely distributed in tropical and temperate waters of the world, being an oceanic, benthopelagic species found on continental slope and sea rises from about 100 to 700 m (Nakamura & Parin, Reference Nakamura and Parin1993). Very little is known on its biology.
Concentrations of large pelagic fish (such as tunas) are assumed to change position either as a response to a suite of local abiotic and biotic conditions (passive migration) or due to active directed movements between habitats following an ontogenetic change in biological requirements (feeding and reproduction) (Nakamura, Reference Nakamura1969). Studying the factors influencing changes in the spatiotemporal distribution of fish is critical to successful fisheries management, since failure to recognize spatial complexity resulted in stock collapses (Hilborn & Walters, Reference Hilborn and Walters1992). Blue sharks and oilfish have consistently been of low research priority for most fisheries institutes in the eastern Mediterranean. They have hardly ever been under the scientific centre of attention, mainly as a result of being species of low commercial value.
To explore the underlying mechanisms by which the spatial, temporal and environmental variability affected the blue shark and oilfish catches in the eastern Mediterranean, non-parametric generalized additive models (GAMs) were developed. The models contained environmental, operational, temporal and spatial components linked with the fishery dependent indices of abundance. Analogous recent approaches worldwide have confirmed that catch rates are significantly affected by spatial, temporal and environmental parameters (blue shark: Bigelow et al., Reference Bigelow, Boggs and He1999; Cortés, Reference Cortés2002; Nakano & Clarke, Reference Nakano and Clarke2005; Aires-da-Silva et al., Reference Aires-da-Silva, Hoey and Gallucci2008; Megalofonou et al., 2009a; oilfish: Tserpes et al., Reference Tserpes, Tatamanidis and Peristeraki2005).
MATERIALS AND METHODS
Data set
The data and material utilized in this study were obtained from 36 Greek and 2 Cypriot commercial swordfish longlining fishing boats operating from 22 fishing ports during the period 1998–2005 (2002 excluded) in the eastern Mediterranean Sea (Figure 1; Table 1). Since it was a fishery dependent survey and not an experimental one, fixed sampling stations were not applicable, although occasionally the boats fished in the same location. For each fishing set the operational data included: date, location (determined from GPS), number of hooks, and gear configuration. The longline gear deployed was a surface drifting longline. Main line consisted of 30–70 km of 2–3 mm nylon suspended horizontally from the surface by plastic buoys spaced every 150–450 m. Approximately 300–1200 gangions, each consisting of 5–18 m of 1–2 mm nylon line and a baited J-hook were clipped to the main line at intervals of 30–150 m. Hooks were baited with whole frozen mackerels or squids. Differentiation in gear configuration lead to two distinct gear types: traditional swordfish longline (SWO-LLT) and ‘American’ type swordfish longline (SWO-LLA). The latter was much longer, had thicker lines, less but larger hooks and bore chemical fish attractant light-sticks (Megalofonou et al., Reference Megalofonou, Yannopoulos, Damalas, De Metrio, Deflorio, de la Serna and Macias2005b). Gears were set in the evening and retrieved early next morning. For each fishing-set, numbers and weights of fish caught were recorded. Wind direction, wind speed, bathymetry, distance from coast, lunar index, sea surface temperature (SST), SST frontal energy (SST gradient), temporal change in SST (DSST), temporal change in frontal energy (DSST gradient), and distance from thermal fronts (Distance.front) data were assigned to all sets based on the exact date and coordinates. Details regarding the source, technical specifications and processing of these data are summarized in Table 2. Index of abundance was estimated indirectly from the nominal catch per unit effort (CPUE), calculated as the number of fish caught per 1000 of hooks deployed. CPUE represents the success of fishing (Ricker, 1975) from commercial fishery statistics and is a fishery performance index widely used to investigate trends in resource abundance. By this definition we made the assumption that fishery performance is equivalent to relative apparent abundance (Marr, 1951).

Fig. 1. Map of the studied area with spatial distribution of fishing effort (top), catch per unit of effort (CPUE) of blue shark (middle) and CPUE of oilfish (bottom) 1998–2005 and 2003–2005 in the eastern Mediterranean Sea (Note: spatial resolution of fishing effort is 1/2 of a degree; values refer to the whole study period and not individual fishing sets).
Table 1. Number of ports, vessels, fishing sets, hooks deployed, blue sharks, oilfish and swordfish caught by fishing gear in the eastern Mediterranean Sea, during the period 1998–2001 and 2003–2005 (ports and vessels overlap between fishing gears).

Table 2. Summary of environmental parameters specifications included in the analyses.

aNOAA (National Oceanic and Atmospheric Administration). Sea surface temperature (SST) gradient was calculated as the value of the gradient function in each fishing location taking into account the SST values of the surrounding area. Since we had binary data, it was preferred over the most commonly used ‘Sobel’ operator which is an image detecting algorithm. DSST and DSST gradient was the difference of SST and SST gradient values of a fishing location between the exact fishing date and one month later; bGISIS–DLR (Graphical Interface to the Intelligence Satellite data Information System–Deutsches Zentrum für Luft und Raumfährt e.V.); cMATLAB is a registered software of Mathworks Inc. Version 5.2.0 was used; d‘Focus on Today’ is a freely available software by RAJE Software; edistance from coast was estimated locating the nearest land pixel (bottom depth >0) based on the bathymetry data and calculated the straight line between the two points in nautical miles (after corrections due to the Earth's spheroid shape); fCentre ERS d'Archivage et de Traitement–IFREMER (French Research Institute for Exploitation of the Sea); igdistance front was calculated as the shortest distance of a fishing location to a point with SST gradient >1°C/km.
Statistical analyses—modelling
In problems where there is the feeling that no straightforward functional relationships between the predictor and response variables exist, GAMs have been suggested as a suitable solution (Hastie & Tibshirani, Reference Hastie and Tibshirani1990; Chambers & Hastie, Reference Chambers and Hastie1997; Bigelow et al., Reference Bigelow, Boggs and He1999; Maunder & Punt, Reference Maunder and Punt2004; Venables & Dichmont, Reference Venables and Dichmont2004).
In a GAM the expected values Y i of the response variable are related to the predictor variables Z mi according to the following general formulation:
where the response variable is allowed to follow any distribution from the exponential family, f is the link function, LP is the linear predictor, c is the intercept, s m() is the one-dimensional smooth function of covariate Zm, and Zmi is the value of covariate m for the i-th observation (Wood, Reference Wood2006). The smooth function s m() is represented using penalized regression splines, estimated by penalized iterative least squares (Wood, Reference Wood2006). The optimum degree of smoothing was defined by the generalized cross-validation (GCV) criterion using the mgcv package (Wood, Reference Wood2006) in R v.2.6.0 (R Development Core Team, 2007).
CPUE distributions were skewed, including many zero or low values and few large observations. To deal with this hurdle, we applied the commonly used in these cases ‘Delta-model’ approach (Maunder & Punt, Reference Maunder and Punt2004), modelling separately: (1) the probability of a zero observation; and (2) the positive catch rates. Response variable in the first sub-model was the binary variable Presence, assigned a value of 0 if no blue sharks or oilfish were present in the catch, and 1 otherwise (Bernoulli-type 0/1 measurements). In the second sub-model (positive catch rates) the response variable was CPUE.
A series of 16 candidate models (plus the null model) were constructed including some combinations of the thirteen parameters under investigation that plausibly influenced species abundance (Table 3). ‘Best’ model selection was based on their corresponding GCV scores (Wood, Reference Wood2006). The Akaike information criterion (AIC) and its corresponding evidence ratios (Burnham & Anderson, Reference Burnham and Anderson2002; Ortiz & Arocha, Reference Ortiz and Arocha2004) were used to identify the most appropriate underlying probability distribution before modelling our data. The obvious dependency among bathymetry and distance from coast imposed the use of only one of them in the GAM analyses. For similar reasons frontal energy index (SST gradient) and distance from a thermal front (Distance.Front) were never present together in the same model. Finally, in view of the fact that large pelagic fish exhibit extensive temporal (annual and diel) migrations, month, year and gear were decided to be present in all candidate models as potentially significant predictor variables of relative population density (Nakamura, Reference Nakamura1969).
Table 3. The set of candidate models.

:, denotes interaction between predictors.
RESULTS
Detailed information regarding nominal catches for both species is given in Table 4 and graphically depicted in Figure 1.
Table 4. Effort (thousands of hooks), number of fish captured, and nominal catch per unit of effort (CPUE) values (number of fish/1000 hooks) by fishing gear and month for blue sharks and oilfish caught in the eastern Mediterranean Sea, during the period 1998–2001 and 2003–2005.

Blue shark
ENCOUNTERING BLUE SHARKS—PROBABILITY OF CATCHING A SHARK (PRESENCE–ABSENCE MODEL)
Analysis based on GCV revealed that model mod12 including only seven variables was the best to describe our data (Tables 3 & 5) explaining 9.5% of the variance in the probability of encountering blue sharks. The temporal (year and month) and operational factors (fishing gear type) had the greatest effect on encountering blue sharks. The fitted probability of encountering blue sharks as a function of month, revealed an overall seasonal increasing trend from spring to autumn (Figure 2). The annual effect demonstrated a continuous decline throughout the study period (Figure 2). The operational factor investigation brought to light that the ‘American type’ swordfish longline was more effective in obtaining non-zero catches than the traditional swordfish long-line (Figure 2). Geographical location effect on encountering blue sharks gave a sign of spatially imbalanced occurrences, the probability rising to the south-west (south Ionian Sea; Figure 2). SST plot dictated that catches were more frequent in cooler surface waters (Figure 2). Lunar disc illumination influenced captures positively, the probability being higher around the time of the full moon (Figure 2).

Fig. 2. Generalized additive model (GAM) derived effects of the investigated parameters on the Delta-binomial probability of encountering blue sharks. Dashed lines indicate 2 standard errors above and below the estimates. Relative density of data points is shown by the ‘rug’ on the x-axis.
LOCAL ABUNDANCE (POSITIVE CATCH RATES SUB-MODEL)
From our knowledge to date, blue sharks are not considered as species forming schools. Thus, the presence–absence component sub-model presumably described the probability of encountering solitary free swimming blue sharks. Once encountered, the positive catch rates sub-model quantified the probability of how many will there be, being the measure of local abundance.
Evidence ratios supported the use of a Gaussian distribution with a log link function (Table 5). Assuming a Gaussian (link = log) distribution for the underlying dataset we examined the set of candidate models based on their GCV scores. Model mod11 with 8 variables was selected as the most suitable (Tables 3 & 5). The model explained 72.9% of the variance in the probability of positive blue sharks CPUE. The ‘American type’ swordfish long-line was the one to which blue sharks were more vulnerable (Figure 3). The annual plot showed no stable trend, positive CPUEs fluctuated through the years with minimums in 1999 and 2003 (Figure 3). The modelled probability of an elevated blue shark catch by month, showed a reverse pattern compared to the probability of encountering blue sharks, signifying that although blue sharks were not likely to be caught during spring (binomial component), the catch during a fishing set taking place at the end of this season was more likely to be a large one (Gaussian (log) component) (Figure 3). Longitude demonstrated a reverse pattern compared to the probability of encountering a blue shark: positive catch rates related to longitude increased eastwards (Levantine region) (Figure 3). The other spatial predictor plot (latitude) was monotonic indicating higher catches to the north. The distance from coast graph (Figure 5), showed a positive trend in favour of coastal areas: an elevated blue shark catch being more likely near the coastline (<20 nautical miles). Thermal preference of blue sharks catch rates displayed again a reverse trend compared to the lower temperatures that sharks occurred more frequently (Figure 3). Obviously, the probability of making a larger catch was higher in warmer waters (SST > 24°C). The probability of the celestial factor (lunar index) appeared to be positively affected by the percentage of lunar disc illumination (Figure 3).
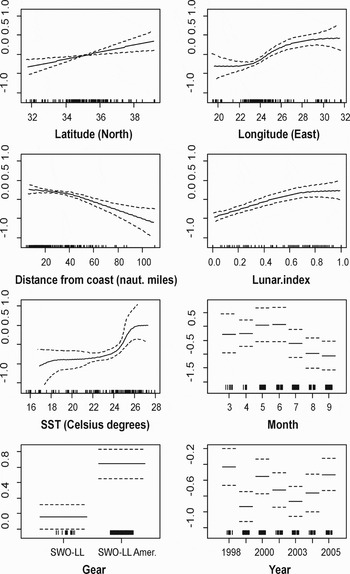
Fig. 3. Generalized additive model (GAM) derived effects of the investigated parameters on the Delta-Gaussian (log) probability of positive blue shark catch rates. Dashed lines indicate 2 standard errors above and below the estimates. Relative density of data points is shown by the ‘rug’ on the x-axis.
Table 5. Summarized results of the ‘best’ models selected for the presence–absence and positive catch rates data regarding blue shark and oilfish caught in the swordfish longline fishery of the Mediterranean Sea. Pr(F) refers to the P values from an ANOVA F-ratio test; Edf are the estimated degrees of freedom.

Error distrib., error distribution.
Oilfish
ENCOUNTERING OILFISH—PROBABILITY OF CATCHING AN OILFISH (PRESENCE–ABSENCE MODEL)
Analysis based on GCV revealed that model mod12 with 7 variables was the best to describe our data (Tables 3 & 5) explaining 31.0% of the variance in the probability of encountering oilfish. The temporal (year and month) factors had a considerable effect on encountering oilfish. The fitted probability of encountering oilfish as a function of month, revealed an escalating seasonal trend from spring to mid-summer followed by an insignificant fall thereafter (Figure 4). The annual effect illustrated a constant increase of oilfish after 2003 (Figure 4). Spatial occurrence of oilfish exhibited an inclination of this species to the eastern regions (longitude >25°E). Latitude illustrated a peak around 35°N which coincide with the northern Levantine area (Figure 4). The lunar cycle (lunar index) had a profound effect on catches. Oilfish seemed to avoid the surface during nights that moonlight was intense (Figure 4). The SST plot was in support of oilfish favouring cooler surface waters (<20°C; Figure 4).

Fig. 4. Generalized additive model (GAM) derived effects of the investigated parameters on the Delta-binomial probability of encountering oilfish. Dashed lines indicate 2 standard errors above and below the estimates. Relative density of data points is shown by the ‘rug’ on the x-axis.
LOCAL ABUNDANCE (POSITIVE CATCH RATES SUB-MODEL)
Evidence ratios supported the use of a Gamma distribution with a log link function (Table 5). Assuming a Gamma (link = log) distribution for the underlying dataset we examined the set of candidate models based on their GCV scores. Again model mod12 was selected as the most suitable (Tables 3 & 5). The model explained 60.5% of the variance in the probability of positive oilfish CPUE. Positive catch rates by year showed annual fluctuations (Figure 5). Intra-annual variation (month) showed an analogous pattern that was observed for the blue sharks. Although the probability of encountering oilfish was higher in late summer, a large catch was more plausible during spring (Figure 5). Fishing gear type effect confirmed again the ‘efficiency’ of the ‘American type’ swordfish long-line (Figure 5). The effect of longitude (Figure 5) indicated a strong gradient in the catch rates of oilfish, the probability increasing to the east. Positive oilfish catch rates trend was in agreement with the trend of the probability of making a catch, when it came to SST. Preference for lower temperatures (<20°C) was noticeable in both sub-models (Figure 5). Once again, the effect of lunar index was remarkable. Catch rates diminished around the full moon quarter (Figure 5).

Fig. 5. Generalized additive model (GAM) derived effects the investigated parameters on the Delta-Gamma (log) probability of positive oilfish catch rates. Dashed lines indicate 2 standard errors above and below the estimates. Relative density of data points is shown by the ‘rug’ on the x-axis.
DISCUSSION
Our study was the first to investigate the distribution of blue shark in the eastern Mediterranean Sea and the first worldwide for oilfish, by examining how a set of environmental features and fishery dependent abundance were associated.
Blue shark
Nominal CPUE values observed during the surveys were very low compared to analogous values from surveys conducted in the western Mediterranean and Atlantic (Buencuerpo et al., Reference Buencuerpo, Rios and Moron1998; Hazin et al., Reference Hazin, Zagaglia, Broadhurst, Travassos and Bezerra1998; Stone & Dixon, Reference Stone and Dixon2001; Nakano & Clarke, Reference Nakano and Clarke2005; Aires-da-Silva et al., Reference Aires-da-Silva, Hoey and Gallucci2008; Ferretti et al., Reference Ferretti, Myers, Serena and Lotze2008). It is difficult to detect if these low catch rates are an anthropogenic result (depletion from historical fishing—Megalofonou et al., 2009a) or if they reflect the very low productivity of the region. Azov (1991) has explicitly portrayed the eastern Mediterranean as a ‘marine desert’.
SPATIAL VARIABLES AFFECTING CATCHES
Generalized additive model analysis, modelling the probability of encountering a blue shark, revealed that latitude and longitude had a moderate effect (Table 6) probabilities peaking to the south-west (south Ionian Sea). The longitudinal constituent in the presence of blue sharks, the probability increasing from east to west, has been confirmed not only for the studied area, but also throughout the Mediterranean (Megalofonou et al., 2005b). The higher trophic potential of the western part of the Mediterranean compared to the eastern part may be the key factor (Caddy, 1998). On the other hand, elevated catch rates to the north and east (north Levantine basin) indicated a persistent local abundance of blue sharks in this area (Table 6). Although Levantine is generally characterized as oligotrophic, due to the deep vertical mixing of water masses, locally and temporally anomalously very high productive areas have been detected (Siokou-Frangou et al., 2005). Strasburg (1958), Nakano (1994) and Bigelow et al. (1999) described latitudinal patterns in the northern Pacific (sharks being more abundant to the north). The increased probability of catching a shark in higher latitudes could be also attributed to the productivity of the northern areas, due to the incoming nutrients from the numerous rivers, present throughout the north Mediterranean coast (Caddy, 1998).
Table 6. Synoptic table of the trends in the distribution of the studied species.

Note: An upwards arrow indicates that the dependent variable increases as the independent one increases. A downwards arrow indicates that the dependent variable decreases as the independent one increases.
OPERATIONAL VARIABLES AFFECTING CATCHES
The outcome for fishing gear type was an expected result as the use of ‘American type’ swordfish long-line had a significant effect on both the probability of catching a blue shark, and the probability of making a large catch during a fishing set (Table 6). The use of fish attractant chemical light-sticks and thicker, more resilient lines are reasonable explanations for the increased catches of the ‘American type’ swordfish longline when compared to the traditional one.
TEMPORAL VARIABLES AFFECTING CATCHES
Temporal distribution of blue shark catches, indicating higher probability of catching a blue shark during late summer and autumn (Table 6), could be attributed to the recruitment of juvenile blue sharks entering the fishery. Pratt (1979), reports that parturition is taking place from April until July, making autumn and winter a plausible period for the young to enter the fishery. However, Nakano (1994) associated seasonal abundance of blue sharks with their migration pattern. A more systematic examination of catches, incorporating supplementary aspects of the blue shark populations like size, sex and maturity would elucidate the temporal effect. The temporal factor month, behaved differently in the two processes assumed to describe each sub-model (presence/absence model – positive catch rates model). The increased probability of making a larger catch during spring could be biologically interpreted as a sign of reproductive behaviour. Pratt (Reference Pratt1979) cited that late May–early June is the period during which male and female blue sharks sexually interact. Furthermore, Carey & Scharold (Reference Carey and Scharold1990) studying blue sharks using acoustic telemetry techniques, reported a differentiation in their behaviour during this period (late spring), minimizing diurnal vertical migrations and limiting their movements in the surface layer. In this depth they were more vulnerable to surface longlines and that reflected in increased catch rates. Aires-da-Silva et al. (Reference Aires-da-Silva, Hoey and Gallucci2008) studying blue shark catches in the north-western Atlantic from 1950 to 2000 also concluded that spring quarter (April–June) had the higher effect on catches than any other season. The short time series of this study does not allow us to speculate whether the annual decreasing trend in the presence of sharks is a negative result of over-fishing or simply part of a regular inter-annual environmental fluctuation affecting blue sharks distribution and abundance. Ferretti et al. (Reference Ferretti, Myers, Serena and Lotze2008) studying sharks in the north-western Mediterranean region suggest that abundance has declined more than 95% in the last century. Megalofonou et al. (2009a), cite a decrease of 38.5% in the north Ionion blue sharks' CPUE over the past two decades. Nevertheless, the situation seems to be not as dramatic for the eastern most part of the Mediterranean.
ENVIRONMENTAL VARIABLES AFFECTING CATCHES
The cause for the negative relation between blue shark catch rates and distance from coast (Table 6) may be linked with reproductive behaviour. In the North Atlantic, a rapid and concentrated movement inshore, during the late spring, has been reported by Casey (1985), probably to give birth to pups. Additionally, food availability may be another plausible explanation as blue shark prey usually congregates near land, seamounts or banks (Bigelow et al., Reference Bigelow, Boggs and He1999). This study suggests that blue sharks in the eastern Mediterranean were more often caught in cooler waters but locally dense concentrations were more likely to occur in warm areas. Bigelow et al. (Reference Bigelow, Boggs and He1999), cite analogous blue shark CPUE trends with SST in the Hawaiian North Pacific longline fishery. Then again Nakano et al. (Reference Nakano, Makihara and Shimazaki1985) and Nakano (Reference Nakano1994) in the North Pacific observed maximum CPUE values in a temperature range of 14–18°C for surface driftnets and 17–24°C for tuna longlines. The locally high concentrations of blue sharks in warmer waters may be attributed to specific preferences of mature individuals during their spawning period. The lunar cycle may have affected vulnerability. In general, moonlight may synchronize reproduction or alter fish behaviour enhancing parental care or predator avoidance (Taylor, Reference Taylor1984). It is also documented that depth distribution may be altered in response to moonlight (swordfish: Carey & Robison, Reference Carey and Robison1981). Hence, changes in swimming depth in response to moon phases could change sharks vulnerability to a specific depth of longline gear. Mediterranean swordfish have exhibited an analogous pattern with the moon phases (Damalas et al., Reference Damalas, Megalofonou and Apostolopoulou2007).
Oilfish
Our research estimated that oilfish comprised almost 10% of the total longline catch and CPUE values were many times higher than those of blue sharks (Table 4), indicating that it is a common resident throughout the eastern Mediterranean and not an occasional visitor. Due to this plentiful presence, they add up as a supplement to fishemen's income who auction their catches in the Greek fish-wharfs as oilfish, but the flesh is sold in retail markets erroneously as processed shark fillets under the name of galeos (Figure 6). If we use the swordfish to oilfish catch ratio observed in this survey (18 kg of swordfish per 1 kg of oilfish) and the official Greek annual catches of swordfish reported to ICCAT (~1500 tons in average), then at least 85 tons of oilfish are annually consumed falsely as sharks. Oilfish have in their flesh quantities of low-density fat (wax esters), to keep themselves buoyant and although this indigestible oil is much prized as a laxative and mosquito repellent (Mackenzie, Reference Mackenzie1995) its purgative properties are blamed for a series of food poisoning by unaware consumers (Leask et al., Reference Leask, Yankos and Ferson2004). Halstead et al. (1990), explicitly described oilfish meat as ‘poisonous to eat’. Scientific information on oilfish comes in short supply. Detailed catch data are scarce or incomplete (Megalofonou et al., Reference Megalofonou, Santamaria, Giacchetta and De Metrio1993; Mejuto et al., Reference Mejuto, García-Cortés and De la Serna2002; ICCAT, 2006; Maguire et al., Reference Maguire, Sissenwine, Csirke, Grainger and Garcia2006). It is most likely that this species has been disregarded and passed unnoticed by the research community so far. As a proof of this ‘overlooking’, comes the fact that three concurrent studies undertaken within the geographical boundaries of our surveyed area report the species as ‘a first record’ (Bettoso & Dulčić, Reference Bettoso and Dulčić1999; Kaya & Bilecenoğlu, Reference Kaya and Bilecenoğlu1999; Elbaraasi et al., Reference Elbaraasi, Elmariami, Elmeghrabi and Omar2007). As a result of this lack of information we can only hypothesize on how the spatial, temporal, and environmental features related to the species biology and on what extent did they influence its distribution and abundance.

Fig. 6. Processing of oilfish caught in the eastern Mediterranean, sold as shark fillets in retail market.
SPATIAL VARIABLES AFFECTING CATCHES
Contrasting to the observations on blue sharks, spatial distribution of oilfish was not as complex. Catch rates of oilfish related positively to longitude (Table 6). This suggests that the species remains in the Levantine all year round. The Levantine is a unique area with remarkable oceanographic characteristics with surface waters movement and variability (eddy kinetic energy) being the highest in the Mediterranean (Pujol & Larnicol, Reference Pujol and Larnicol2005). In such areas, biomass of forage organisms is usually higher due to lateral and vertical mixing stimulating primary and secondary production. (Olson & Backus, Reference Olson and Backus1985).
OPERATIONAL VARIABLES AFFECTING CATCHES
Fishing gear configuration was a less significant constituent in modelling oilfish catches (Table 6). Although the ‘American’ type swordfish longline exhibited slightly higher probabilities of catching a fish, as well as higher catch rates (when oilfish were present in the catch) these fishery dependent abundance indices were actually too close to distinguish. This discovery can be interpreted as a sign of full occupation of the water column by oilfish. Traditional swordfish longline is set in the superficial water strata (<20 m), while the ‘American’ type one may reach depths of more than 50 m. Pakhorukov & Boltachev (Reference Pakhorukov and Boltachev2001), operating a manned submersible device in the south-eastern Atlantic and the Indian Oceans, made visual observations on oilfish at a depth of 1160 m. During the light hours of the day, oilfish dwelled mainly 0.1 to 7 m from the bottom ground. At night, a part of the species population performed feeding vertical migrations ascending to the epipelagial zone at depths less than 100 m.
TEMPORAL VARIABLES AFFECTING CATCHES
Monthly distribution of oilfish catches is more or less like the blue shark trends (higher probability of making a catch during summer, higher catch rates in spring; Table 6). Tserpes et al. (Reference Tserpes, Tatamanidis and Peristeraki2005), studying only presence–absence data concluded to analogous results. The hypothesis that accompanied our results on blue sharks temporal variations may be applicable on oilfish as well. Nishikawa (Reference Nishikawa1987), studying the composition and distribution of gempylid larvae in the Pacific waters of Japan, verified the presence of R. pretiosus larvae during May to July in his samples. Presumably, spawning period takes place during late spring–early summer and a differentiation in their behaviour throughout this period (as documented for blue sharks) may have exposed them to the hazards of surface longlining to a larger extent than the rest of the year.
ENVIRONMENTAL VARIABLES AFFECTING CATCHES
Sea surface temperature (SST) was a high-ranking factor in our oilfish models. The striking preference for cooler waters (Table 6) must be accredited to the benthopelagic nature of the species. Spending most of its time in deep cold waters it looks as if it is making short nocturnal feeding visits to the surface when the waters are suitable, favouring lower temperatures. The species avoided surface waters during highly illuminated nights (full moon), confirming the observations of Pakhorukov & Boltachev (Reference Pakhorukov and Boltachev2001) that they stay at the bottom floor during the hours that superficial waters are illuminated.
Implications for management
It is clear that the study of biological responses to environmental variability is a very complex subject. Complexity increases further because there is not a simple causal relationship between a biological component and a particular environmental property (Santos, Reference Santos2000). Although there will always be some uncertainty in statistical estimates, all models in this inquiry suggested a significant association of blue shark and oilfish distribution with certain environmental factors. Even if blue shark inter-annual variation of relative abundance showed a diminishing trend during the period 1998–2005, the time span of the existing data was too brief to deduce any solid conclusions upon the temporal trend of catches in the long-term (declining, stable or increasing) and therefore the status of blue shark and oilfish in the eastern Mediterranean cannot be reliably assessed. However, their stocks and especially blue sharks should be treated with caution in view of the fact that Mediterranean blue sharks most likely form a distinct isolated population, since tagging data from the North Atlantic suggested little or no connection to the Mediterranean. Stock assessment on blue shark data is carried out under the assumption of separate Atlantic–Mediterranean stocks since Mediterranean data were not available until recently (ICCAT, 2006). Only recently, estimates of size at maturity, as well as age and growth of Mediterranean blue sharks became available (Megalofonou et al., 2009b).
Furthermore, the impact of fishing mortality on the Mediterranean populations remains a big challenge for the local scientific community. It is worrying that their currently low market value (1/3 of swordfish) has not discouraged fishermen from retaining them on board and discarding has been an exceptional practice (Megalofonou et al., Reference Megalofonou, Yannopoulos, Damalas, De Metrio, Deflorio, de la Serna and Macias2005b, 2009a). The current catch proportion of blue sharks and oilfish in the Mediterranean swordfish fishery is far from negligible, taking into account that they are incidental captures. We can easily speculate on a future scenario where fishing mortality escalates from incidental by-catch level to a target fishery level. A plausible decline of swordfish catches (stock depletion due to over fishing?) or a future rise in blue shark and oilfish prices, may force fishermen towards abundant by-catch species configuring their gears so as to target sharks and oilfish. Kotas et al. (2000), reported that gradually and due to increasing shark fins demand in the Brazilian market, monofilament nylon line of the sword fishery has been replaced by steel wire to target sharks as well. The consequences of this intensified fishing mortality, mainly on blue shark populations, may be dramatic due to their special biological characteristics (low productivity, close stock–recruitment relationships and slow stock recovery in the event of overfishing). Elasmobranchs, taken as by-catch in fisheries targeting other species could be extirpated long before appropriate management policies could be implemented (Walker, Reference Walker1998; Castro et al., Reference Castro, Woodley and Brudek1999). Recent research suggests that the absence of sharks can indirectly alter predation pressure on different fish species via behavioural responses of meso-consumers released from predator intimidation and shark declines might have stronger ecological consequences than previously recognized (Frid et al., Reference Frid, Baker and Dill2008).
The high vulnerability of both species to surface longlining during spring months, would suggest a seasonal closure of fishery, while a minimum landing size (as already in action for other large pelagics: swordfish and bluefin tuna) would take pressure off the immature part of the populations. On the other hand, the highly migratory nature of large pelagic fish and their free-ranging behaviour in a relatively inaccessible and concealing environment ignoring national boundaries poses several difficulties. Even though regulations fixing a common regime for fisheries resources in the framework of the Common Fisheries Policy have been adopted since 1983 by the European Union member states, both species continue to be entirely uncontrolled and actually unmanaged in the Mediterranean Sea. The situation seems alarming and urges for a future research plan involving all surrounding nations in the region.
ACKNOWLEDGEMENTS
We wish to thank all the fishermen who assisted observers in data collection, both on-board fishing boats as well as at landing locations. Special thanks to Simon Wood (University of Bath, UK) and Stelios Katsanevakis (Hellenic Center for Marine Research) for their technical assistance on the implementation of GAMs. We especially appreciate Mark Maunder's (IATTC) comments on the biological processes described by the Delta-models and Keith Bigelow's (Pacific Islands Fisheries Science Center, NOAA Fisheries, 2570 Dole Street, Honolulu, HI 96822, USA) input on investigating thermal fronts association with catches. The project was co-financed within Op. Education by the ESF (European Social Fund) and National Resources.


