Introduction
Accurate determination of age in field-caught larvae is crucial to understand the population dynamics of small pelagic fish species, given that even small variations in growth rates during early life history stages can lead to large fluctuations of the recruitment strength (Takasuka et al., Reference Takasuka, Aoki and Mitani2003). Traditionally, the microstructure of larval otoliths is used to estimate the age and consequently daily growth rate variability, both at individual and population levels (Ré & Gonçalves, Reference Ré and Gonçalves1993). Ageing larvae using otoliths microstructure is based on the assumption that increments are formed at a rate of one per day and the counts of the number of increments are representative of larval age (Geffen, Reference Geffen1992). However, several factors can influence the otolith deposition, including salinity, oxygen, photoperiod, temperature and food availability. Of these, temperature and food availability are probably the most important (Feet et al., Reference Feet, Ugland and Moksness2002).
In order to study the relationship between larval growth rates and environmental factors, age determinations of field-caught larvae must be precise (e.g. Schismenou et al., Reference Schismenou, Palmer, Giannoulaki, Alvarez, Tsiaras, Triantafyllou and Somarakis2016). For several species of clupeoids, validation exercises were done to assess the use of otolith microstructure analysis as a proxy of larval age and daily growth. For European anchovy (Engraulis encrasicolus) larvae daily increments were only observed when water temperatures were above 17°C (Aldanondo et al., Reference Aldanondo, Cotano, Etxebeste, Irigoien, Alvarez, de Murguía and Herrero2008). Similarly, for the Japanese anchovy (Engraulis japonicus) daily increments were confirmed for fish growing during the summer months, even for those facing restricted feeding conditions, whereas during the winter, daily increments were not observed, as a consequence of reduced growth rates due to low temperatures (13/14°C, Namiki et al., Reference Namiki, Tanaka, Katayama, Funaki, Aoki and Oozeki2010). In the case of Atlantic herring (Clupea harengus) larvae, low food concentrations and associated low growth rates resulted in less than one increment count per day (Folkvord et al., Reference Folkvord, Blom, Johannessen and Moksness2000; Fox et al., Reference Fox, Folkvord and Geffen2003). These validation methods must be species-specific and take into account the relation between environmental variability and deposition rate.
The European sardine (herein called sardine) Sardina pilchardus (Walbaum, 1792) is a dominant coastal pelagic clupeoid fish distributed from the southern Celtic Sea and North Sea to Mauritania and Senegal, including the Azores, Madeira and Canary Archipelagos as well as the Mediterranean Sea (Correia et al., Reference Correia, Hamer, Carocinho and Silva2014). Off Iberian waters, sardine larvae often dominate the ichthyoplankton communities (Garrido et al., Reference Garrido, Santos, Santos and Ré2009). Due to persistently low recruitment, the size of the Iberian sardine stock has substantially decreased, reaching historical minimum values in 2017 (ICES, 2018). Recruitment success is thought to be closely linked to the variability of the survival of the early life stages (Smith, Reference Smith1985). It is essential to obtain reliable growth rates of field-caught larvae to understand how environment variability influences larval survival and consequently recruitment success. The great majority of studies on sardine larval growth in the field have used otolith microstructure analysis by light microscopy, assuming a daily increment formation. The daily deposition of otolith micro-increments in wild-caught sardine larvae was analysed by Ré (Reference Ré1983b, Reference Ré1984), who assumed a daily formation of otolith checks for sardine larvae and a first check forming at first-feeding but suggested that further rearing experiments were required to confirm this. Subsequently, laboratory experiments showed that increment deposition on sagittae of sardine larvae occurs at the day of hatching (Alemany & Álvarez, Reference Alemany and Álvarez1994; Garrido et al., Reference Garrido, Ben-Hamadou, Santos, Ferreira, Teodósio, Cotano, Irigoien, Peck and Ré2015). Increment formation was daily during the endogenous feeding (until 4 days post hatch (dph) at 16°C) but after that period until 12 dph no increment formation was visible for starving larvae (Alemany & Álvarez, Reference Alemany and Álvarez1994). Laboratory studies have shown that, after hatching, the feeding and growth rates of sardine larvae vary significantly throughout ontogeny (Caldeira et al., Reference Caldeira, Santos, Ré, Peck, Saiz and Garrido2014; Silva et al., Reference Silva, Faria, Teodósio and Garrido2014; Garrido et al., Reference Garrido, Cristóvão, Caldeira, Ben-Hamadou, Saiz, Peck, Ré and Santos2016), which can impact the formation of growth increments in the otoliths. Moreover, growth rates of sardine larvae vary significantly with prey concentration and high prey concentrations are required to guarantee larval survival (Caldeira et al., Reference Caldeira, Santos, Ré, Peck, Saiz and Garrido2014; Silva et al., Reference Silva, Faria, Teodósio and Garrido2014). Field studies have confirmed that during the larval stage, food availability is a limiting factor for sardine larval survival (Ré, Reference Ré1986; Chícharo et al., Reference Chícharo, Chícharo, Valdés, Lopez-Jamar and Ré1998). The availability of prey for sardine larvae coupled with the water temperature can partially explain the inter-annual variability of the recruitment strength of sardines off Iberia (Garrido et al., Reference Garrido, Silva, Marques, Figueiredo, Bryère, Mangin and Santos2017). To date, no study has been conducted to validate the daily increment deposition throughout larval ontogeny, after the first-feeding period and at different feeding conditions.
This work aims to (i) determine the impact of food availability on the increment formation in the otoliths of sardine larvae from hatch to 30 days post hatch reared under laboratory conditions, (ii) analyse the otoliths of larvae growing with four different diets whose range of food densities translate into feeding and growth rates extending from less than required for maintenance to saturated feeding levels.
Materials and methods
Laboratory rearing experiment
The experimental procedures used in this study were approved by the Animal Welfare and Protection of the General Direction of Veterinary (DGV) of the Ministry of Agriculture, Rural Development and Fisheries, approval number 0420/000/000/2011, Lisbon, Portugal, and were in accordance with the guidelines of the European Directive 2010/63/EU of 22 September and the Portuguese legislation that implements such directive nationally.
Sardine adults were captured during 2009 and 2010 and were maintained in tanks with a volume of 15,000 L, at the facilities of the Oceanário de Lisboa, Lisbon, Portugal. Spawning was induced at the start of September 2011 by natural decrease of the photoperiod and increase of daily ration and number of meals per day and decrease of the water temperature from 17 to 15°C. Spawning and experimentation started a month later, during October 2011, a period corresponding to the spawning season in the wild.
As described in Caldeira et al. (Reference Caldeira, Santos, Ré, Peck, Saiz and Garrido2014), naturally fertilized eggs were collected from the captive broodstock using 500 μm mesh egg collector bags placed in the skimmers of the tank, counted and transferred to 30-L cylindrical tanks, where they were incubated at 15°C and a salinity of 35. This temperature corresponds to the peak of the spawning season of sardines off Portugal (Ré et al., Reference Ré, Cabral e Silva, Cunha, Farinha, Meneses and Moita1990; Stratoudakis et al., Reference Stratoudakis, Coombs, de Lanzós, Halliday, Costas, Caneco, Franco, Conway, Santos, Silva and Bernal2007). The light regime was 16 h of light and 8 h of darkness and gentle aeration was used to maintain a steady water circulation and high oxygen concentrations. Larvae were reared with four different feeding regimes: under starvation, and high, medium and low concentration diets, that included different concentration of Gymnodinum sp., rotifers (Brachionus plicatilis), and nauplii, copepodites and adult stages of the calanoid copepod Acartia grani (Suppl Table 1). The concentration of prey remaining in the larval tanks was monitored every day and new prey added to maintain constant concentrations throughout the experimental period. The microalgae Nannochloropsis sp. was added daily to prey stocking tanks (green-water method). Stock cultures of live prey for sardines (A. grani and rotifers, B. plicatilis) were fed ad libitum with Rhodomonas sp. and Nannochloropsis sp., respectively.
Larvae were sampled from each tank during the experimental period as follows: for small larvae (0–16 days dph), ~10 individuals were sampled daily from each tank and older larvae (20–30 dph) were sampled at 3–5 day-intervals (~5 individuals). For sardine larvae reared under starvation, larvae were sampled until the last larvae died. Larvae were measured alive (total length (TL) ± 0⋅05 mm, micrometer on a Zeiss Stemi 2000 dissecting scope) and then preserved in alcohol (92%) when captured at the day of hatching while older larvae were preserved in buffered formalin (pH 8.5–9) (4%) for subsequent otolith extraction. Larvae were anaesthetized (MS-222) before measuring and preservation. TL was measured in vivo for larvae reared with each of the four diet treatments.
Otoliths extraction, preparation and analysis
Larvae were placed on a glass slide with a drop of water and otoliths were extracted from the saccular chamber under a stereoscopic microscope (±0.05 mm, micrometer on a Zeiss Stemi 2000 dissecting scope). One or both sagitta otoliths of sardine larvae were extracted and the glass slides were dried carefully with absorbent paper and the otolith covered with a thin layer of Depex and let dry for 24 h.
The microstructure analyses were carried out using a light microscope Olympus-BX60. A DP50 colour photo-camera coupled to the microscope and the Viewfinder Lite image-analyser software to get images of the otoliths that were posteriorly measured with the Image J software. Otoliths measurements included the total diameter and the diameter of the first check from the centre of the core. Growth increments were counted and measured starting at the hatching check (Campana et al., Reference Campana, Cagne and Munro1987) of both otoliths (right and left) and the mean of counts was used as the number of increments. Examination and reading of the otoliths was carried out using 1000× magnification.
A randomly selected subset of otoliths of fed larvae were selected to be analysed in two higher resolution microscopes: particularly (1) with higher resolution inverted microscopy and (2) with scanning electron microscopy.
A sub-sample of the otoliths was observed in a higher resolution inverted microscope, to assess how the differences in the resolution of the light and the inverted microscope (even using the same 1000× magnification) and the coupled image analysis systems, interfere with the increment count in the otoliths of fish larvae. This sub-sample had 44 otoliths pairs of fed larvae and was analysed using a higher resolution inverted microscope (Leica DMi8) with brilliant LED illumination, at 1000× magnification (63× objective lens coupled with the 1.6× Optovar magnification system). Images were taken by a high resolution Leica DFC550 camera (12 megapixel resolution) with improved quality under white balance mode and contrast method of bright field. Increment count and otolith measurements, which included a measurement of all visible increment widths, followed the same protocol as described above but using the software Leica Application Suite (LAX, 2015 version).
Given that the daily increment formation in the otoliths of sardine larvae was not confirmed while using the light and the inverted microscopes, a small sub-sample of otoliths of fed larvae was used to try to validate the daily periodicity of growth increments by scanning electron microscopy. Several otoliths fixed in Depex resin were selected for the analysis. In order to harden and to polish the Depex off the otoliths, the glass slides were placed on a cold ice base during the process. To avoid losing the otoliths when the Depex pelicula got too thin on the glass slide, they were cut and removed carefully with the least Depex pelicula possible and fixed on a slightly heated glass slide with fast dry resin Crystalbond to finish polishing the otoliths. They were then once more carefully removed from the glass slides and mounted in stubs with adhesive carborundum tape. To increase the exposure of the crystallized part of the increments, otoliths were etched with EDTA 4% (Campana et al., Reference Campana, Cagne and Munro1987) for variable etching times depending on the otolith size. The etching time for sardine larvae otoliths of around 50–55 dph and 69–73 mm diameter which showed better results was between 5–7 min of EDTA 4%. A low pressure and powerful SEM (Hitachi tabletop microscope, TM3030Plus) was used. Observations were done using different magnifications from 2500× to 10,000×. Increments were counted and increment width was measured.
Analysis of field-caught larvae
Sardine larvae collected during a research cruise carried out from 16–20 February 2000 off the north-western Portuguese coast (41.6–40.4N) were used to analyse the otoliths of field-caught larvae. Fish eggs and larvae were sampled using a bongo net of 60 cm mouth diameter fitted with 500 and 335 mm mesh nets. A full description of the sampling is given in Santos et al. (Reference Santos, Peliz, Dubert, Oliveira, Angélico and Ré2004). In the laboratory, fish eggs and larvae were sorted and counted. Sardine larvae were placed on a glass slide with a drop of water and otoliths were extracted from the saccular chamber. Sagittae were covered with a thin layer of Depex and let dry for 24 h. The microstructure of the otoliths was observed using the higher resolution inverted microscope (Leica DMi8) with brilliant LED illumination, and otolith measurements, including all visible increment widths were done as described above.
Data analysis
Before testing for significant differences between treatments, an inspection of assumptions of normality and constant variance was performed. To compare the numbers of increment between left and right otoliths, paired t-test was used. Since growth and otolith data did not follow the assumptions of normality and constant variance, analyses were performed with General Linear Models (GLM), and the best models were selected based on the Akaike Information Criteria. To compare the relationship of size and age between larvae reared at different diets from age 3 to age 15 dph (common range in ages between the four diets), general linear regression models were used to assess if the interactions of size and age were significant. In cases where the interaction term was significant, pairwise comparisons of slopes were then conducted using a Tukey HSD test. Growth rates of 15–30 dph larvae were only compared for larvae grown with high and intermediate diets. GLM was used to assess if the regression between the number of growth increments (Poisson distribution) or otolith diameter (Gamma distribution) and larval age/size were similar between larvae reared on different diets, as well as between the otolith diameter and larval size (total length).
GLMs were used to compare the relationship between age and number of growth increments between otoliths observed with the Olympus-BX60 and the Leica DMi8 microscopes. Potential differences between the increments found with the different microscopes depended on the different setups (high resolution inverted microscope vs regular microscope) and were not dependent on the brand. GLMs were used to compare the relationship of larval size and number of growth increments (or otolith diameter) inspected with the Leica DMi8 inverted microscope between laboratory-reared and field-caught sardine larvae. Statistical analyses were performed using the open source software R version 4.0.2 of R Development Core Team and graphics were done using packages ‘ggplot2’ and ‘interactions’ in the same software.
Results
Growth rates
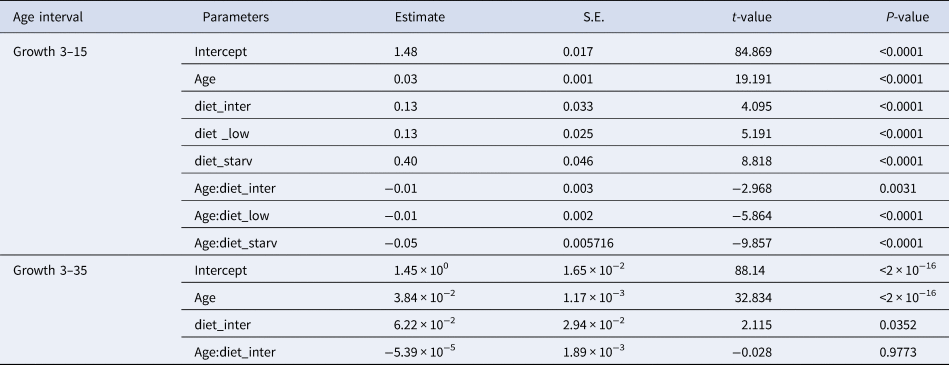
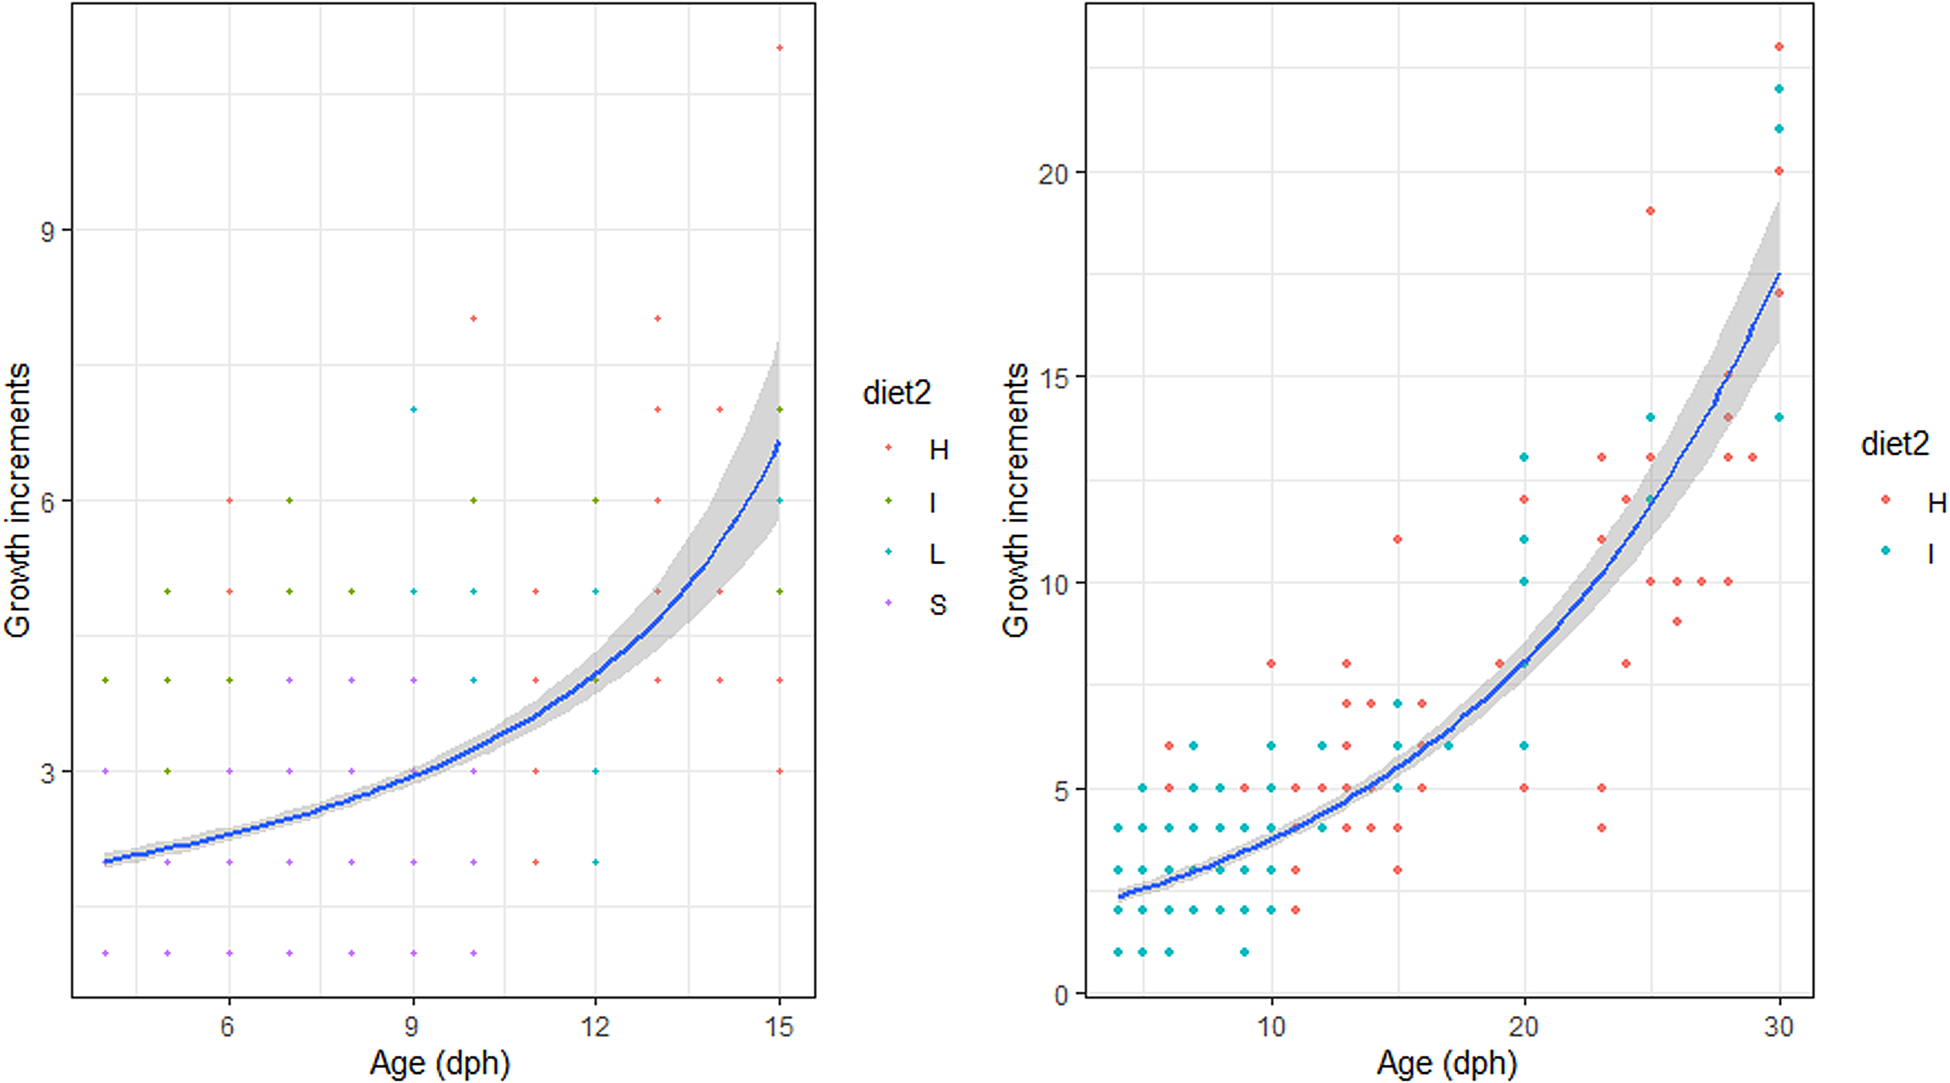
High survival rates of sardine larvae were observed for high, intermediate and low food concentration treatments while larvae reared under starvation died before 13 dph. Larval growth rates varied according to the feeding treatment. The lowest growth rates (0.39 mm day−1 for the period 3–15 dph) were obtained for larvae reared under starvation (Figure 1, Table 1), and for those larvae growth was high during the endogenous feeding and then ceased from 6–12 dph. Growth rates from 3–15 dph were similar between larvae reared with the low and intermediate concentration diets (0.55 and 0.59 mm day−1 for the period 3–15 dph, respectively) and significantly lower than those of larvae reared with high concentration diet (0.61 mm day−1) (Figure 1, Table 1). From 15–30 dph, growth rates were similar between larvae grown with intermediate and high concentration diets (Figure 1, Table 1).
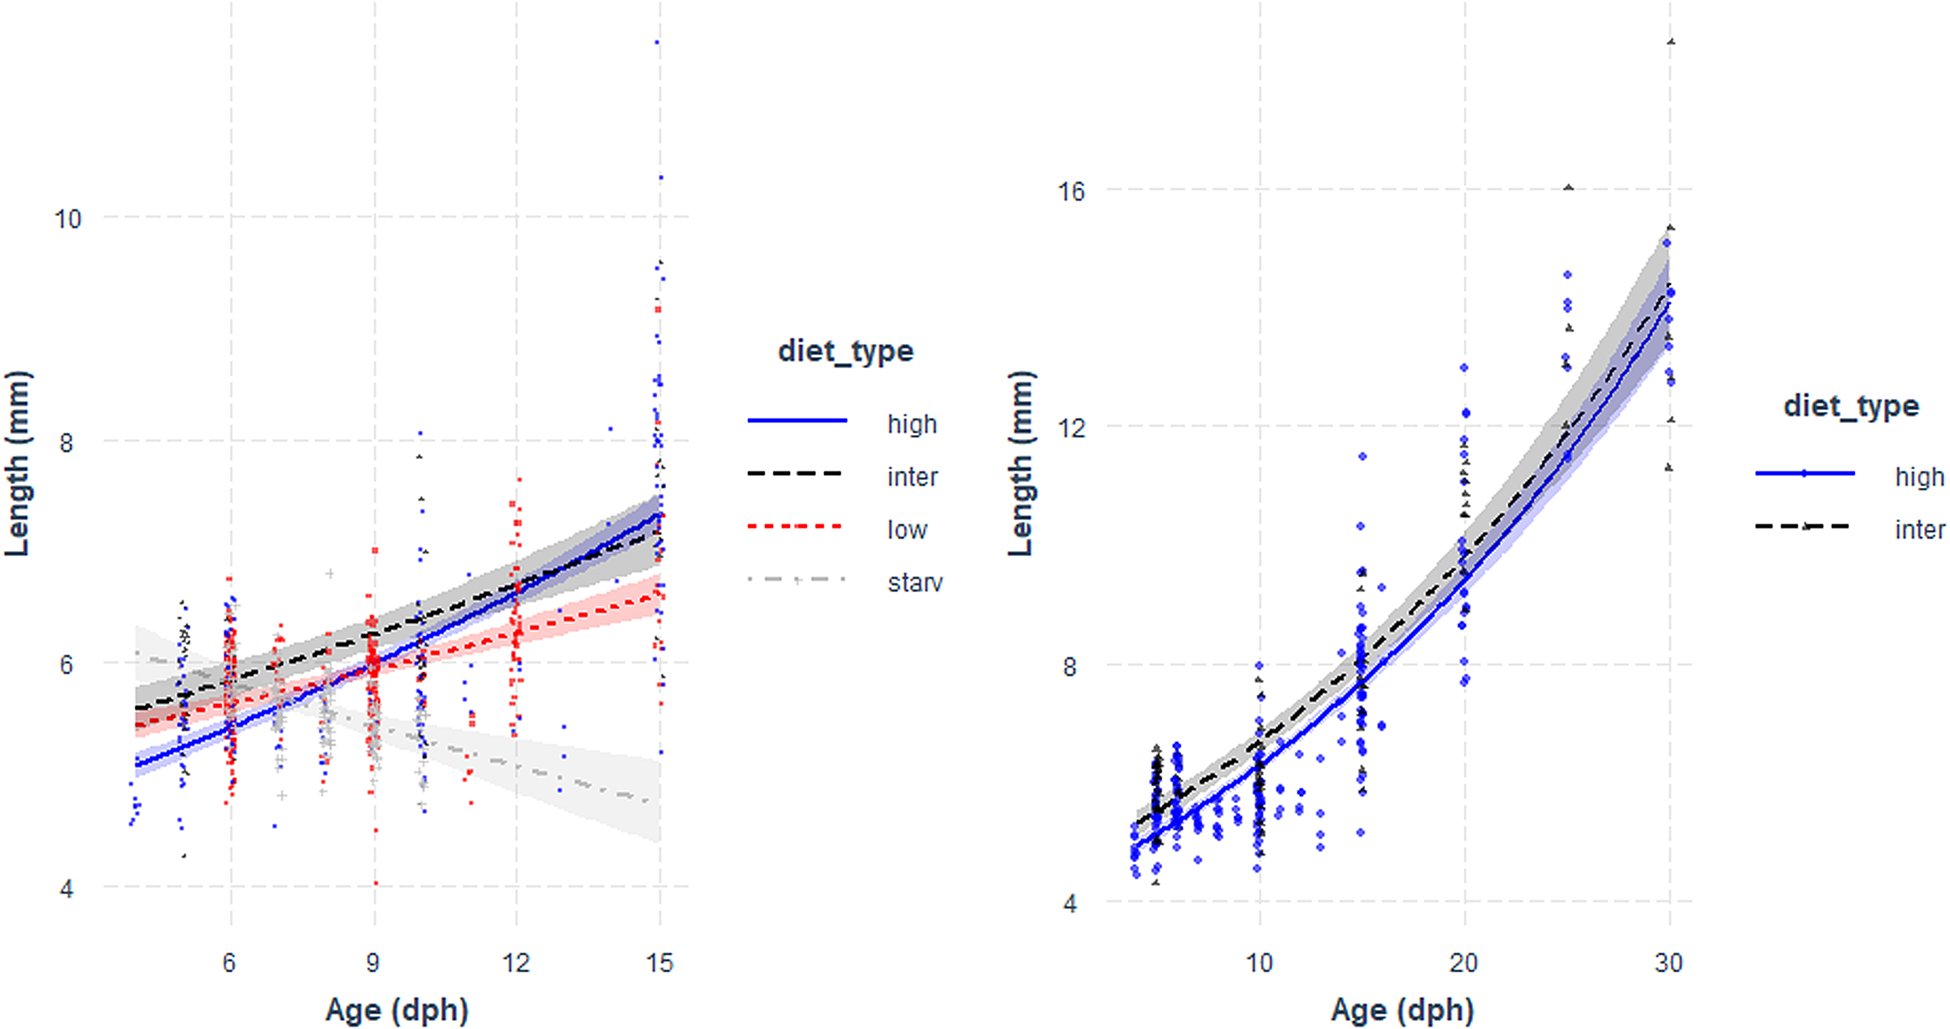
Fig. 1. Total length (mm) vs Age (days post hatch, dph) of sardine larvae reared under four different diet concentrations: (high) High, (inter) Intermediate, (low) Low and (starv) Starvation, from 0–15 dph (left panel) and High and Intermediate concentration diets from 3–30 dph (right panel). Parameters of the regression in Table 1.
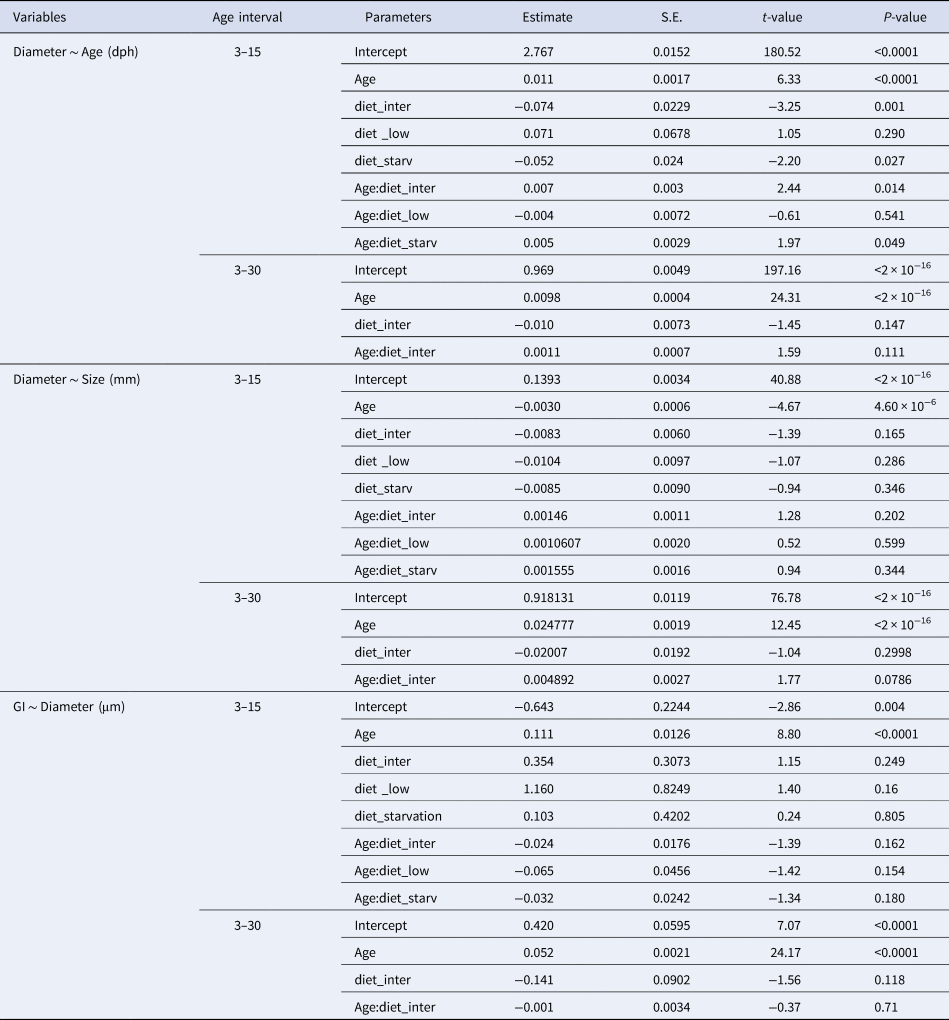
Table 1. Estimated regression parameters, standard errors, t-values and P-values for the Gamma GLMs (log link) of larval size (total length, mm) and age (days post-hatching, dph) for Sardina pilchardus larvae reared with different food concentrations from (a) 3–15 dph and (b) 3–35 dph

Otolith analysis under the inverted microscope
One or both sagittae otoliths were extracted from 220, 118, 107 and 169 larvae reared with high, intermediate and low concentration diets, and under starvation, respectively, and analysed. At hatching, 70.3% of the larvae had a hatching check formed with 10.49 μm (± 1.05 SD) diameter. The hatching check diameter did not change with age or diet (P < 0.05). One to three embryonic increments were also observed in some of the otoliths (21.88%), before the first regular increment was formed at hatching.
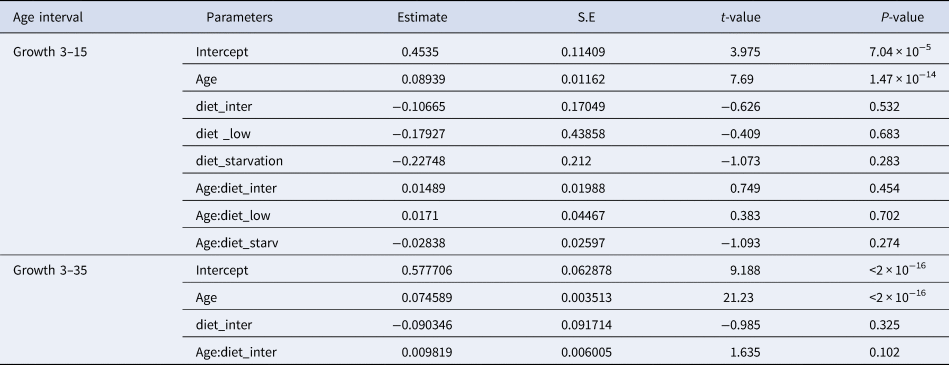
There were no significant differences between the number of increment counts between the pairs of sagittae otoliths (t = 0.53, df = 721, P = 0.60; Supplementary Figure S1). During the endogenous feeding period (0–3 dph), the number of growth increments (GI) increased with age, at a rate of 0.73 day−1. The number of growth increments (GI) counted in the otoliths during the first 15 dph was not significantly influenced by the diet (Figure 2, Table 2). and ranged from 0.17–0.43 GI day−1.

Fig. 2. Relation between Age (days post hatch, dph) and number of growth increments of reared sardine larvae under four different diet concentrations: (H) High, (I) Intermediate, (L) Low and (S) Starvation, from 0–15 dph (left panel) and High and Intermediate concentration diets from 3–30 dph (right panel). Parameters of the regression in Table 2.
Table 2. Estimated regression parameters, standard errors, t-values and P-values for the Poisson GLMs of daily growth increments (number) and age (days post-hatching, dph) for Sardina pilchardus larvae reared with different food concentrations from 3–15 dph and 3–35 dph

From 15–30 dph only experiments with high and intermediate concentration diets had sufficient otoliths analysed to be compared statistically, because the higher natural mortality rate for sardines reared with the low concentration diet affected sampling. The relation between GI and age was significantly steeper than that observed for the first 15 dph and from 3–30 dph it was similar between high and intermediate concentration diets (Figure 3, Table 2). The 95% CI of the GI vs age for sardine larvae reared with high and intermediate diet concentrations ranged from 13.6 and 22.54 GI at age 30 dph (0.45–0.75 GI day−1), lower than the 1:1 relationship.

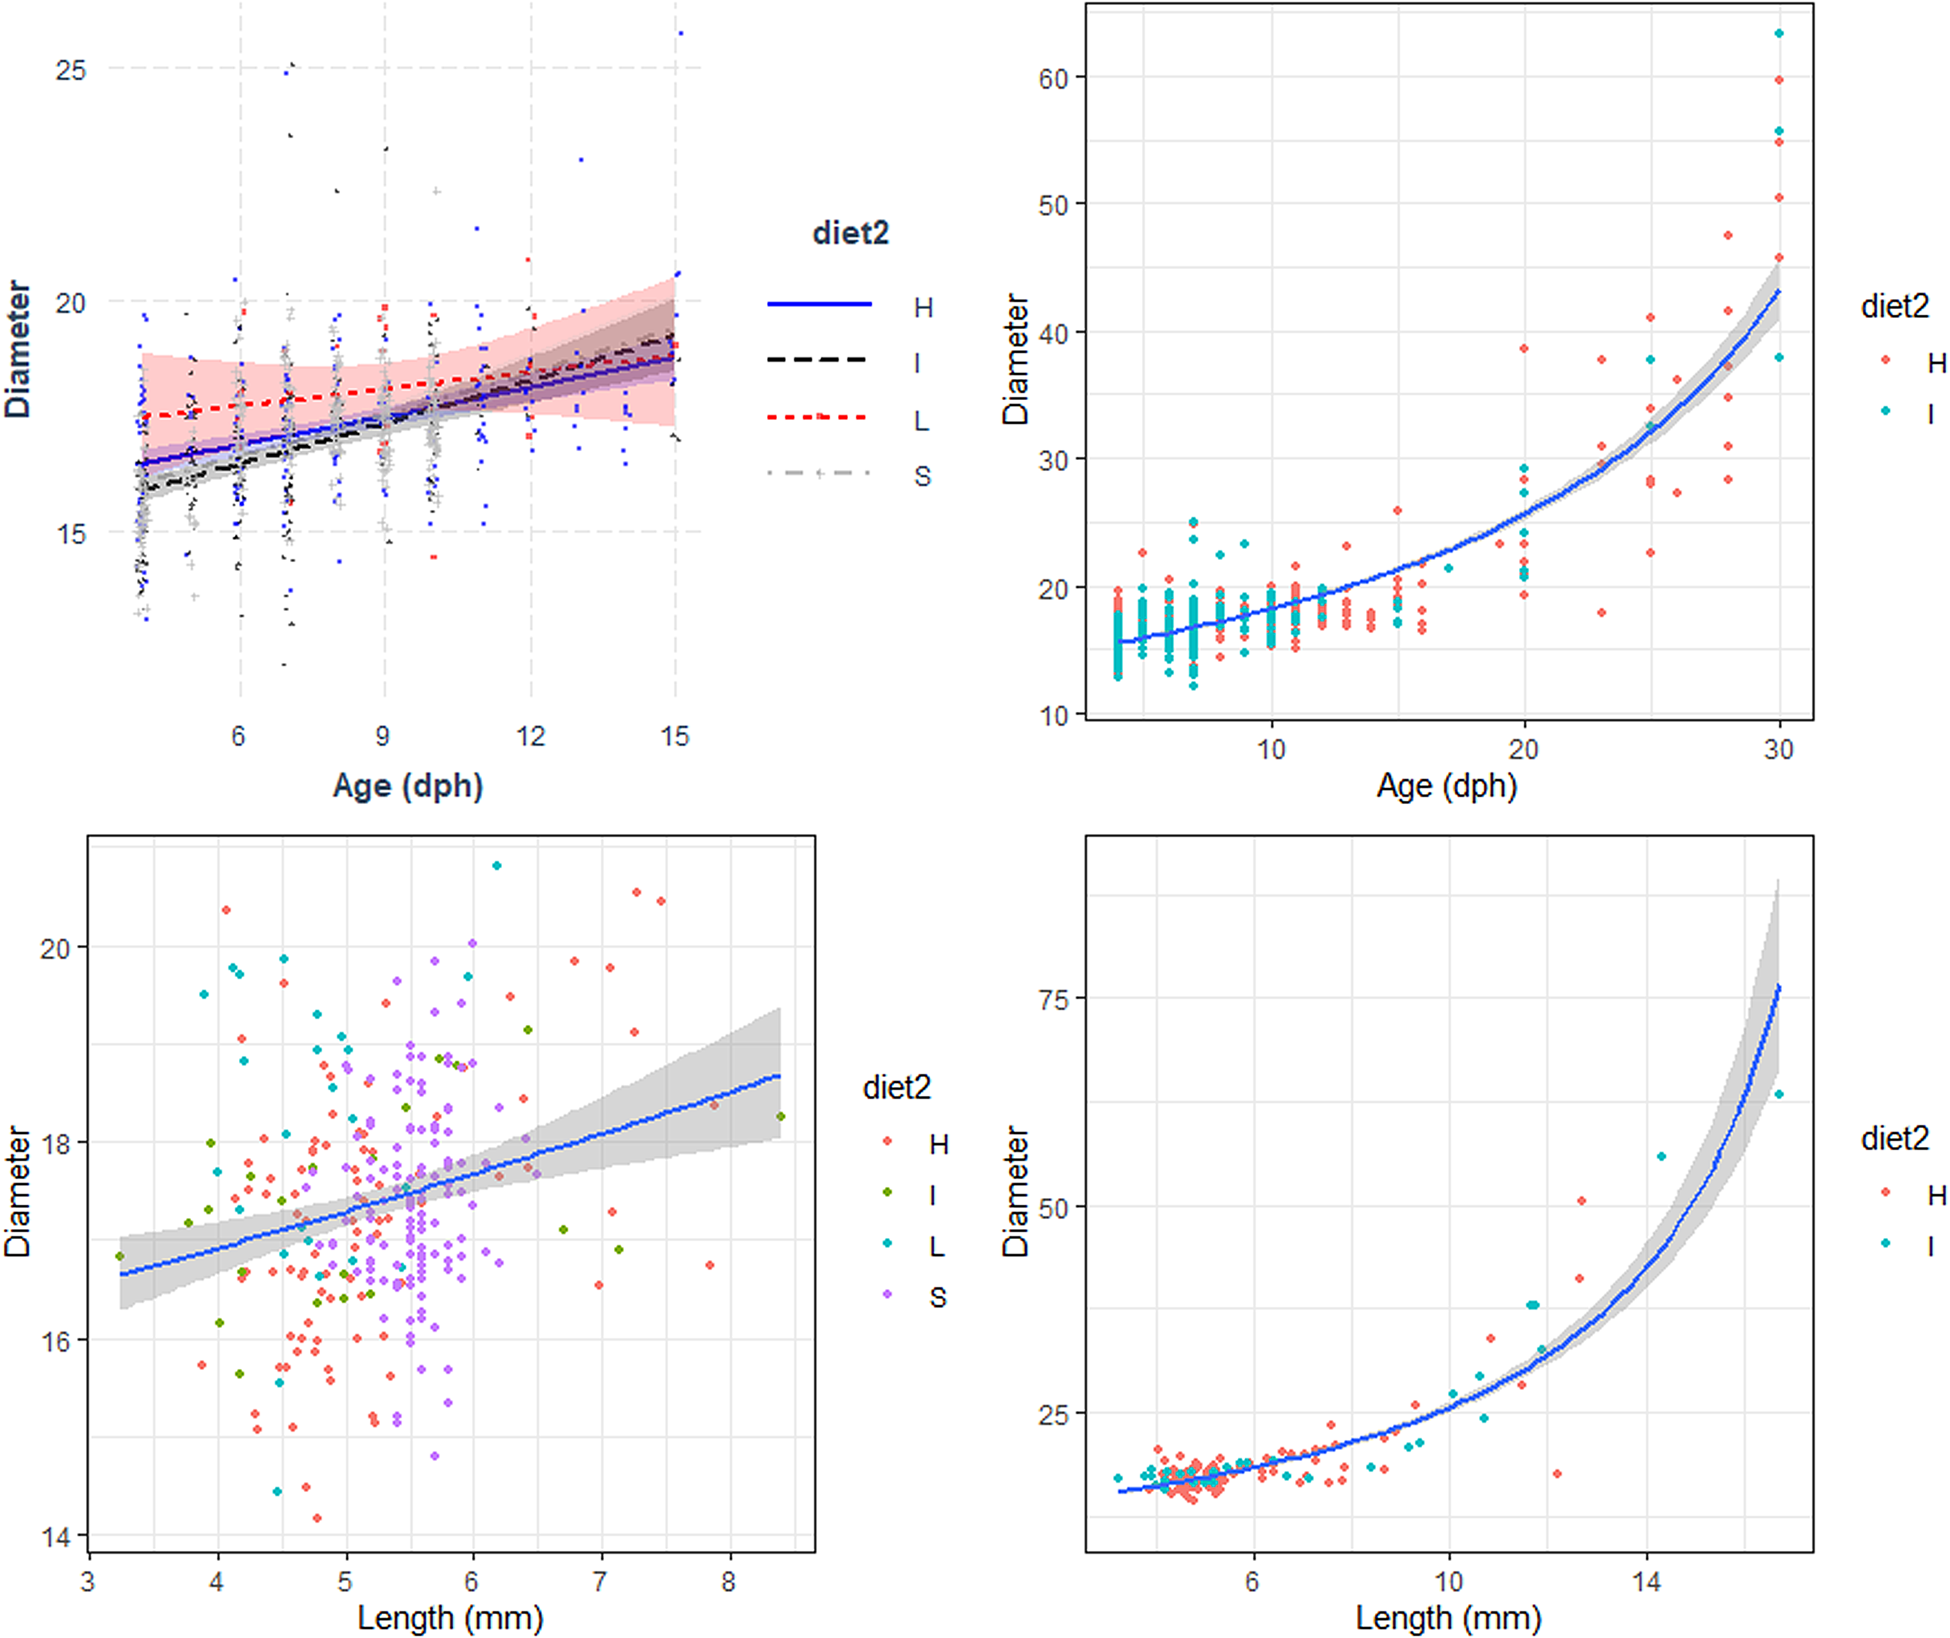
Fig. 3. Relation between the Diameter (μm) with Age (days post hatch, dph) and Length (Total length, mm) of reared sardine larvae under four different diet concentrations: (H) High, (I) Intermediate, (L) Low and (S) Starvation, from 0–15 dph (left panels) and High and Intermediate concentration diets from 3–30 dph (right panels). Parameters of the regression in Table 3.
The relationship between otolith diameter (OD) and age was similar for larvae reared with the four different feeding treatments during the first 15 days post hatch, including those reared under starvation conditions (Figure 3, Table 3). OD increased significantly with larval age for the period 15–30 dph and was similar between the high and intermediate concentration diet. The relation between OD and the number of GI was similar for all diets for the period between 3–15 dph and also between the high and intermediate concentration diets for the period 15–40 dph (Table 3). OD increased significantly with larval length for the period 3–15 dph and was similar between larvae reared with the four diets (Figure 3). The number of increments counted increased with the increase of OD and was similar between the four diets (Table 3). During the period 3 to 30 dph, OD increased significantly with larval size and was similar for larvae reared with high and intermediate concentration diets (Figure 3).
Table 3. Estimated regression parameters, standard errors, t-values and P-values for the Gamma GLMs (Log Link) of otolith diameter (μm) and age (days post-hatching, dph) and size (mm) and number of growth increments (GI) for Sardina pilchardus larvae reared with different food concentrations from (a) 3–15 dph and (b) 3–30 dph
The difference between the actual age of sardine larvae and that estimated by counting the increments in the otoliths showed that, for larvae younger than 2 dph, there is an overestimation of age, probably related to the existence of embryonic increments. After 3 dph (coincident with the beginning of the exogenous feeding), the difference between actual age and the estimated age increased sharply until 17–20 dph, when it stabilized. Larval age was underestimated by 35.6% for larvae from 4 dph to 15 dph reared with all diets, and was underestimated by 47% for larvae from 16–30 dph reared with high and intermediate concentration diets.
Analysis of the otoliths of laboratory-reared larvae under higher resolution microscopy
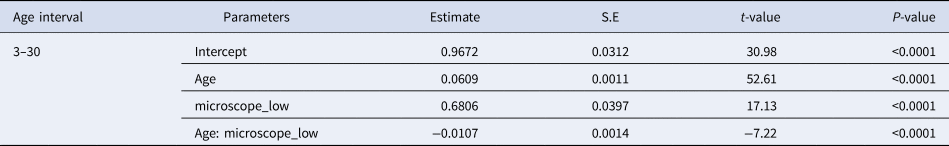
The number of GI-at-age counted in the otoliths observed under higher resolution inverted microscopy was significantly higher than those counted under the previously described results (Table 4). The relationship of GI and age for the sub-sample selected for this analysis was described by
 $$\eqalign{GI = {\rm exp}( 0.97 + 0.06{\rm age}) \cr } $$
for otoliths observed under the lower resolution inverted microscope and was
 $$GI = {\rm exp}( 1.65 + 0.0609{\rm age}) $$
for otoliths observed under the higher resolution inverted microscope. The difference between the actual age and the number of increment counts was significantly lower than that observed in the lower resolution microscopy, ranging from just 1 increment less than the actual age counted in a 15 dph larvae to 12 increments less than the actual age counted in a 40 dph larvae. For the high resolution microscope, the confidence interval of the estimate of growth increments at age 30 dph varied between 18.2 and 30.2 GI day−1.
Table 4. Estimated regression parameters, standard errors, t-values and P-values for the QuasiPoisson GLMs of daily growth increments (number) observed in a higher and a lower resolution microscopes and Age (days post-hatching) for Sardina pilchardus larvae
Increment widths measured with the higher resolution inverted microscope from the nucleus to the outer region of the otolith varied between 0.36 and 2.16 μm (mean 0.84 μm ± 0.303 SD) (Figure 4, left panel). Increment widths were particularly narrow in the first weeks after hatching, for increment counts lower than 20, where several measured below 0.4 μm. From the 35th to 60th increment counted from the nucleus, increment widths were always above 0.4 μm, and just a small percentage of larvae had increment widths between 0.4 and 0.5 μm, while all increment widths from the 60th increment onwards were >0.5 μm (Figure 4, left panel).
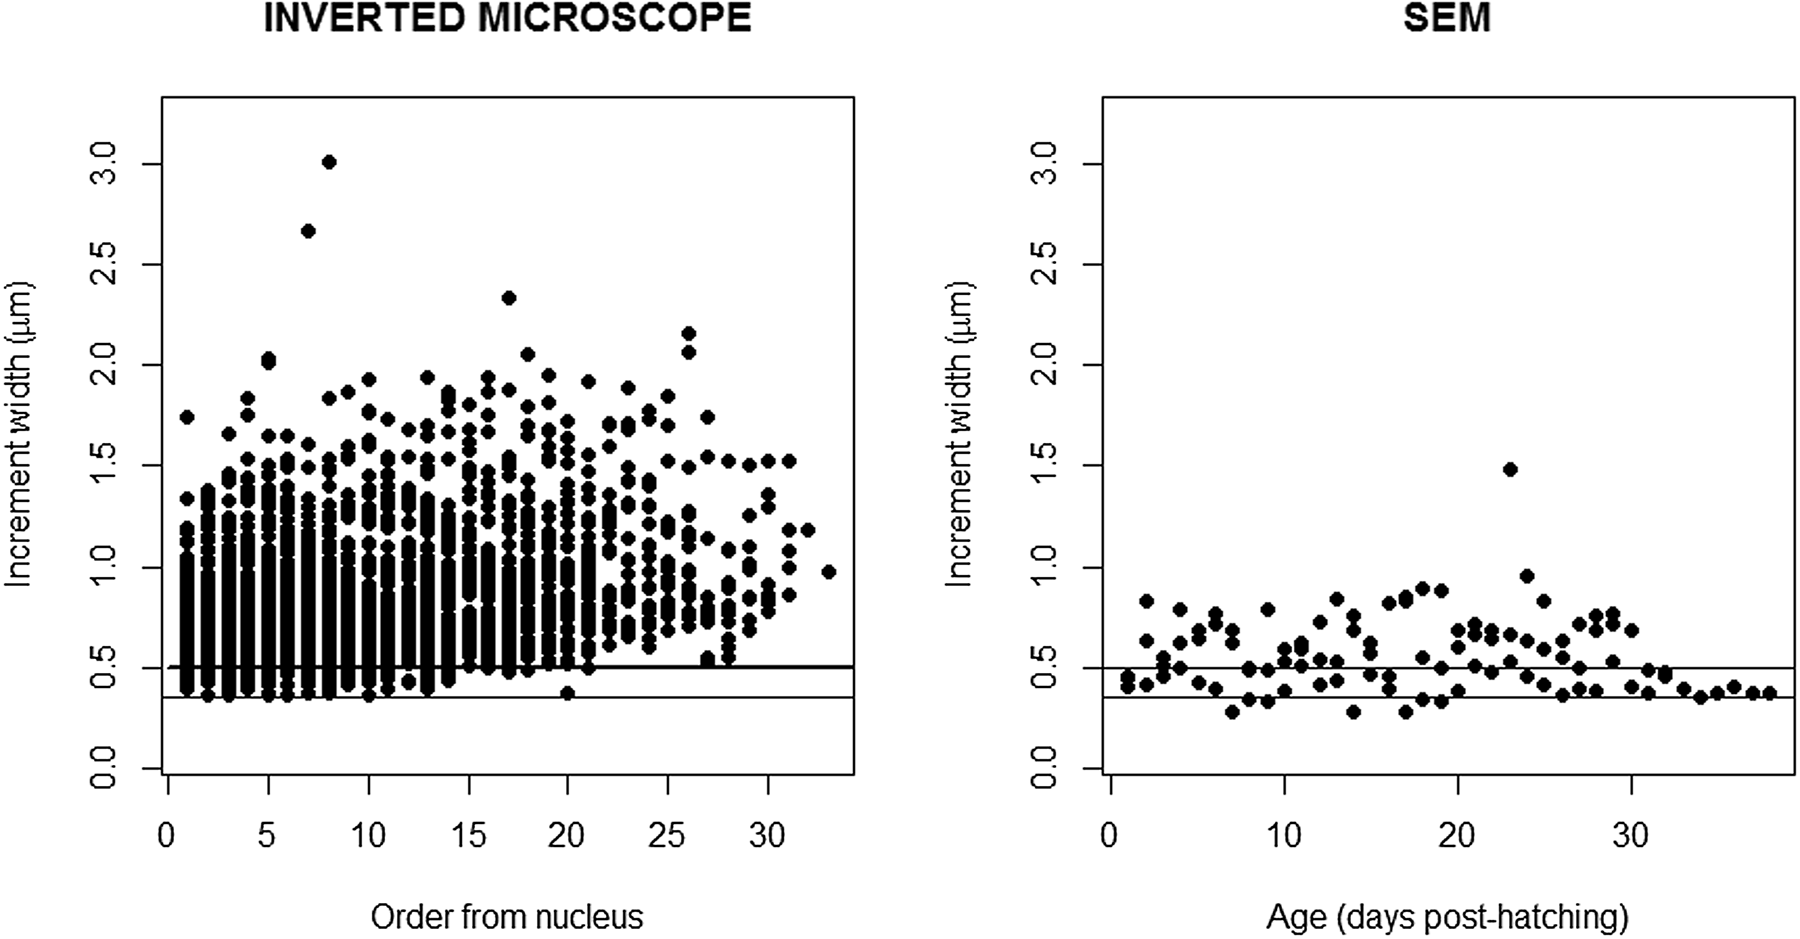
Fig. 4. Increment width (μm) measured in the otoliths of sardine larvae and observed under the high resolution inverted microscope (left panel) and in the scanning electron microscope (right panel). The lines represent 0.3 and 0.5 μm that set the limit of the resolution of the higher and lower inverted microscopes used in this study.
The microstructure of 3 otoliths of fed larvae with 29, 32 and 38 dph was observed in the scanning electron microscope (Supplementary Figure S2). Increment count confirmed the 1:1 relationship with age. Increment widths measured with SEM from the nucleus to the outer region of the otolith varied between 0.28 and 0.89 μm (mean 0.56 ± 0.186 SD) (Figure 4, right panel). A total of 80.39 and 23.75% of the increment widths were <0.5 and <0.4 μm, respectively (Figure 5, right panel). Increment widths were particularly narrow until 20 dph, ranging from 0.28 and 0.89 μm (mean 0.56 μm ± 0.823 SD). Increment widths of larvae >20 dph ranged from 0.36 and 1.48 μm (mean 1.00 μm ± 0.843 SD).

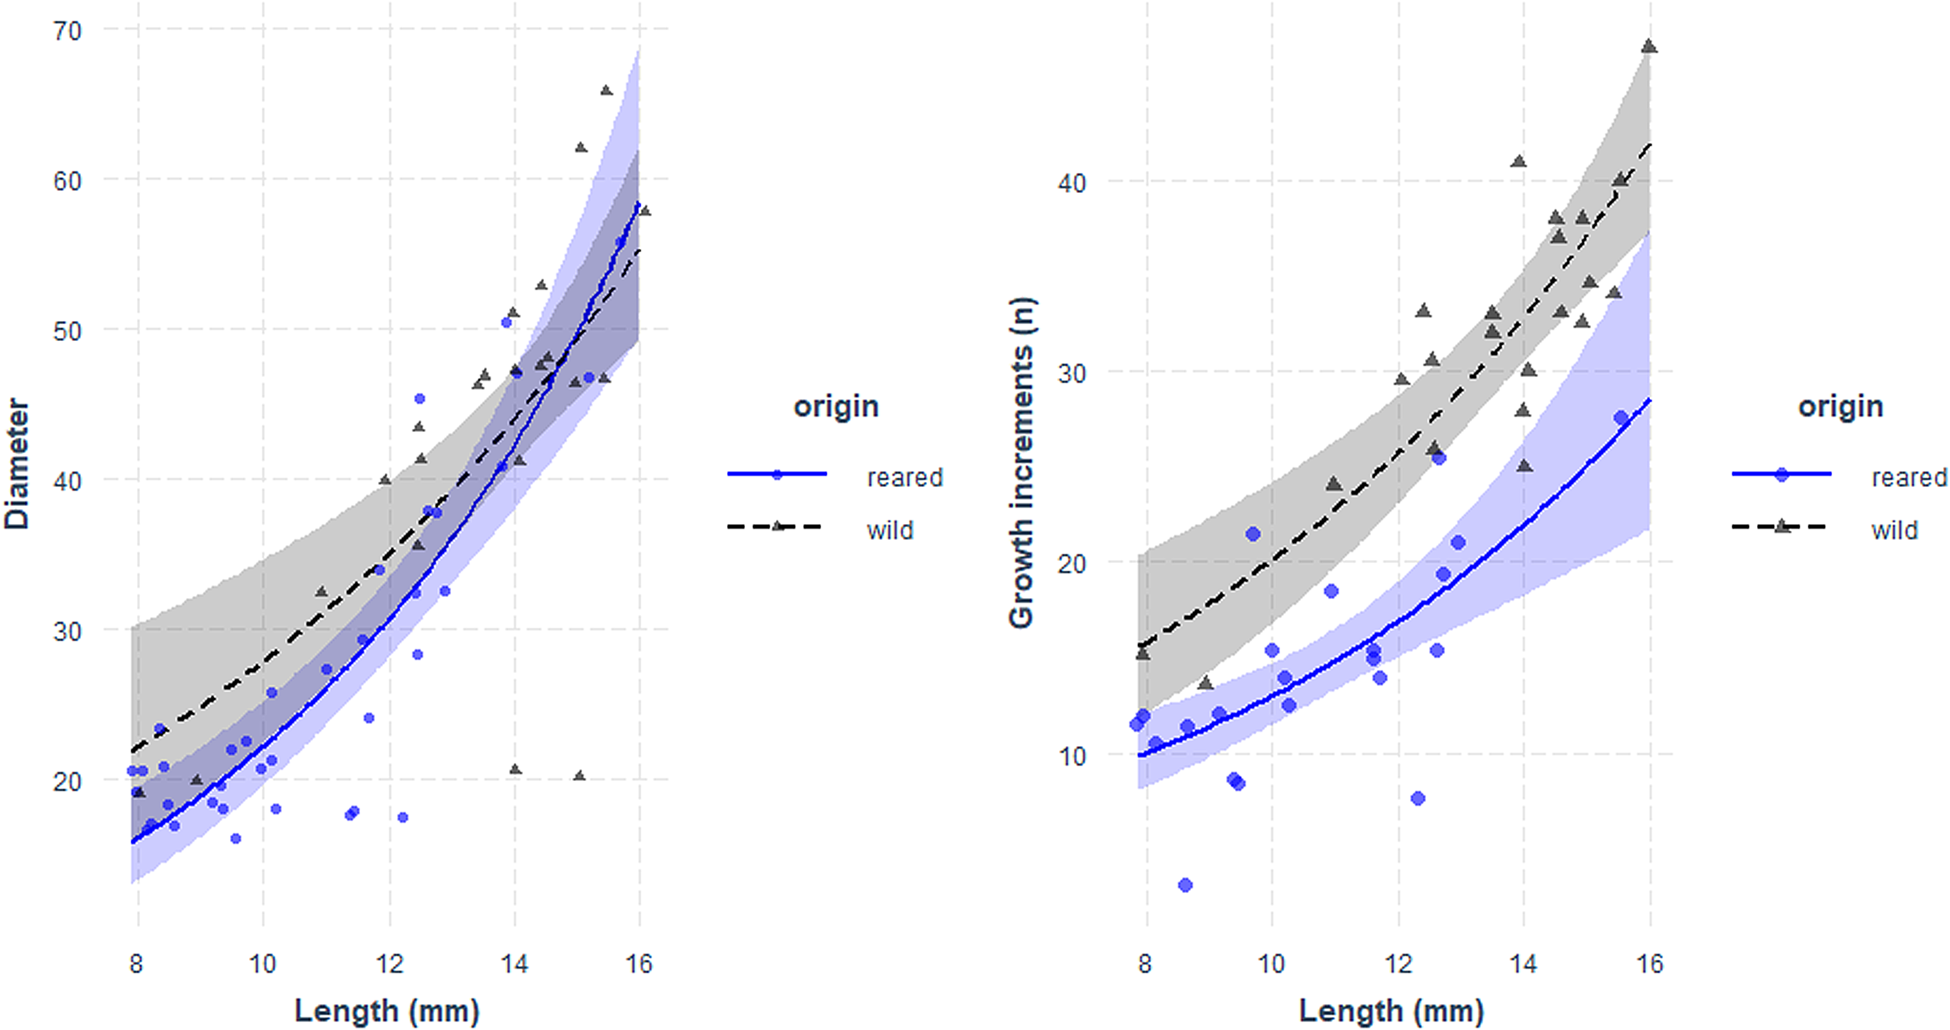
Fig. 5. Relationship between larval length (mm) and otolith diameter (μm, left panel) and number of growth increments (right panel) of sardine larvae reared with food in the laboratory (blue) and caught at sea (black). Parameters of the regression in Table 5.
Comparison of otolith microstructure between laboratory-reared and field-caught larvae
Otolith microstructure of laboratory-reared and field-caught larvae of the same length range (7.8–22 mm) was compared. For this size range, there were no significant differences of the regression between OD and larval size for field and lab-reared larvae (Figure 5, Table 5).
Table 5. Estimated regression parameters, standard errors, t-values and P-values for the GLMs of the relation between Diameter (μm) and Age (dph) (Gaussian, log-link) and daily growth increments (number) and Age (μm) (QuasiPoisson) for Sardina pilchardus larvae reared in the laboratory and collected in the wild
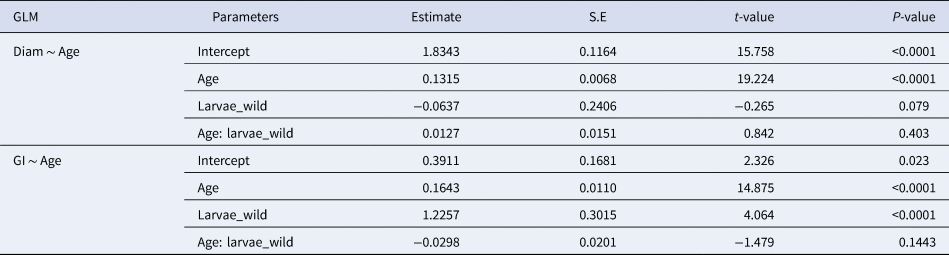
There were no significant differences between the slopes of the regression of GI and size between larvae reared in the laboratory and caught at sea, although the intercept was significantly higher for wild larvae (Figure 5, Table 5).
Discussion
This work intended to validate the daily increment deposition in sardine larvae sagittae otoliths microstructure using different feeding regimes. Most studies on clupeoid fishes assume that the first otolith increment is laid down when the yolk sac is absorbed or when exogenous feeding begins (e.g. Brothers et al., Reference Brothers, Mathews and Lasker1976; Ré, Reference Ré1984, Reference Ré1986; Campana & Neilson, Reference Campana and Neilson1985; Hayashi et al., Reference Hayashi, Yamashita, Kawaguchi and Ishii1989). The present study shows the first increment was deposited at hatching, with a 10.49 μm (± 1.05 SD) diameter, agreeing with Alemany & Álvarez (Reference Alemany and Álvarez1994) that showed a first increment was formed on the otoliths of reared and wild-caught sardine larvae at hatching. This study also shows that the mean distance from the nucleus to the first check did not vary with age and diet, similarly to the results reported for Clupea harengus larvae (Fey, Reference Fey2000; Feet et al., Reference Feet, Ugland and Moksness2002) and for Salmo gairdneri and Platichthys stellatus juveniles (Campana, Reference Campana1983). Some embryonic increments were found on small larvae, as observed by Alemany & Álvarez (Reference Alemany and Álvarez1994) and Dulčić (Reference Dulčić1995) in sardine larvae and Aldanondo et al. (Reference Aldanondo, Cotano, Etxebeste, Irigoien, Alvarez, de Murguía and Herrero2008) in anchovy larvae, which can result in an age overestimation for these small larvae. However, these increments were only visible for larvae <4 dph.
The formation of increments visible using light microscopy depended on the ontogeny, and on the resolution of the microscope used, even when using the same magnification. Daily increment formation was not confirmed with two different microscopes when the period from 0–30 dph was considered, particularly because of the first weeks after hatching. In fact, visible increment formation was particularly low for the first 15 dph, when the increment count was similar between larvae reared with the four feeding treatments. For those first weeks after hatching, otolith diameter of sardine larvae grew at a low rate of 0.2 μm day−1. After that period, increment formation was not significantly different between larvae grown with intermediate and high concentration diets and for the high resolution microscope the confidence interval of the slope from age 15–35 days ranged between 0.999 and 1.002, overlapping the 1:1 relationship and validating the daily formation of increments after the first two weeks after hatching. However, the variability of growth and consequently increment count even within larvae reared with high food concentrations was very high. The daily periodicity of increment formation in the otoliths of fed sardine larvae was confirmed for the whole experimental period when analysing the otoliths of fed larvae by scanning electronic microscopy (SEM). This technique allowed the identification of very narrow increment widths. A total of 80.39% of the increment widths were below 0.5 μm, which is the average resolution of the microscopes used to age larvae based on otolith microstructure and some increments had widths around 0.3–0.2 μm, undetected in light microscopes. Although these increments can only be detected with SEM, this technique is too expensive to be done routinely (Campana et al., Reference Campana, Cagne and Munro1987), and otoliths are significantly harder to prepare for this analysis. We were able to efficiently prepare and analyse three otoliths of larvae reared with a high concentration diet with SEM, after a large number of frustrated attempts, either because the otolith was lost when trying to remove it from the Depex, at grinding, due to being under- or over-ground, and also due to inappropriate etching that varies according to otolith size.
Previous laboratory experiments have shown that sardine larvae are poor swimmers before 20 dph and cannot effectively pursue and capture motile prey such as copepod nauplii before that age (Caldeira et al., Reference Caldeira, Santos, Ré, Peck, Saiz and Garrido2014; Silva et al., Reference Silva, Faria, Teodósio and Garrido2014). This explains why the difference of growth rate and increment count was small or not significant between the low, intermediate and high concentration diets, since larvae were exclusively depending on rotifers, given ad libitum for first-feeding larvae. The increase in the swimming abilities of sardine larvae matches the timing of the notochord flexion at 20 days post hatch (Silva et al., Reference Silva, Faria, Teodósio and Garrido2014; Garrido et al., Reference Garrido, Cristóvão, Caldeira, Ben-Hamadou, Saiz, Peck, Ré and Santos2016), coinciding with the beginning of the caudal fin formation and development of swim bladder (Santos et al., Reference Santos, Chícharo, Dos Santos, Moita, Oliveira, Peliz and Ré2007; Garrido et al., Reference Garrido, Cristóvão, Caldeira, Ben-Hamadou, Saiz, Peck, Ré and Santos2016). In fact, sardine larvae >20 dph (>10.1 mm TL) have a significantly higher number of prey attacks than smaller larvae (Caldeira et al., Reference Caldeira, Santos, Ré, Peck, Saiz and Garrido2014), and being more active, means having a higher probability of encountering prey (Munk & Kiørboe, Reference Munk and Kiørboe1985). The effect of the gain in swimming abilities on GI formation was previously reported for tilapia larvae (Rosa & Ré, Reference Rosa and Ré1985), suggesting that daily deposition begins from the moment larvae start swimming, which results in increased ingestion rates and higher prey availability. Moreover, extensive examination of the otoliths of wild-caught sardine larvae have shown that near the nucleus, the first 8–10 growth units are comparatively narrower and less intense and only become wider from increment 13 onwards (Santos et al., Reference Santos, Chícharo, Dos Santos, Moita, Oliveira, Peliz and Ré2007). This means that the slow growth of first-feeding larvae and correspondingly of their otoliths during the first weeks after hatch also occurs in the wild, resulting in an underestimation of larval age.
Increment counts lower than 1:1 were also observed for the European anchovy reared in temperatures below 18°C (Aldanondo et al., Reference Aldanondo, Cotano, Etxebeste, Irigoien, Alvarez, de Murguía and Herrero2008) and for this species, daily increment deposition rate was only confirmed in larvae reared under higher temperatures (20.8 and 22.3°C). Anchovies are spring and summer spawners, meaning that spawning generally takes place at temperatures above 18°C, therefore ageing anchovy larvae through otoliths GI probably will not introduce a significant error for most of the larvae caught at sea. Contrarily, sardines mostly spawn during autumn and winter months, and spawning peaks at 15°C off the Iberian coast, which is the temperature used in the present experiments. This means that the error of age estimation through the analysis of the deposition of growth increments can be high for a large number of sardine larvae caught at sea. Thus, the effect of temperature on growth increment formation should be investigated for the temperature range at which sardine spawning generally takes place i.e. 13–17°C (Stratoudakis et al., Reference Stratoudakis, Coombs, de Lanzós, Halliday, Costas, Caneco, Franco, Conway, Santos, Silva and Bernal2007), since similarly to European anchovies (Aldanondo et al., Reference Aldanondo, Cotano, Etxebeste, Irigoien, Alvarez, de Murguía and Herrero2008), increment formation can be significantly influenced by temperature.
The results of this work show how slight differences in the resolution of different inverted microscopes and image analysis systems used can result in large differences of increment counts in the otoliths of sardine larvae. If these were larvae caught at sea whose age was unknown and, as usually done for this species, age was inferred through increment counts, a lower resolution microscope would have overestimated larval growth rate of a 30 dph larvae by 0.12 and 0.37 mm day−1, when using the higher and lower resolution light microscopes, respectively (corresponding to erroneously attributing 16.26 and 23.43 dph to the 30 dph larvae, respectively). Given that the growth rate obtained for fed larvae from 3–30 dph in this work was 0.45 mm day−1, these are important differences that must be taken into account when analysing and comparing growth rates of larvae caught at sea.
The lower resolution of the light microscope may also explain the very low or absent number of increment formation in starving larvae. The limitation of detecting increments in slow-growing larvae was also observed for herring (Clupea harengus) larvae (Feet et al., Reference Feet, Ugland and Moksness2002), where the authors showed that the accuracy of age estimates is significantly lower when otolith growth is <0.8 μm day−1. Non-daily increment formation or underestimated increment counts in larval otoliths, are often found in larvae experiencing sub-optimal growth conditions (e.g. Geffen, Reference Geffen1982; Campana et al., Reference Campana, Cagne and Munro1987; Feet et al., Reference Feet, Ugland and Moksness2002). One hypothesis to explain such slow growth and consequently low increment count for larvae <15 dph would be that the food provided in the laboratory was not sufficient or appropriate to allow a high growth rate of sardine larvae, especially at first feeding. This was also proposed in a previous experiment where sardine larvae were fed lower food concentrations and no increment formation was seen during the exogenous first-feeding period (4–12 dph) and increment width of those formed from hatch to 4 dph was >0.5 μm (Miranda et al., Reference Miranda, Sánchez, Iglesias, Álvarez and Alemany1992). Although these experiments were not performed under mesocosm conditions, as suggested by Geffen (Reference Geffen1992), larvae at both high and intermediate diets were in good nutritional condition (Moyano et al., Reference Moyano, Garrido, Chícharo and Peck2014), showed active swimming behaviour (Silva et al., Reference Silva, Faria, Teodósio and Garrido2014) and had high growth rates, similar to those reported for sardine larvae caught in Portuguese estuaries (Ré, Reference Ré1983a; Chícharo et al., Reference Chícharo, Amaral, Faria, Morais, Mendes, Piló, Ben-Hamadou and Chícharo2012) at similar water temperatures (14–15°C). Therefore, we assume that sardine larvae were reared under conditions described by Geffen (Reference Geffen1992) to guarantee proper growth and development. Moreover, sardine larvae growth rates obtained for well-fed larvae in these experiments were significantly higher than those reported for sardines growing with wild plankton in the laboratory (Blaxter, Reference Blaxter1969), growing on average 2.5 mm more at age 30 dph. By analysing the width of increment formation in the higher resolution inverted microscope and with SEM, we were in fact able to confirm that wild-caught larvae have very narrow increments, frequently below 0.5 μm, undetected in the traditional inverted microscope, that are similar to those present in laboratory-reared fed larvae. This suggests that several studies conducted in wild sardine larvae could have underestimated larval age, and consequently overestimated larval growth rate. Therefore, we recommend that in future studies, a microscopy of high resolution (at least 0.4 μm resolution) should be used to age sardine larvae. This can be tested by measuring the increment width in the otoliths of sardine larvae growing with rates similar to the present study and identifying the minimum visible distance. According to the present study, even when using high resolution inverted microscopy, an error of up to 20% is expected to occur when ageing 40 dph larvae at 15°C and with similar growth rates. Nevertheless, slow growers found in the laboratory are unlikely to survive in the wild due to growth-selective mortality (Garrido et al., Reference Garrido, Ben-Hamadou, Santos, Ferreira, Teodósio, Cotano, Irigoien, Peck and Ré2015); it is likely that, on average, growth rates of wild larvae are higher than those found in the laboratory and therefore the error of ageing sardine larvae is significantly lower than 20%.
Conclusions
In conclusion, these results indicate that age estimates of sardine larvae derived from the analysis of otolith microstructure are probably underestimated, particularly during the slow-growing, first-feeding days after hatch. It was shown that the period from the start of the endogenous feeding (≥4 dph) to 15 dph corresponds to slow growth, low increase of otolith diameter and a significantly lower increment count than after that age to 30 dph. Finally, the use of two different microscopies with slight differences in their resolution resulted in significant differences in the number of increments counted, and this must be taken into account in future works and for comparisons of the results from different studies.
Supplementary material
The supplementary material for this article can be found at https://doi.org/10.1017/S0025315421000497
Acknowledgements
This work was supported by Fundação para a Ciência e Tecnologia (FCT) as part of the projects VITAL (Vital rates of pelagic fish larvae PTDC/MAR/111304/2009), project MODELA (PTDC/MAR/098643/2008), MARE – UID/MAR/04292/2013 and CCMAR/Multi/04326/2019 and by MAR2020 (Project SARDINHA2020). The authors thank Mestre P. Leitão and his crew (‘Mestre Comboio’) and H. Delgado and S. Farinha (ANOPCERCO). The authors thank H. Batista (ODL), C. Caldeira and A. R. Cristovão (Project VITAL) for larvae and prey rearing and E. Saiz for help with prey culturing. We are in debt to Alexandra D. Silva and the Phytoplankton Laboratory (IPMA) for assistance in the SEM analysis.
Ethical standards
All applicable international, national, and/or institutional guidelines for the care and use of animals were followed.