


Introduction
Integrative approaches help to unravel the diversification of the marine biota. In this context, phylogeographic inferences have been used for a better understanding of the time of origin and historical kinship of taxa and their distribution over geographic areas (Avise, Reference Avise2009). However, the time of origin remains elusive for most lineages, due to the impossibility to infer calibrated substitution rates. Therefore, most phylogeographic studies on scyphozoan jellyfishes have not estimated dates for evolutionary events (Dawson & Jacobs, Reference Dawson and Jacobs2001; Schroth et al., Reference Schroth, Jarms, Streit and Schierwater2002; Holland et al., Reference Holland, Dawson, Crow and Hofmann2004; Dawson et al., Reference Dawson, Gupta and England2005) and, consequently, there is no evidence regarding the timing of population splits for this group.
A previous phylogeographic study of the medusozoan Pelagia noctiluca (Forsskål, 1775) based on cytochrome c oxidase subunit 1 (COI) sequences depicted two clades (Clade I and Clade II) with no genetic structure between Atlantic (Atl) and Mediterranean (Med) populations (Stopar et al., Reference Stopar, Ramšak, Trontelj and Malej2010). Stopar et al. (Reference Stopar, Ramšak, Trontelj and Malej2010) suggested that this phylogenetic pattern was the result of a historical split between the Atl and Med followed by an admixture. This scenario was based on the observation that Clade I was almost evenly composed by haplotypes from different localities of Atl and Med, and that Clade II mostly consisted of haplotypes recorded in the Med (Stopar et al., Reference Stopar, Ramšak, Trontelj and Malej2010). In fact, biogeographic events that temporarily isolated Atl and Med populations by affecting water connections between both basins have been extensively proposed to explain phylogeographic patterns of several species (Emig & Geistdoerfer, Reference Emig and Geistdoerfer2004; Patarnello et al., Reference Patarnello, Volckaert and Castilho2007; Catarino et al., Reference Catarino, Knutsen, Veríssimo, Olsen, Jorde, Menezes, Sannæs, Stanković, Company, Neat, Danovaro, Dell'Anno, Rochowski and Stefanni2015, Reference Catarino, Stanković, Menzes and Stefanni2017). The two main events most commonly used as an explanation for such an isolation scenario are the northern hemisphere glaciations (NHG) that lasted from the Late Pliocene (~3.2 Ma) until the Pleistocene, and the Messinian salinity crisis (MSC) of the Late Miocene, from ~6–5.5 Ma.
Alternatively, we can consider that Clades I and II did not result from a biogeographic event; instead, they could have been the consequence of an interspecific lineage sorting process. Stopar et al. (Reference Stopar, Ramšak, Trontelj and Malej2010) could not determine whether or not a biogeographic event associated with the NHG or the MSC had produced this structure since they could not obtain a dating for the separation between Clades I and II, due to the lack of reliable calibrated substitution rates for scyphozoans. Furthermore, the lack of a molecular clock also limits dating the splitting time between the P. noctiluca populations from the Atl and Med and other related species (Miller et al., Reference Miller, von der Hayden and Gibbons2012; Piraino et al., Reference Piraino, Aglieri, Martell, Mazzoldi, Melli, Milisenda, Scorrano and Boero2014; Avian et al., Reference Avian, Ramšak, Tirelli, D'Ambra and Malej2016).
Substitution rates can be calibrated with fossil data. Reliable medusozoan fossil records, however, date from the Mid-Cambrian to the Jurassic, and more recent fossils are unknown (cf. Cartwright et al., Reference Cartwright, Halgedahl, Hendricks, Jarrard, Marques, Collins and Lieberman2007; Young & Hagadorn, Reference Young and Hagadorn2010; van Iten et al., Reference Van Iten, Marques, Leme, Pacheco and Simões2014, Reference Van Iten, Leme, Pacheco, Simões, Fairchild, Rodrigues, Galante, Boggiani, Marques, Goffredo and Dubinsky2016 – but see Van Iten et al., Reference Van Iten, Leme, Marques and Simões2013). Alternatively, we adopted in this study a geological event, the closure of the Central American Seaway (CAS) due to the rise of the Isthmus of Panama (IP), as a landmark to calibrate evolutionary rates. This event has been extensively employed to calibrate evolutionary rates for other taxa between the Atlantic and the Pacific Oceans (Lessios, Reference Lessios1979; Vawter et al., Reference Vawter, Rosenblatt and Gorman1980; Bermingham & Lessios, Reference Bermingham and Lessios1993; McCartney et al., Reference McCartney, Keller and Lessios2000). We were able to calibrate with the CAS closure because we collected a population of P. noctiluca along the coast of the Eastern Pacific Ocean (EPO), in Costa Rica.
In this study, we identified and studied a Pacific-Atlantic (Pac-Atl) population genetic break in P. noctiluca by using sequence segments from mitochondrial DNA (mtDNA) (COI and 16S ribosomal RNA – 16S) and a partial sequence from nuclear genes (a segment from the 18S ribosomal RNA – 18S; the complete internal transcribed spacer 1 – ITS1; and a segment from the 5.8S ribosomal RNA – 5.8S). Our first goal was to calibrate the substitution rate for COI, taking into account the final CAS closure and using new data from the EPO population, to assess the time of origin of Clade I and Clade II. Then, we used our calibrated substitution rate to estimate the population demographic history with a Bayesian Skyline Plot (BSP) approach.
Materials and methods
Sampling and species identification
All necessary permits were obtained for the described field studies (permit numbers for collecting: 10186 and 19936 SINAC/Sistema Nacional de Áreas de Conservación del Ministerio de Ambiente y Energía). Fifteen ephyrae were collected with a 200 µm mesh plankton net in EPO (Figure 1). Their identification as P. noctiluca was confirmed by microscopic observation of morphological characters (da Silveira & Morandini, Reference da Silveira and Morandini1997; Tronolone et al., Reference Tronolone, Morandini and Migotto2002; Straehler-Pohl & Jarms, Reference Straehler-Pohl and Jarms2010) and by molecular analyses segments of COI, 16S, 18S + ITS1 + 5.8S (hereafter named ITS1) DNA markers. The ephyrae were preserved in absolute ethanol and then stored at −20°C until genomic DNA extractions were performed. In addition to the original dataset from Stopar et al. (Reference Stopar, Ramšak, Trontelj and Malej2010), adult specimens collected in the coastal waters of Israel (N = 4) and nearby Mallorca, Spain (N = 10) were included in our analyses to expand the 16S dataset (Table S1).

Fig. 1. Approximate geographic location of Pelagia samples used in this study; samples belonging to each location are listed in Table S1.
DNA extraction and sequencing
Genomic DNA was extracted from individual ephyrae (<2 mm in diameter) using Instagene™ (Bio-Rad, Hercules, CA, USA) or from adult tissue samples with the E.Z.N.A.® Mollusc DNA Kit (Omega Bio-tek, GA, USA) and Kapa Express Extract (Kapa Biosystems, MA, USA). Primers from Cunningham & Buss (Reference Cunningham and Buss1993), Folmer et al. (Reference Folmer, Black, Hoeh, Lutz and Vrijenhoek1994) and Schroth et al. (Reference Schroth, Jarms, Streit and Schierwater2002) were used for amplification and sequencing of 16S, COI and ITS1, respectively. Amplification was performed in 25 µl total volume using Illustra PuReTaq Ready-To-Go™ PCR Beads (GE Healthcare, Fairfield, CT, USA) or KAPA HiFi HotStart Polymerase (KAPA Biosystems, MA, USA). DNA segments were amplified in 35 cycles, at 56°C annealing temperature during 42″ for 16S, and 48°C during 60″ for COI and ITS1. PCR products were cleaned up with the Illustra™ GFX™ column kit (GE Healthcare, Fairfield, CT, USA).
Products were sequenced in both directions using the Big Dye® Terminator, version 3.1, Cycle Sequencing Kit (Applied Biosystems, Foster City, CA, USA), and then read in an ABI PRISM® 3100 sequencer or sequenced by Macrogen Europe (Amsterdam, the Netherlands). Contigs were assembled and edited using CodonCode Aligner version 4 (CodonCode Corporation, Dedham, MA, USA) or with ChromasPro (Technelysium Pty Ltd, QLD, Australia). The correctness of the COI nucleic acid alignment was verified at the amino acid level, using the mtDNA genetic code of Coelenterata available at Geneious version 5.5.7 (Drummond et al., Reference Drummond, Ashton, Buxton, Cheung and Cooper2010). Sequence identity was checked using Basic Local Alignment Search Tool (BLAST; http://blast.ncbi.nlm.nih.gov/Blast.cgi) available in GenBank (655 bp of COI, 391 bp of ITS1 and 602 bp of 16S). The sequences were deposited in GenBank (Table S1).
Phylogenetic inference and divergence date estimation
The COI and ITS1 were the most sampled markers in previous studies (Ortman et al., Reference Ortman, Bucklin, Pages and Youngbluth2010; Stopar et al., Reference Stopar, Ramšak, Trontelj and Malej2010; Miller et al., Reference Miller, von der Hayden and Gibbons2012; Piraino et al., Reference Piraino, Aglieri, Martell, Mazzoldi, Melli, Milisenda, Scorrano and Boero2014; Avian et al., Reference Avian, Ramšak, Tirelli, D'Ambra and Malej2016), allowing us to compile a suitable and reasonable number of sequences to perform phylogenetic and population genetic analyses for P. noctiluca. Thus, the new sequences of EPO (Table S1) were aligned with other conspecific sequences retrieved from GenBank using MAFFT version 7 (Katoh et al., Reference Katoh, Kuma, Toh and Miyata2005) and checked by eye with the AliView alignment editor (Larsson, Reference Larsson2014). Our datasets included P. noctiluca specimens from the EPO, Western Mediterranean (WM), Eastern Mediterranean (EM) and Adriatic (AD) (all specimens from the Mediterranean Sea referred to as Med); North Central Atlantic (NA), North-eastern Atlantic (NEA) and North-western Atlantic (NWA) (all specimens from the North Atlantic Ocean referred to as Atl; all specimens from both the Atlantic Ocean and Mediterranean Sea referred to as Atl-Med) (Table 1).
Table 1. Number of COI and ITS1 sequences of Pelagia noctiluca analysed per geographic region

NWA, North-western Atlantic Ocean; NA, North Central Atlantic – Azores Islands; NEA, North-eastern Atlantic Ocean; WM, Western Mediterranean Sea; EM, Eastern Mediterranean Sea; AD, Adriatic Sea; SEA, South-eastern Atlantic Ocean; IO, Indian Ocean; SWP, coast of West Papua, South-western Pacific Ocean; EPO, coast of Costa Rica, Eastern Pacific Ocean.
a Sequences from Ortman et al. (Reference Ortman, Bucklin, Pages and Youngbluth2010).
b Unpublished sequences from GenBank.
c Sequences from Stopar et al. (Reference Stopar, Ramšak, Trontelj and Malej2010).
d Sequences from this study.
e Sequences from Belinky et al. (Reference Belinky, Szitenberg, Goldfarb, Feldstein, Wörheide, Ilan and Huchon2012).
f Miller et al. (Reference Miller, von der Hayden and Gibbons2012).
g Sequences from Piraino et al. (Reference Piraino, Aglieri, Martell, Mazzoldi, Melli, Milisenda, Scorrano and Boero2014).
Taxonomically unresolved Pelagia specimens of P. noctiluca sensu Miller et al., Reference Miller, von der Hayden and Gibbons2012 from South-eastern Atlantic (SEA), Pelagia cf. panopyra sensu Piraino et al., Reference Piraino, Aglieri, Martell, Mazzoldi, Melli, Milisenda, Scorrano and Boero2014 from South-western Pacific (SWP), and one P. cf. panopyra specimen from Indian Ocean (IO) were included. Finally, sequences from the scyphozoan Cyanea capillata (Linnaeus, 1758) were used as outgroup.
The phylogenetic analyses were conducted on five separate datasets, three for each of the DNA markers (COI, ITS1 and 16S), one concatenating the two markers with the highest number of samples (COI and ITS1), and one concatenating the three markers. While the first four datasets included all available samples, the dataset constructed from all the markers included only samples for which at least the COI and 16S sequences were available. Phylogenetic reconstructions were performed in MrBayes version 3.2.6 (Ronquist et al., Reference Ronquist, Teslenko, van der Mark, Ayres, Darling, Höhna, Larget, Liu, Suchard and Huelsenbeck2012) using the partition schemes and substitution models selected with PartitionFinder2 (Lanfear et al., Reference Lanfear, Frandsen, Wright, Senfeld and Calcott2017) and PhyML version 3 (Guindon et al., Reference Guindon, Dufayard, Lefort, Anisimova, Hordijk and Gascuel2010) and based on the Akaike Information Criterion (AICc; Akaike, Reference Akaike, Petrov and Csaki1973). Calculations were conducted using the BEAGLE library (Ayres et al., Reference Ayres, Darling, Zwickl, Beerli, Holder, Lewis, Huelsenbeck, Ronquist, Swofford, Cummings, Rambaut and Suchard2012) and run on the CIPRES Science Gateway portal version 3.3 (Miller et al., Reference Miller, Pfeiffer and Schwartz2010) in two independent runs and four chains of 20,000,000 generations sampled every 10,000 generations. After verifying convergence and adequate sampling (effective sample size (ESS) >200, topological convergence diagnostic >0.05) with MrBayes and Tracer version 1.6 (Rambaut & Drummond, Reference Rambaut and Drummond2009), a 25% burn-in was applied, and the remaining trees were combined to calculate a majority rule consensus tree (50%) tree, median values of divergence times and posterior probabilities (pp). In addition, the relationships between the COI haplotypes of Pelagia were visualized as haplotype networks constructed using the TCS network approach (Clement et al., Reference Clement, Snell, Walke, Posada and Crandall2002) in the PopART software (Leigh & Bryant, Reference Leigh and Bryant2015).
Molecular clock analysis was performed in BEAST2 version 2.4.6 (Drummond et al., Reference Drummond, Nicholls, Rodrigo and Solomon2002; Bouckaert et al., Reference Bouckaert, Heled, Kühnert, Vaughan, Wu, Xie, Suchard, Rambaut and Drummond2014), using the Yule process (Yule, Reference Yule1925; Gernhard, Reference Gernhard2008), a strict clock, and excluding the outgroup; the substitution model was selected in the same way as for the phylogenetic reconstruction but not considering the codon positions (Table S2). Because the molecular clock was calibrated according to the CAS closure, a hard constraint was given on the monophyly of Clade I + II and a uniform prior spanning 3–2.7 Ma was used for the split between the EPO and Atl-Med representing the proposed dates for the IP closure (Keigwin, Reference Keigwin1982; Duque-Caro, Reference Duque-Caro1990; Coates & Obando, Reference Coates, Obando, Jackson, Budd and Coates1996; Bartoli et al., Reference Bartoli, Sarnthein, Weinelt, Erlenkeuser, Garbe-Schönberg and Lea2005). A 10% burn-in was applied, and the remaining phylograms were combined to calculate a majority rule consensus tree (50%), median values of divergence times and pp.
Population genetic analyses and historical demography
COI and ITS1 sequences of samples from EPO and Atl-Med were used to estimate the number of haplotypes (k), haplotype diversity (Hd), and nucleotide diversity (π) with DnaSP version 5.10 (Librado & Rozas, Reference Librado and Rozas2009). Genetic differentiation between localities and identified phylogroups in the phylogenetic analyses were calculated using pairwise F ST. The genetic structure of geographic areas and within phylogroups were examined by Analysis of Molecular Variance (AMOVA). Differentiation was tested for significance using 10,000 permutations in ARLEQUIN version 3.5 (Excoffier & Lischer, Reference Excoffier and Lischer2010).
To test the population size fluctuations through time, the COI sequences were analysed with two different methods on three datasets, Clade I, Clade II, EPO, while one dataset included sequences belonging to all three clades (Clade I + Clade II, + EPO). First, BSP analysis (Drummond et al., Reference Drummond, Rambaut, Shapiro and Pybus2005) was implemented in BEAST 2 to assess the variation time of effective population size (Ne) for mtDNA. The mtDNA substitution rate estimated from the previous BEAST analysis was employed to calibrate BSP analysis, which was run in three separate runs between 5 × 10⁷ and 2 × 10⁸ generations, depending on the convergence assessed with Tracer version 1.6; a 10% burn-in was applied to the remaining phylograms. Because sample sizes were biased and, consequently, effective sample sizes might be skewed, 10 additional matrices containing 28 random sequences (doubling the minimum size of the EPO samples) belonging to Clade I were constructed and analysed. Second, mismatch distributions (MD; Slatkin & Hudson, Reference Slatkin and Hudson1991) were generated in ARLEQUIN 3.5 and the significance was tested using 1000 permutations. The sum of squared deviations (SSD) and raggedness index (Rag) were used as goodness-of-fit statistics for the observed and expected MD.
Results
Phylogenetic inference and divergence date estimation
Bayesian inference (BI) trees for the COI (Figure 2), concatenated COI + ITS1 (Figure S1) and COI + ITS1 + 16S (Figure S2), and also to some degree the 16S (Figure S3) datasets revealed similar topologies. All four trees resulted in a star-like topology and consistent patterns can be retrieved from them. All haplotypes of the EPO (ephyrae) were grouped into a single clade, nested together with Clade I and Clade II in a more inclusive clade (clade P. noctiluca s. lat.). Sequences of P. cf. panopyra sensu Piraino et al. (Reference Piraino, Aglieri, Martell, Mazzoldi, Melli, Milisenda, Scorrano and Boero2014) from West Papua and P. noctiluca sensu Miller et al. (Reference Miller, von der Hayden and Gibbons2012) from South Africa are quite similar, but they did not form a single clade (SEA + SWP) since they were always basal to P. noctiluca s. lat. Moreover, the COI sequence from P. cf. panopyra of the IO (KM886247) was separated from and basal to all the other Pelagia sequences (Figure 2). The inclusion of new haplotypes did not change the overall phylogenetic pattern within Atl-Med P. noctiluca depicted in a previous study (Stopar et al., Reference Stopar, Ramšak, Trontelj and Malej2010), i.e. Clade I evenly composed by haplotypes from different Atl and Med localities, and Clade II mostly comprised by Med haplotypes. Newly analysed sequences from EM and most from the WM and NWA nested in Clade I, while one sequence from WM and one from NWA (KMB808: Virginia) fell into Clade II. While the above patterns are consistent in all the four analyses, the clade support varied among them. The support for all the clades was high for the COI tree, the most informative marker (Stopar et al., Reference Stopar, Ramšak, Trontelj and Malej2010), and moderate to high for the 16S tree. On the other hand, the support was low for the ITS1 tree. This is an expected result since the ITS1 tree did not reveal any pattern and a frequent haplotype is shared by all major clades (Clade I, Clade II, EPO, SEA + SWP) (cf. Stopar et al., Reference Stopar, Ramšak, Trontelj and Malej2010, data not shown).
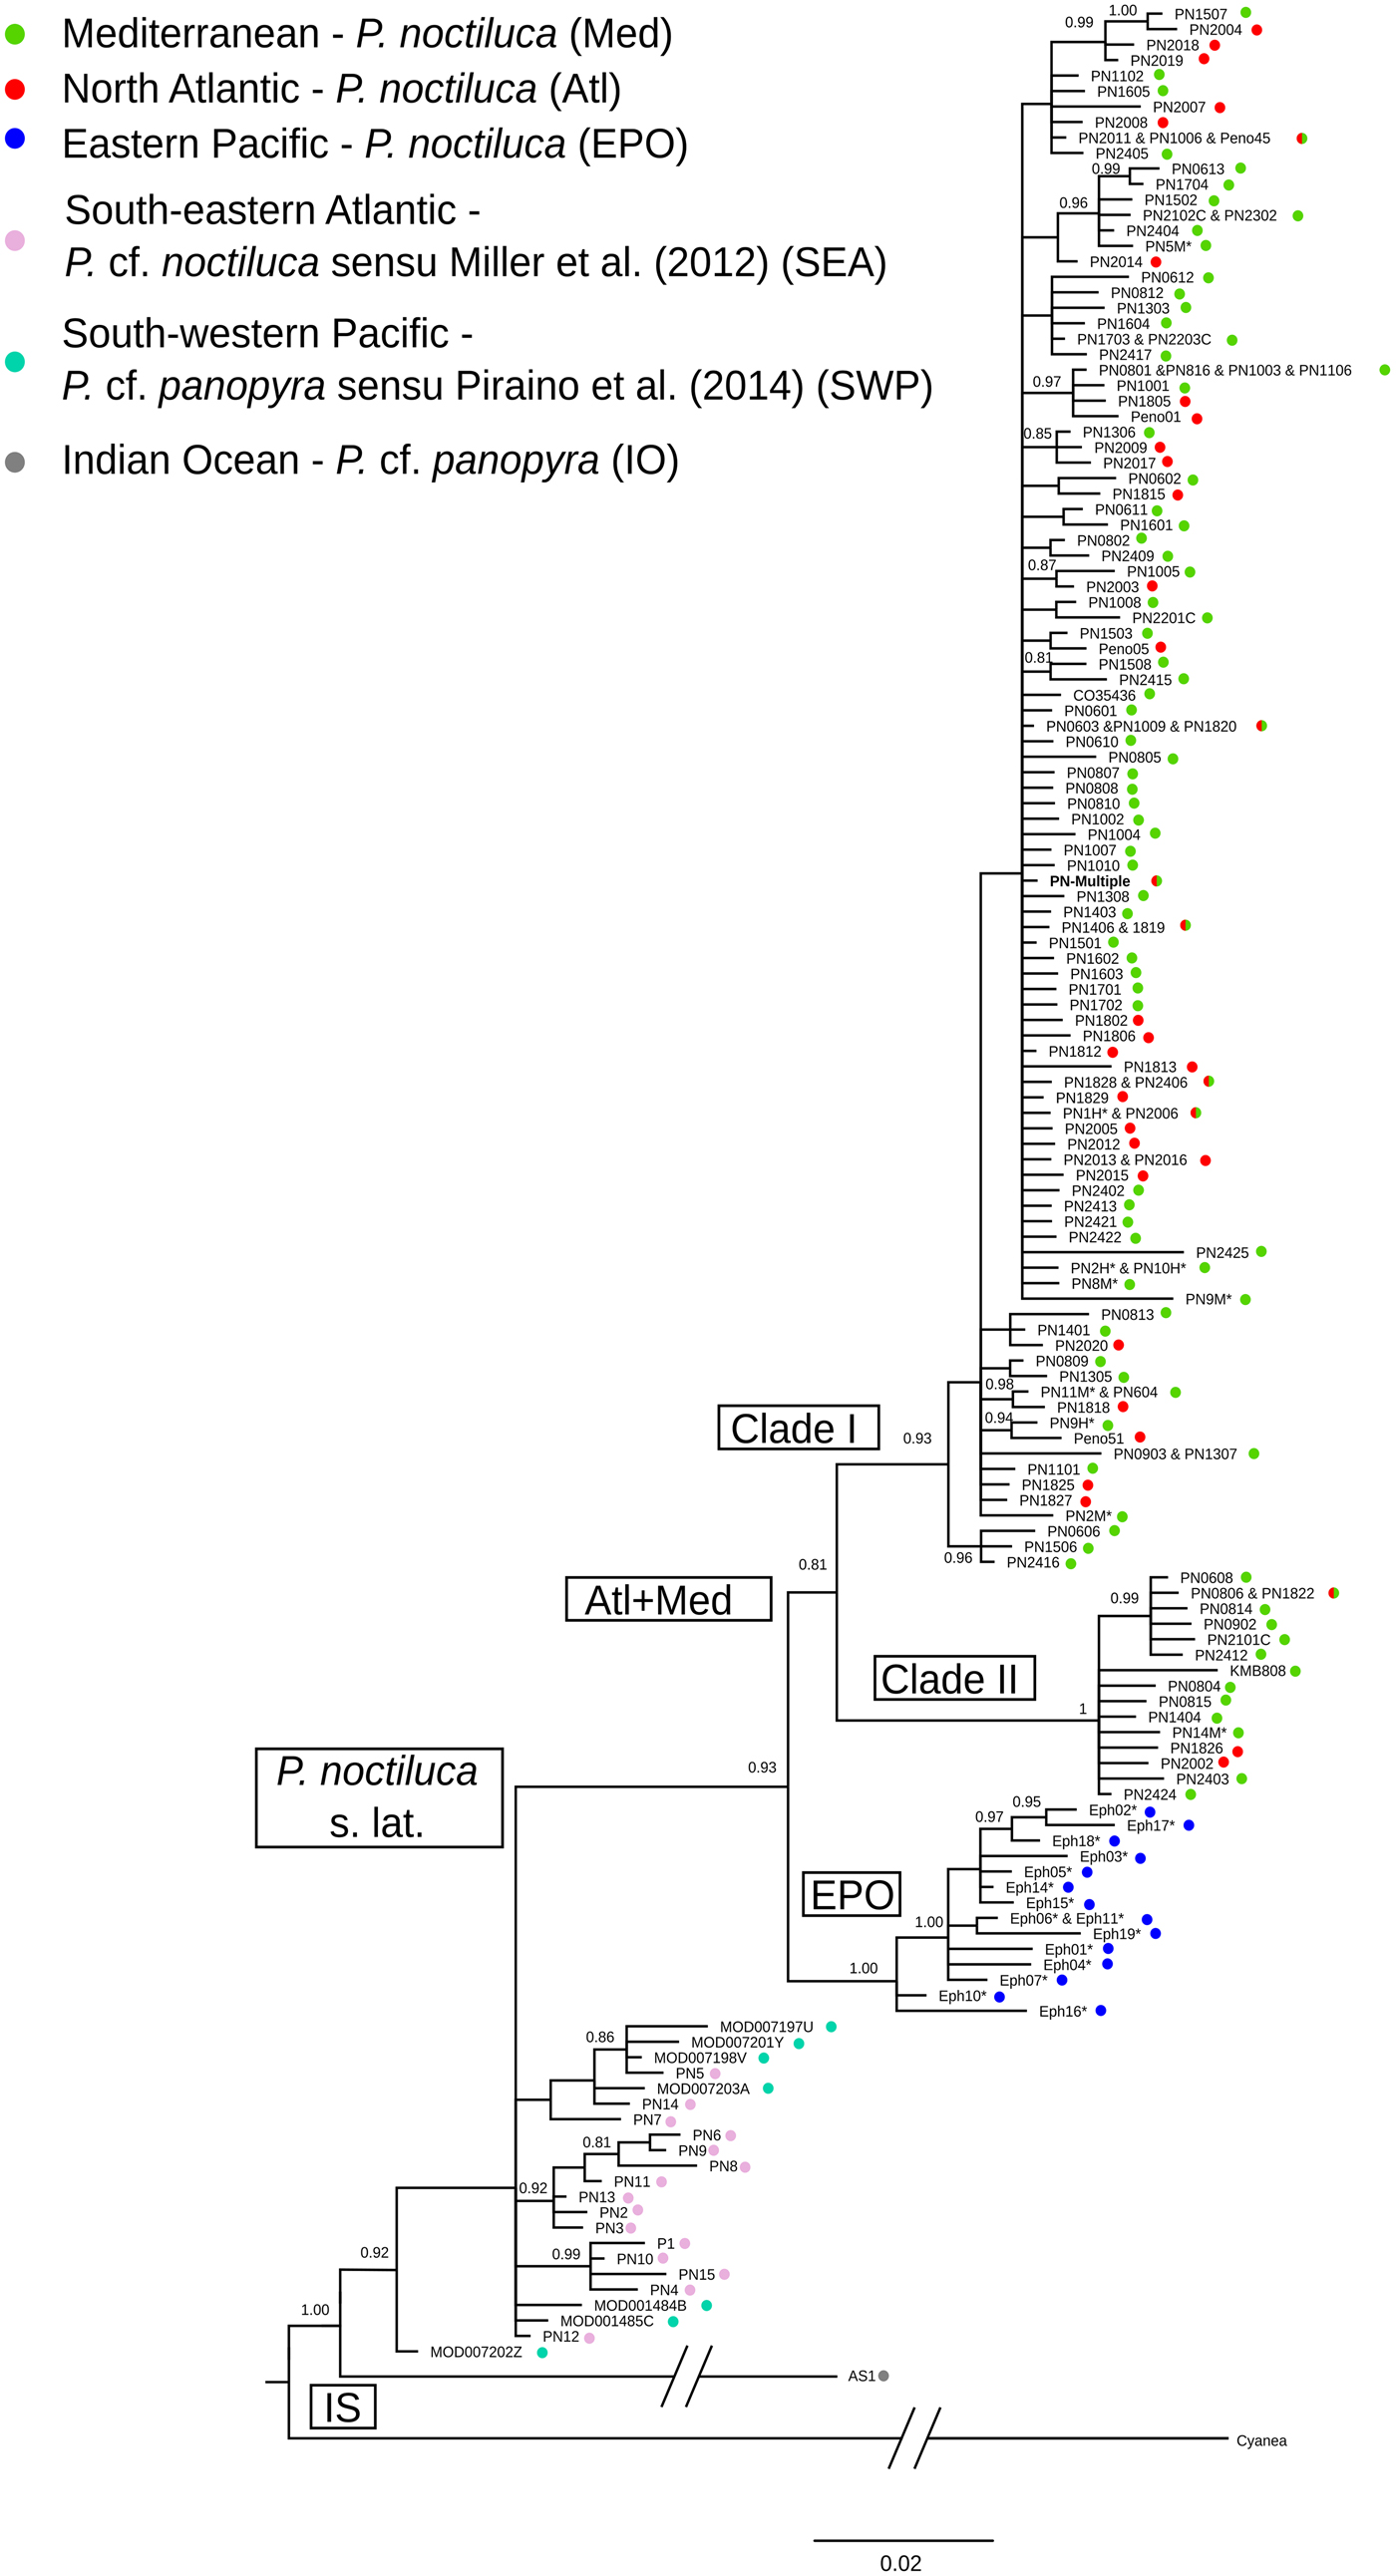
Fig. 2. Bayesian inference phylogeny for COI. Values at branches represent Bayesian posterior probabilities; only values ≥0.8 are shown. Nodes where Bayesian posterior probability was under 0.50 are collapsed. * Samples collected in this study; a list of associated GenBank accession numbers is available in Table S1. PN-Multiple stands for multiple record: PN15 M (new sample), PN0607, PN0609, PN0803, PN0811, PN0901, PN1103, PN1104, PN1105, PN1107, PN1302, PN1309, PN1402, PN1405, PN1504, PN1505, PN1803, PN1804, PN1809, PN1810, PN1814, PN2202C, PN2204C, PN2401, PN2402.
The haplotype network analysis resulted in a similar, clear clustering pattern, with the Atl-Med populations split into Clade I and Clade II and connected haplotypes to EPO and SEA + SWP clustering via two common hypothetical ancestral haplotypes. Here, the samples from the SEA and SWP formed a defined cluster, further connected to the P. cf. panopyra from the IO by hypothetical ancestral haplotypes (Figure 3).

Fig. 3. TCS network of Pelagia COI haplotypes. Black dashes are median vectors presumed unsampled or missing intermediates. Colours denote the major basin; pie proportions denote the number of haplotypes found in a geographic region. SEA; South-eastern Atlantic Ocean; SWP, coast of West Papua, South-western Pacific Ocean; IO, Indian Ocean; EPO, coast of Costa Rica, Eastern Pacific Ocean; Atl, Northeastern Atlantic Ocean; Med, Mediterranean Sea. The circle size is proportional to the haplotype frequencies. The major clades of mitochondrial markers identified by Bayesian inference are presented in the cladogram outline on the right.
The divergence time estimation based on the alignment of Pelagia sequences with a single calibration point (CAS closure for the split between EPO and Atl-Med) yielded a divergence time for Clade I and Clade II of 2.57 Ma with 95% 2.22–2.91 highest probability density (HPD). These estimated dates placed the existence of the common ancestor of the two clades in an early Gelasian or late Piacenzian stage of the Pleistocene (Figure 4). In contrast to the BI tree, P. noctiluca sensu Miller et al. (Reference Miller, von der Hayden and Gibbons2012) from SEA and P. cf. panopyra sensu Piraino et al. (Reference Piraino, Aglieri, Martell, Mazzoldi, Melli, Milisenda, Scorrano and Boero2014) from SWP were clustered into a well-supported clade that diverged from P. noctiluca s. lat. around 4.13 Ma (95% 3.23–4.98 HPD). Meanwhile, the position of P. cf. panopyra from IO was the same as in the BI tree, with the split time from other Pelagia estimated to happen around 10.13 Ma (95% HPD of 6.85–12.35). Diversification within clades happened approximately in the same time frame, most likely in the middle Pleistocene (Figure 4). Estimated substitution rates for COI was 0.0066 per site per million years (95% 0.0049–0.0083 HPD; Table 2).

Fig. 4. Dated phylogeny of Pelagia COI sequences generated using BEAST2. The tree was calibrated using a single event, the CAS closure, for the split between the Pacific and Atlantic populations. 95% HPD intervals are shown as bars at nodes. Median node ages are shown as black node labels and below are the Bayesian posterior probabilities in grey. The scale bar indicates millions of years with the geological ages at the top. Relevant geological events are represented over the time line (black lines under the geological ages), following previous studies (Krijgsman et al., Reference Krijgsman, Hilgen, Raffi, Sierro and Wilson1999; Gibert et al., Reference Gibert, Gibert and Iglesias2003; Bartoli et al., Reference Bartoli, Sarnthein, Weinelt, Erlenkeuser, Garbe-Schönberg and Lea2005; Molnar, Reference Molnar2008; Arribas et al., Reference Arribas, Garrido, Viseras, Soria, Pla, Solano, Garcés, Beamud and Carrio2009; Govers, Reference Govers2009). CAS, Central American Seaway; NHG, northern hemisphere glaciation; IP, Isthmus of Panama; Ma, million years ago.
Table 2. Substitution rates calculated for different marine species and using different mitochondrial markers

Ma, million years ago; Cytb, cytochrome b gene; cont. reg., control region; RM, reciprocal monophyly.
* Significant minimum and maximum posterior probability values for substitution rates, 95% confidence intervals are for 0.006: (0.003–0.009) and for 0.005: (0.002–0.008).
Population genetic analyses and historical demography
Genetic diversity indices estimated for ITS1 were lower than they were for COI (k = 14; Hd = 0.99; π = 0.9) for all populations (Table 3). The estimated genetic diversity of ITS1 was lower than COI for the EPO population but, for both markers, the neutrality tests and mismatch distributions agreed with a population expansion (Table 4, Figure 2). A unimodal MD that is commonly inferred for populations that have undergone expansion (Rogers & Harpending, Reference Rogers and Harpending1992) was observed in all three clades (Clade I, Clade II, EPO). Validity of the estimated stepwise expansion model was also statistically confirmed by the SSD and Rag, which were highest in Clade I (0.0007 and 0.0090, respectively); the null hypothesis of population expansion could not be rejected in any of the clades (P > 0.05; Table 4). Given the estimation of substitution rates, the τ resulting values suggest expansions of the populations to happen before ~0.26 Ma for Clade I, and 0.44 Ma for both EPO and Clade II (Table 4).
Table 3. Genetic diversity indices (COI and ITS1) and mismatch distribution analysis (COI) of Pelagia noctiluca from the Atl-Med (Clade I, Clade II) and from the coast of Costa Rica (EPO)

N, number of sequences; H, number of haplotypes; Hd, haplotype diversity; π, nucleotide diversity; SSD, sum of squared deviation; Rag, Harpending's raggedness index; τ, tau estimator with 95% CI; t, time since population expansion in millions of years with 95% CI.
Table 4. Analysis of molecular variance for alternative groupings between geographic regions and phylogroups of Pelagia noctiluca

EPO, coast of Costa Rica, Eastern Pacific Ocean; WM, Western Mediterranean Sea; EM, Eastern Mediterranean Sea; AD, Adriatic Sea; NA, North Central Atlantic Ocean – Azores Islands; NEA, North-eastern Atlantic Ocean; NWA, North-western Atlantic Ocean; Med, entire Mediterranean Sea; Atl, entire North Atlantic Ocean.
* Indicates significant differences, *P < 0.05, **P < 0.01, ***P < 0.001 (10,000 permutations of significance test).
In the BSP analyses, only Clade I showed a clear pattern of demographic expansion (Figure 5A, B), which was less evident in EPO and almost absent in Clade II (Figure 5C, D). The total evidence analysis suggests that Clade I most likely started growing about 0.4 Ma and ended 0.25 Ma, a period during which Ne grew 6-fold and stabilized around 6 × 10⁶ (Figure 5A). This pattern is mostly corroborated by the reduced dataset (Figure 5B). Population growth likely happened earlier for EPO, with a demographic expansion starting at least 0.4 Ma and Ne stabilizing around 0.35 Ma, when it grew to 3 × 10⁶ (Figure 5C). Population sizes of Clade I and EPO are comparable, however, Clade II had a smaller Ne (slightly above 3 × 10⁵) and a less evident demographic expansion, placed at least about 0.26 Ma (Figure 5D). A large-scale demographic expansion dating somewhere between 0.6 and 0.1 Ma was evident when analysing all clades together (Figure S4).

Fig. 5. The Bayesian skyline plots of samples belonging to Clade I (A, B), Clade II (C) and EPO (D) P. noctiluca populations illustrating the effective population size (Ne) over time under neutral evolution. Pink and blue lines represent 95% higher posterior upper and lower probability and the black line represents the median population size. (A) BSP of Clade I; (B) joint BSP resulting from the random sampling strategy consisted of constructing and analysing 10 matrices with 20 random Clade I sequences (doubling the minimum sample size of the EPO samples); (C) BSP of Clade II; and (D) BSP of EPO.
Genetic structure was detected under different grouping strategies in separate AMOVA analyses for COI and ITS1 (Table 4). We observed significant genetic differentiation between the EPO and the Atl-Med, but groupings in line with geography were not evident. Furthermore, we confirmed significant genetic differentiation between phylogroups when comparing EPO to Clade I + Clade II, but not when comparing EPO to Clade I and Clade II separately (Table 4).
We also found significant differences in pairwise F ST comparisons for COI and ITS1, arranged either by geographic regions (Table 5) or by phylogroups. COI comparisons between geographic regions revealed that EPO was the only geographic region significantly different from all the other regions (Table 5). Comparisons between COI phylogroups also showed that EPO was significantly different from Clade I (F ST = 0.715, P < 0.001) and Clade II (F ST = 0.787, P < 0.001), comparable to the genetic distance between Clade I and Clade II (F ST = 0.772, P < 0.001). Significant differences in F ST comparisons of ITS1 were found between Eastern Mediterranean (EM) and Atlantic Ocean (NA and NEA), F ST = 0.273, P < 0.05 and F ST = 0.302, P < 0.05, respectively.
Table 5. Estimation of population pairwise FST values for COI (below the diagonal) of Pelagia noctiluca between geographic regions and for ITS1 (above the diagonal)

EPO, coast of Costa Rica, Eastern Pacific Ocean; WM, Western Mediterranean Sea; EM, Eastern Mediterranean Sea; AD, Adriatic Sea; NA, North Central Atlantic Ocean– Azores Islands; NEA, North-eastern Atlantic Ocean; Med, entire Mediterranean Sea; Atl, entire North Atlantic Ocean.
* Indicates significant differences, *P < 0.05, **P < 0.01, ***P < 0.001 (10,000 permutations of significance test); / missing data, – not available.
Discussion
The calibrated substitution rate for COI allowed us to estimate an early Pleistocene divergence in P. noctiluca. The calibration was based on the shallow but significant phylogeographic structure between P. noctiluca from EPO and all the other Atl-Med populations. The calibration of the P. noctiluca molecular phylogeny using the CAS closure due to the IP rise (estimated at 3.0–2.7 Ma) resulted in monophyly among EPO, Atlantic and Mediterranean P. noctiluca populations concerning the other investigated pelagiid populations. Using a geological event for the molecular clock calibration and calculation of substitution rates is a conventional approach in phylogenetic studies (cf. other estimates by Waters et al., Reference Waters, Rowe, Apte, King, Wallis, Anderson, Norris, Craw and Burridge2007; Burridge et al., Reference Burridge, Craw, Fletcher and Waters2008).
Estimation of substitution rates also allowed better insights concerning the population demography of P. noctiluca and comparisons between the Atl-Med clades and EPO. Observed differences in the phylogeographic patterns of Clade I, Clade II and EPO also reflected in the patterns of historical demography; BSP and MD support that a recent expansion event likely occurred in all the clades, but their extents vary considerably. In both Clade I and EPO, a large-scale population expansion started ~0.4 Ma, during which the Ne grew multi-fold, until stabilizing at 3 × 10⁶. On the other hand, Clade II revealed only a modest population expansion according to BSP, probably starting about 0.26 Ma, which led to the current 3 × 10⁵ Ne. Approximate times of population expansions were also in general agreement with MD estimations (t = τ/2 u).
Our phylogenetic reconstruction agrees with a previous phylogenetic hypothesis (Piraino et al., Reference Piraino, Aglieri, Martell, Mazzoldi, Melli, Milisenda, Scorrano and Boero2014). Besides, it places the COI sequences of P. cf. panopyra sensu Piraino et al. (Reference Piraino, Aglieri, Martell, Mazzoldi, Melli, Milisenda, Scorrano and Boero2014) from West Papua (SWP) and P. noctiluca sensu Miller et al. (Reference Miller, von der Hayden and Gibbons2012) from South Africa (SEA) in a closely related cluster that is separated from P. noctiluca from Atl-Med and EPO. According to our molecular clock estimation, this clade split during the Zanclean stage of Pliocene at ~4.13 Ma (4.98–3.23 Ma). Such a long time-period suggests that SEA populations should not be considered as belonging to the same species as P. noctiluca from Atl-Med. Thus, it would be more appropriate, if this OTU would be preliminarily designated as P. cf. noctiluca (Figure 4). Finally, we were also able to show that P. cf. panopyra from the IO belongs to a different OTU from the West Papua P. cf. panopyra sensu Piraino et al. (Reference Piraino, Aglieri, Martell, Mazzoldi, Melli, Milisenda, Scorrano and Boero2014). Additionally, we suggest that the IO sample probably split from other pelagiids about 10.13 Ma (12.35–6.85 Ma).
Pelagia noctiluca has frequently been observed in the Atlantic Ocean and the Mediterranean Sea (Goy et al., Reference Goy, Dalot and Morand1989; Baxter et al., Reference Baxter, Walne, Purcell, McAllen and Doyle2010), but its status in the Pacific Ocean was dubious before our findings. This reflected in the differences in distribution and sample sizes of our datasets. Nevertheless, despite differences in the sample size, the EPO population showed genetic diversity indices comparable to those previously reported for Atl-Med populations (Stopar et al., Reference Stopar, Ramšak, Trontelj and Malej2010). We detected the same phylogeographic structure for Clade I and II observed by Stopar et al. (Reference Stopar, Ramšak, Trontelj and Malej2010), with Clade II remaining composed mostly by Med haplotypes, which is in agreement with previous suggestions of its Mediterranean origin (Stopar et al., Reference Stopar, Ramšak, Trontelj and Malej2010). Furthermore, our COI tree was resolved with higher and statistically significant pp for Clade I (0.93) and Clade II (1.00) in comparison to the earlier study (0.76 and 0.78, respectively).
Studies of congeneric trans-isthmian species that differ in rates of genetic divergence across the same geographic barrier can serve as models to explore the usefulness of geological events for calibration of molecular evolution (Knowlton & Weigt, Reference Knowlton and Weigt1998; Marko, Reference Marko2002; Hurt et al., Reference Hurt, Anker and Knowlton2009). Pelagia noctiluca has no known trans-isthmian congeners, but the adequacy of our calibration approach is justified by evidence from other Medusozoa. The shallow phylogenetic structure between EPO and Atl-Med, and the distribution pattern including both coasts of Central America for this species contrasts with COI and ITS1 phylogenetic patterns of other scyphozoans, e.g. the Atlantic-Pacific splits within the Cassiopea spp. (Holland et al., Reference Holland, Dawson, Crow and Hofmann2004) and Aurelia spp. (Dawson & Jacobs, Reference Dawson and Jacobs2001; Schroth et al., Reference Schroth, Jarms, Streit and Schierwater2002). Both Cassiopea and Aurelia have deeper phylogenetic patterns of COI and ITS1, suggesting speciation processes independent of the final CAS closure; furthermore, Atl-Med populations within these genera are paraphyletic. A deep separation, similarly indicating independence with the final CAS closure was also observed with highly structured trans-isthmian samples of the hydromedusa Liriope tetraphylla (Chamisso & Eysenhardt, 1821), another holoplanktonic species that tolerates different environmental conditions (E. Ale and A.C. Marques, unpublished data). A recent divergence between EPO and Atl-Med P. noctiluca populations would be the most parsimonious explanation for the shallow phylogenetic pattern. Additionally, considering that the connection across the Strait of Gibraltar is wide enough to prevent isolation between Atl-Med P. noctiluca populations (Stopar et al., Reference Stopar, Ramšak, Trontelj and Malej2010), we suggest that only a complete closure of the water connection across the CAS could efficiently isolate EPO and Atl populations for more extended periods.
The IP rise is the most recent geological event related to the CAS closure, therefore suitable for calibration. The exact time of the final CAS closure has been controversial (see Molnar, Reference Molnar2008 for further discussions). Palaeoceanographic evidence suggests a gradual process starting ~4.5–4.0 Ma with a shallow water connection between the Pacific and the Atlantic Oceans, extending up to ~3.0 or 2.7 Ma (Bartoli et al., Reference Bartoli, Sarnthein, Weinelt, Erlenkeuser, Garbe-Schönberg and Lea2005; Molnar, Reference Molnar2008). In this context, we used these two last alternative estimated dates of the IP closure for our calibrations. We expect that slight differences in these dates, due to uncertainties associated with any geological date, will not substantially change the estimated time of separation of the two COI clades.
The Mediterranean and Atlantic basins had been isolated from each other several times in the past. The MSC (6–5.5 Ma) was the most important example of this kind of event (Krijgsman et al., Reference Krijgsman, Hilgen, Raffi, Sierro and Wilson1999; Govers, Reference Govers2009), and has frequently been associated with the origin of the Mediterranean fauna (Fredj et al., Reference Fredj, Bellan-Santini and Meinardi1992; Blondel et al., Reference Blondel, Aronson, Bodiou and Boeuf2010). However, our estimate refutes a possible origin of Clades I and II during the MSC crisis, because the likely time of origin for a putative common ancestor of Clades I and II was 2.57 Ma (95% 2.91–2.22 HPD; Figure 4). This time corresponds to the Gelasian stage of the early Pleistocene or the late Piacenzian stage of the Pleistocene when important climatic and oceanic changes occurred (Bartoli et al., Reference Bartoli, Sarnthein, Weinelt, Erlenkeuser, Garbe-Schönberg and Lea2005; Molnar, Reference Molnar2008). Large-scale environmental alterations during the Gelasian included the onset of the NHG with variations in sea level and changes of oceanic currents, including those of the Strait of Gibraltar region (Gibert et al., Reference Gibert, Gibert and Iglesias2003; Arribas et al., Reference Arribas, Garrido, Viseras, Soria, Pla, Solano, Garcés, Beamud and Carrio2009). This barrier would explain the origin of the two P. noctiluca clades in Atl and Med.
A possible origin of Clades I and II during the MSC demands extremely low substitution rates, even lower than the minimum bound of 95% CI of our estimated substitution rate (Figure 5). Although slow substitution rates have been inferred for anthozoans (France & Hoover, Reference France and Hoover2002; Shearer et al., Reference Shearer, Van Oppen, Romano and Wörheide2002; Hebert et al., Reference Hebert, Ratnasingham and de Waard2003), COI evolution in medusozoans is usually faster, and similar to other metazoans (Huang et al., Reference Huang, Meier, Todd and Chou2008; Ortman et al., Reference Ortman, Bucklin, Pages and Youngbluth2010). Rates estimated for COI were slightly lower, but still comparable to those obtained for different metazoan species for COI as well as other mitochondrial genes, using different methodologies and similar vicariant calibration dates (Table 2 and references therein). Besides, faster substitution rates imply more recent dates than those we obtained for the origin of Clades I and II. Faster rates can be achieved when calibrations are made over pedigrees or population splitting processes of less than 1–2 Ma, rather than over phylogenetic, more ancient divergences (Waters et al., Reference Waters, Rowe, Apte, King, Wallis, Anderson, Norris, Craw and Burridge2007; Burridge et al., Reference Burridge, Craw, Fletcher and Waters2008), namely the ‘time dependency of substitution rates’ (Ho et al., Reference Ho, Phillips, Cooper and Drummond2005). Time dependency effects seem not to be an issue for our calculations because the present calibration and hypotheses were on time scales that are not as different as pedigree vs phylogenetic time-scales. Moreover, our estimated substitution rate for COI is conservative enough, in light of its 95% CI (Table 2 and Figure 4).
It is difficult to differentiate whether the effect of the internal coalescences of haplotypes or some biogeographic events were the underlying causes of the phylogenetic patterns detected for Clades I and II. A Messinian biogeographic event is probably the least likely explanation for the phylogenetic structure observed for both clades. On the other hand, the COI star-like topology seems consistent with separation among EPO, Clade I and Clade II, in the same geological time frame. This separation occurred approximately during a period between the NHG beginning and the final IP closure, and not ~2 million years before this period. Additionally, whereas random sorting of haplotypes could generate an internal phylogenetic structure similar to that between Clades I and II, it seems unlikely that Clade II was randomly formed mostly by Mediterranean haplotypes. Recent geological isolation of a Mediterranean population, not necessary concomitantly with the Gibraltar biogeographic barrier, is a plausible explanation. The Mediterranean basin was affected cyclically since the NHG beginning (Patarnello et al., Reference Patarnello, Volckaert and Castilho2007), and even internal regions of this basin, like the Adriatic Sea, were previously suggested to be sites in which isolation of some populations could have occurred (Stopar et al., Reference Stopar, Ramšak, Trontelj and Malej2010). The only shallow difference between ITS 1 was found between Eastern Mediterranean (EM) and Atlantic Ocean (NA and NEA) which is in concordance with previous results and observations stated above (Stopar et al., Reference Stopar, Ramšak, Trontelj and Malej2010). In fact, the lack of structure for the ITS1 dataset can also explain this pattern of more recent isolation, because more time is required for nuclear genes to reach reciprocal monophyly by coalescence in comparison with mitochondrial markers (Moore, Reference Moore1995).
A putative biogeographic separation between the Atlantic and Mediterranean biotas is controversial (Patarnello et al., Reference Patarnello, Volckaert and Castilho2007). Many species show phylogeographic patterns involving cladogenesis, genetic structure and population expansions between the two basins, supposedly as a result of the evolutionary processes that occurred during the Quaternary (Patarnello et al., Reference Patarnello, Volckaert and Castilho2007). However, there are counter-examples of lack of genetic structure, contrasting phylogeographic patterns between closely related species with similar population dynamics and life histories, and lack of calibration of evolutionary rates that pose difficulties on the elucidations of a more detailed biogeographic history (see Patarnello et al., Reference Patarnello, Volckaert and Castilho2007 for further discussions). Our results agree with the Quaternary time frame detected for most of the phylogeographic patterns for the Atl-Med biota (Patarnello et al., Reference Patarnello, Volckaert and Castilho2007). Moreover, the estimated time of origin of Clades I and II coincides with the low sea levels at the Gelasian, favouring the terrestrial fauna interchange between Africa and Europe during the Aquatraversan erosional phase (~2.5 Ma), and the isolation of some marine populations of different species from the Atl and Med basins (Gibert et al., Reference Gibert, Gibert and Iglesias2003; Patarnello et al., Reference Patarnello, Volckaert and Castilho2007; Arribas et al., Reference Arribas, Garrido, Viseras, Soria, Pla, Solano, Garcés, Beamud and Carrio2009). Further studies focusing on demographic patterns could test different evolutionary scenarios for complex phylogeographic patterns, such as abrupt population expansions followed by isolation or ancient divergences followed by introgression (Funk & Omland, Reference Funk and Omland2003). Accordingly, a distinct approach from ours using multilocus analyses can be useful for testing the splitting time calculation between Atl-Med scyphozoan populations. Still, we expect that the substitution rates obtained in this study for COI, a marker extensively used in marine phylogeography, will be a useful prior for further phylogeographic inferences.
In this way, a population approach using multilocus analyses can be useful for the test of the splitting time calculation between Atl-Med scyphozoan populations, a different approach than the one proposed in this work. For these further phylogeographic studies, the substitution rates we have obtained for COI, a marker extensively used in marine phylogeography, can be a useful prior.
Supplementary material
The supplementary material for this article can be found at https://doi.org/10.1017/S0025315419000894.
Acknowledgements
We thank A. Morales Ramírez and J. Cortés Nuñez (University of Costa Rica) for logistical assistance with field trips and laboratory facilities; B.D. Ortman (University of Connecticut) for providing data of his samples from the North-west Atlantic Ocean; A.E. Migotto (University of São Paulo) for support with laboratory facilities; and Florian Reyda (State University of New York College at Oneonta) for corrections of English grammar on an earlier draft.
Financial support
This study was supported by fellowships from Programa de Movilidad en el Posgrado de la Red de Macrouniversidades Públicas de América Latina y el Caribe (Oficio RMU/OBSV/873/09), CAPES and CNPq (Proc. 490348/2006-8, 142128/2008-2, 304720/2009-7, 562143/2010-6, 563106/2010-7, 477156/2011-8, 301039/2013-5, 305805/2013-4, 304961/2016-7), and the São Paulo Research Foundation (FAPESP) (Proc. 2004/09961-4, 2011/50242-5, 2013/50484-4, 2015/21007-9). A. Ramšak was financed by the ARRS (P1-0237 Coastal Sea Research) and by bilateral cooperation between Slovenia and Brazil (agreement BI-BR/10-12-005 and CNPq 490158/2009-9). D. Stanković is a fellow of the MIZŠ (Raziskovalci-2.0-NIB-529025 financed by ERDF) and the ARRS (P1-0237 Coastal Sea Research). This is a contribution of the NP-BioMar, USP.


