


INTRODUCTION
Seagrass meadows are present across the world in temperate and tropical latitudes (Hemminga & Duarte, Reference Hemminga and Duarte2000). The rhizomes, leaves and roots of seagrasses provide different microhabitats for a great diversity of associated organisms (Orth & Heck, Reference Orth and Heck1980; Webster et al., Reference Webster, Rowden and Attrill1998; Attrill et al., Reference Attrill, Strong and Rowden2000) that can also provide shelter and protection from predators (Heck & Thoman, Reference Heck and Thoman1981). Seagrass meadows are areas of high productivity in estuarine and coastal environments (Hemminga & Duarte, Reference Hemminga and Duarte2000). Many organisms feed on the organic matter and detritus resulting from the decomposition and degradation of plant and supporting epiphytes as well as on particles retained among the leaves of seagrasses (Kitting et al., Reference Kitting, Fry and Morgan1984; Fredriksen et al., Reference Fredriksen, Christie and Boström2004; Hily et al., Reference Hily, Connan, Raffin and Wyllie-Echeverria2004). Furthermore, seagrass beds are open systems that may act as nurseries and provide refuge and foraging habitats for fishes and crustaceans (Thayer et al., Reference Thayer, Bjorndal, Ogden, Williams and Zieman1984; Gotceitas et al., Reference Gotceitas, Fraser and Brown1997). The extensive rhizome network of seagrasses contributes to avoid coastal erosion by stabilizing sediments (Davison & Hughes, Reference Davison and Hughes1998).
Anthropogenic activities in coastal areas, such as dredging, construction of artificial structures and bottom trawling, are having a negative impact on seagrass meadows, which are being reduced in their extent or, in many cases, are completely disappearing from many areas (Sheridan, Reference Sheridan2004; Waycott et al., Reference Waycott, Duarte, Carruthers, Orth, Dennison, Olyarnik, Calladine, Fourqurean, Heck, Hughes, Kendrick, Kenworthy, Short and Williams2009). Loss and fragmentation of seagrass meadows can have important consequences for maintenance of biodiversity and productivity of coastal waters (Orth et al., Reference Orth, Heck and Van Montfrans1984, Reference Orth, Carruthers, Dennison, Duarte, Fourqurean, Heck, Hughes, Kendrick, Kenworthy, Olyarnik, Short, Waycott and Williams2006; Rueda et al., Reference Rueda, Marina, Urra and Salas2009b). Thus, there is a need to study and protect these important habitats.
Seagrass beds of Zostera marina L. and Zostera noltei Hornemann are a major feature of estuaries and shallow coastal areas in the northern hemisphere (Duffy & Harvilicz, Reference Duffy and Harvilicz2001). On the Atlantic Coast of Spain, Z. marina and Z. noltei are mostly present along the Galician coast (north-western Spain), forming extensive meadows in intertidal and shallow subtidal areas (Laborda et al., Reference Laborda, Cimadevilla, Capdevila and García1997). Because of their importance seagrass meadows are protected through the ‘Habitat’ directive 92/43/CEE. However, studies on their associated macrofaunal assemblages along the Galician coast have been scarce (Currás & Mora, Reference Currás and Mora1990; Currás et al., Reference Currás, Sánchez-Mata and Mora1993; Junoy, Reference Junoy1996; Esquete et al., Reference Esquete, Moreira and Troncoso2011).
Molluscs are important components of benthic marine fauna, both in abundance and species richness (Lewis & Stoner, Reference Lewis and Stoner1983; Snelgrove, Reference Snelgrove1998; Webster et al., Reference Webster, Rowden and Attrill1998). Seagrass meadows house a large diversity of molluscs (Heminga & Duarte, Reference Hemminga and Duarte2000; Rueda & Salas, Reference Rueda and Salas2008) which can numerically dominate these habitats (Boström & Bonsdorff, Reference Boström and Bonsdorff1997). For example, large densities of some epifaunal grazing gastropods, such as hydrobiids were recorded in Zostera beds (Currás & Mora, Reference Currás and Mora1990) and the abundance of their populations may be explained by their relation to the presence of seagrass (Cardoso et al., Reference Cardoso, Pardal, Lillebo, Ferreira, Raffaeli and Marques2004).
The main objectives of this paper are to: (1) describe the composition and abundance of molluscan fauna in the extensive Z. marina and Z. noltei beds of the Ensenada de O Grove (Galicia, north-western Spain); (2) study the spatial distribution of the molluscs within Z. marina and Z. noltei beds; and (3) identify the main environmental variables that explain the observed patterns of distribution and diversity.
The benthic fauna of this inlet have not been extensively studied and therefore this paper represents the first quantitative survey on the molluscs associated with seagrass beds in the Ensenada de O Grove and it may provide baseline data for management and preservation of the aforementioned seagrass beds.
MATERIALS AND METHODS
Study area
The Ensenada de O Grove is located in the inner part of the Ría de Arousa (Galicia, north-western Spain) between 42°41′N–42°28′N and 9°01′W–8°44′W (Figure 1). This inlet with an area of 15 km2 is sheltered from wave action and dominant winds due to the presence of the Peninsula de O Grove in the mouth. The Ensenada de O Grove is influenced by freshwater inputs from rivers in the mouth and inner part and its soft-bottoms are mostly intertidal or shallow subtidal (<20 m) with large areas colonized by the seagrasses Z. marina and Z. noltei. This inlet has a great socio-economic importance, especially with regard to mussel culture on rafts, bivalve collection and fishing. This inlet of high ecological value and international importance is protected through the current legislation due to the presence of Zostera beds (Habitat Directive, Directive 92/43/CEE) and its ecological value for birds (ZEPAS, 1979 and RAMSAR Convention, 1990). In addition, this inlet has been included as a natural space of importance for the European Community and listed in the ‘European Nature Net 2000’.

Fig. 1. Map of the Ensenada de O Grove (Galicia, Spain) showing the location of sampling sites with seagrasses.
Sample collection
The present study was carried out in the soft bottoms colonized by Z. marina and Z. noltei located in the inner part of the Ensenada de O Grove. It was included in a broader cartography of the benthic fauna associated with the soft bottoms of the inlet. A total of 10 sites were quantitatively sampled during October and November 1996 with a Van Veen grab in order to compare our results with the remaining samples of the Ensenada de O Grove. Five replicate samples were collected from each site accounting for a total area of 0.28 m2. Samples were sieved through a 0.5 mm mesh and fixed in 10% buffered formalin. Samples of surface and bottom water were also taken at each site for salinity and temperature measurements. An additional sample of sediment was collected from each site in order to analyse particle-size composition and content in carbonate and organic matter.
Laboratory analysis
Molluscs were sorted out from the sediment under a stereomicroscope, identified (to species level when possible), counted and preserved in 70% ethanol. The scientific names and the systematic order of species were revised following the CLEMAN database (www.somali.asso.fr/clemam). Grain-size analyses were conducted considering the following granulometric fractions: gravel (>2 mm); very coarse sand (2–1 mm); coarse sand (1–0.5 mm); medium sand (0.5–0.25 mm); fine sand (0.25–0.125 mm); very fine sand (0.125–0.063 mm); and silt/clay (<0.063 mm). Median grain size (Q50) and sorting coefficient (So) were also determined for each sample. Sedimentary types were characterized according to the findings of Junoy (Reference Junoy1996). Carbonate content (%) was estimated by treating the sample with hydrochloric acid. Total organic matter (%) was estimated from the weight loss on combustion for 4 hours at 450°C.
Data analyses
Several univariate parameters were determined for each site: total abundance (N); species richness (S); the Shannon–Wiener diversity index (H′, log2); and Pielou's evenness (J). Mollusc assemblages were determined through non-parametric multivariate techniques as described by Field et al. (Reference Field, Clarke and Warwick1982) using the PRIMER 6 software package (Clarke & Warwick, Reference Clarke and Warwick1994). Abundance data were previously fourth-root transformed to downweight the contribution of the most abundant species. A matrix of similarities among sampling sites was constructed using the Bray–Curtis similarity coefficient. From this matrix, a classification of the sampling sites was done by cluster analysis and tested by the Simprof test. A non-metric multidimensional scaling (MDS) was applied to show the ordination of sampling sites. The one-way ANOSIM test was used to determine differences in faunal composition among sites. The SIMPER procedure was also applied in order to identify species that contributed to dissimilarities among assemblages. Species presented in each assemblage were classified according to the Constancy and Fidelity indices. Species which occurred with more than 1% of the total specimens in a site or group of sites were considered as ‘dominant’ (Junoy, Reference Junoy1996). The Frequency × Dominance product was calculated in order to know the numerical importance of species.
Relationships among mollusc distribution and the measured environmental variables were determined using the BIO-ENV procedure (PRIMER) and the canonical correspondence analysis (CCA) using the CANOCO v 4.02 (Canonical Community Ordination) package (Ter Braak, Reference Ter Braak1988). The forward selection was employed in the latter to detect which variables explained the most variance in the species data. The following variables were considered in these analyses: organic matter (%); carbonate (%); pH and temperature of surface and bottom water; pH and temperature of sediment; granulometric fractions (%); median grain size (mm); and sorting coefficient and depth (m). Variables expressed in percentages were previously log (x + 1) transformed. These variables and the aforementioned univariate measures were also analysed through the non-parametric Spearman's rank test in order to detect significant relationships among variables (SPSS 15 software package).
RESULTS
Sediments
Sites colonized by seagrasses had muddy sediments with moderate to high content of silt/clay (6–62%). Sand content was generally greater in subtidal sites and the sedimentary types ranged from muddy sand to mud (Table 1). Water salinity was mainly low (<33‰) specifically in stations 34 and 37 close to the river (20‰). Carbonate content ranged from 5 to 10% and the percentage of organic matter ranged from low values in subtidal sites (1.3%) to higher ones (up to 15.5%) in intertidal inner areas (Table 1).
Table 1. Geographical coordinates (Coord.), depth (S, subtidal; I, intertidal), salinity of surface water (‰) (SSW), salinity of bottom water (SBW) and sedimentary characteristics of sampling sites at the Ensenada de O Grove. Granulometric fractions (%) (MS, medium sand; FS, fine sand; VFS, very fine sand); Q50, median grain size (mm); S0, sorting coefficient; Sel., selection (M, moderate; MWS, moderate well sorted; P, poor); S. Type, sedimentary type (MS, muddy sand; SM, sandy mud; M, mud); %OM, percentage of organic matter; %Carb., carbonates percentage.

Abundance, species richness, diversity and evenness
A total of 7641 individuals belonging to 68 species were collected (Appendix). Bivalves and gastropods were the most abundant groups (51.9% and 47.9% of total abundance, respectively) and had the greater values of species richness (38 and 27, respectively). Polyplacophorans were represented by 3 species and 0.2% of total abundance. Among gastropods the families Trochidae (genera Gibbula and Jujubinus), Nassariidae (genera Nassarius and Cyclope) and Littorinidae (genus Littorina) comprised the higher number of species (5, 5 and 3 spp., respectively) whereas the families Hydrobiidae, Retusidae, Trochidae and Calyptraeidae were the dominant in terms of abundance (2819, 296, 118 and 104 indiv./0.28 m2, respectively). The gastropod Peringia ulvae (Pennant, 1777) was the numerically dominant species, particularly in site 37 (a muddy site colonized by Z. noltei close to a river) and site 40 (a sandy mud site with Zostera spp.). Other abundant and widespread gastropod species were Retusa truncatula (Bruguière, 1792) numerically dominant in sites 26, 27, 35 and 39, and Calyptraea chinensis (Linnaeus, 1758) dominant in sites 26, 27 and 31. Among bivalves, the family Veneridae comprised the highest number of species (7 spp.) including the genera Chamelea, Dosinia and Venerupis whereas the families Lucinidae (genera Loripes and Myrtea), Semelidae (genus Abra), Montacutidae (genus Kurtiella) and Cardiidae (genera Parvicardium and Cerastoderma) were the dominant in terms of abundance (2613, 731, 315 and 117 indiv/0.28 m2, respectively). The bivalve Abra alba (Wood, 1802) was dominant in sites 35, 38, 39 and 40, and Loripes lucinalis (Lamarck, 1818) in sites 35, 37 and 40. On the other hand, the bivalve Kurtiella bidentata (Montagu, 1803) was abundant in sites colonized by Z. marina (24, 26, 27 and 31).
The lowest value of abundance was recorded in site 34 (178 individuals) and site 26 (358 ind.) whereas the greatest abundance were recorded in sites 37 (1896 ind.), 40 (1268 ind.) and 35 (1020 ind.) (Table 2). Species richness ranged from 30 (site 27) to 10–11 (sites 34 and 37). Diversity (H′) showed generally moderate values (2.18–3.12). Lowest values were determined for sites 34, 37, 38 and 39 (<2). Evenness (J) showed moderate values which ranged from 0.44 to 0.64 except in sites 37 and 38 (0.15 and 0.20) where there was a low value of species richness and great numerical dominance by P. value (site 37) and L. lucinalis (site 38). Diversity showed a positive correlation through non-parametric Spearman's correlation coefficient with carbonate content (P < 0.01). Diversity and species richness were negatively correlated with silt/clay content and percentage of organic matter (P < 0.01).
Table 2. Total abundance (N, individuals per 0.28 m2), species richness (S), Shannon–Wiener diversity index (H′, log2) and Pielou's evenness (J) for each sampling site in the Ensenada de O Grove.

Multivariate analyses
The ANOSIM test revealed the existence of significant differences among sites (global R: 0.796, P < 0.001). Two main groups of sites were determined from the dendrogram resulting from cluster analysis at 45% similarity level (Figure 2). Group A consisted of 7 sites which were further grouped in three subgroups: A1 (sites 24, 26, 27 and 31); A2 (sites 35 and 39); and A3 (site 38). Subgroup A1 contained muddy sand bottoms with Z. marina and subgroup A2 comprised muddy sand and sandy mud bottoms colonized by Z. noltei or by both seagrass species. Group B comprised sites 34, 40 and 37; the first two had sandy mud colonized by both seagrass species (B1) and the third site was a muddy bottom exclusively colonized by Z. noltei (B2). MDS ordination (Figure 3) confirmed the groups determined from the dendrogram.

Fig. 2. Dendrogram produced by cluster analysis based on Bray–Curtis similarity index on fourth-root transformed data of mollusc abundances.

Fig. 3. Non-metric multidimensional scaling ordination plot based on Bray–Curtis similarity index.
The SIMPER analysis (Table 3) showed that the species which had a major contribution to similarity among sites of subgroup A1 were L. lucinalis, K. bidentata, P. ulvae, R. truncatula, Venerupis corrugata (Gmelin, 1790) and Parvicardium exiguum (Gmelin, 1791). In the subgroup A2 the responsible species were L. lucinalis, P. ulvae, R. truncatula, Cyclope neriteus (Linnaeus, 1758) and A. alba. Subgroup B1 comprised sites 34 and 37 and the species which most contributed to similarity were P. ulvae, A. alba and L. lucinalis.
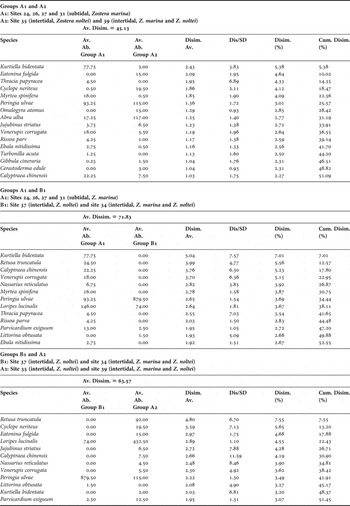
Table 3. Results of SIMPER analysis showing the main contributing taxa to the similarity among subgroups determined from dendrogram and non-metric multidimensional scaling. Average abundance (Av. Ab.), average similarity (Av. Simil.), ratio value (similarity/standard deviation, Sim./SD) and percentage of cumulative similarity (Cumul. Simil.) were also included.

The major responsible taxa for dissimilarities between subgroups A1 and A2 were K. bidentata (mainly in group A1), Eatonina fulgida (Adams J., 1791) (absent in group A1), Thracia papyracea (Poli, 1791) (absent in subgroup A2) and C. neriteus (mainly in group A2) (Table 4). The species mostly contributing to dissimilarities between subgroup A1 and B1 were K. bidentata, R. truncatula, C. chinensis and V. corrugata (the latter absent in B1) and R. truncatula, C. neriteus, E. fulgida (absent in B1) and L. lucinalis (mainly in A2) between B1 and A2 subgroups.
Table 4. Results of SIMPER analysis showing the main contributing taxa to the dissimilarity among subgroups determined from dendrogram and non-metric multidimensional scaling. Average abundance (Av. Ab.), average dissimilarity (Av. Disim.), ratio value (dissimilarity/standard deviation, Disim./SD) and percentage of cumulative dissimilarity (Cum. Disim.) were also included.
The BIOENV procedure (Table 5) indicated that the environmental variable best explaining distribution of fauna was the sorting coefficient (ρw: 0.700) and the combinations of gravel, sorting coefficient and carbonate content (ρw: 0.680).
Table 5. Best combinations of variables by BIO-ENV analysis according to the values of the Spearman's rank correlation (ρW) for the Ensenada de O Grove. K, number of variables; SBW, salinity of bottom water; GR, gravel; CS, coarse sand; MS, medium sand; So, sorting coefficient; CARB, carbonates percentage.

The CCA and Monte Carlo test showed that the ordination of sites was determined by sorting coefficient and depth. Axes I and II of CCA ordination accounted for 45.8% of variance. For this analysis only nine variables were used due to the low number of sites to avoid multicollinearity (Ter Braak, Reference Ter Braak1986; Mercier et al., Reference Mercier, Chessel and Dolédec1992). Sorting coefficient and coarse sand content showed a strong positive correlation with axis I. This axis also showed a negative correlation with carbonate content and salinity of bottom water, very fine sand content and depth. Axis II had a positive correlation with salinity of bottom water, carbonate content, medium sand content, median grain size and a negative correlation with depth, very fine sand content and sorting coefficient. The graphic representation of CCA showed that subgroup A1 (24, 26, 27 and 31) was related to very fine sand and depth (Figure 4). These sites were mostly subtidal muddy sand bottoms colonized by Z. marina. Subgroups A2 (35 and 39) and A3 (38) and group B constituted by subgroup B1 (37 and 34) and subgroup B2 (40) were distributed along the positive region of Axis I. However, site 37, a mud flat exclusively colonized by Z. noltei and characterized by low values of salinity and carbonate content was represented apart from the other sites with a negative correlation with Axis II. Subgroups A2 and A3 appeared to be transitional groups between subgroup A1 and group B.

Fig. 4. Canonical correspondence analysis ordination of sites and environmental variables relative to axes I and II for the Ensenada de O Grove. SBW, salinity of bottom water; GR, gravel; CS, coarse sand; MS, medium sand; VFS, very fine sand; Q50, median grain size; So, sorting coefficient; CARB, carbonate.
Description of faunal assemblages
Faunal assemblages of subgroups A1 and A2 and group B obtained through multivariate analyses are described below. Their faunistic and abiotic characteristics as well as the constant species for each group, the Fidelity index and Frequency × Dominance (F × D) product are summarized in Table 6.
Table 6. Summary of biotic and physical characteristics of the three assemblages derived from multivariate analysis (values: mean ± standard deviation). First ten constant species are listed including their fidelity (EXC, exclusive; ELE, elective; ACE, accessory; OCA, occasional) and Frequency × Dominance values (in parentheses). N, number of individuals per 0.28 m2; S, species richness per 0.28 m2; H′, Shannon–Wiener diversity; J, Pielou's evenness; %OM, percentage of organic matter; %CARB, carbonates percentage; Q50, median grain size.

Subgroup A1 was mainly characterized by subtidal muddy sandy bottoms with moderate selection, and low percentage of organic matter content. This group presented a high abundance (1900 ind.) and the greatest values of species richness (50 spp.) ranging from 20 to 30 species per site. The greatest value of species richness was recorded for site 27 (30). This subgroup was numerically dominated by the epifaunal gastropods P. ulvae and C. chinensis, the opisthobranch R. truncatula and the bivalves L. lucinalis, K. bidentata, V. corrugata and P. exiguum. Values of diversity ranged from 2.37 to 3.12 and evenness between 0.55 and 0.64.
Subgroup A2 only comprised two sites over muddy sand bottoms characterized by low values of percentage of organic matter content ranging from 1.32 to 3.32 and carbonate content ranging from 9.59 to 10.46. This subgroup A2 shared several species with subgroup A1. Total number of individuals and species was high (1757 ind. and 33 spp.) ranging from 720 to 1014 individuals and from 20 to 26 species per site, respectively. The bivalves L. lucinalis and A. alba and the gastropods P. ulvae and C. neriteus were the numerically dominant species. Values of diversity ranged from 1.87 to 2.56 and evenness between 0.43 and 0.54.
Group B comprised three sites corresponding to sandy muds colonized by both seagrass species and a muddy bottom exclusively colonized by Z. noltei. These sites were characterized by the lowest carbonate content and salinity values (especially site 37). This group had the greatest number of individuals (3342 ind.) whereas it comprised the smallest values of species richness (24 spp.) ranging from 10 to 20 species per site. Most of the specimens of P. ulvae were found in this bottom. The bivalves L. lucinalis and A. alba were also abundant in these sites. Diversity and evenness showed low values (H′: 0.50–2.18; J: 0.15–0.50).
DISCUSSION
Molluscs are one of the principal components of benthic fauna together with polychaetes and crustaceans (Lewis & Stoner, Reference Lewis and Stoner1983; López-Jamar & Mejuto, Reference López-Jamar and Mejuto1985). In the present study, molluscan assemblages in seagrass beds of the Ensenada de O Grove showed, in general, a large number of individuals (7641 individuals) and a high diversity in the number of species (68 spp.) and that these differed in their spatial distribution. In southern Spain, studies on several seagrass species also pointed out the high abundance and diversity of molluscs in these habitats. For instance, in several eelgrass beds in the Alborán Sea, Rueda et al. (Reference Rueda, Gofas, Urra and Salas2009a) reported a total of 1515 individuals belonging to 76 species and Rueda et al. (Reference Rueda, Marina, Urra and Salas2009b) also collected a high number of species (162 spp.) mostly including gastropods (99 spp.) and bivalves (57 spp.). Nevertheless, comparisons between studies are difficult because of the use of different sampling methods (Agassiz trawl and quadrats) and temporal scales (months and day/night). Marina et al. (Reference Marina, Urra, Rueda and Salas2012) reported from a temporal study in a Cymodocea nodosa bed a total of 64.824 individuals belonging to 54 mollusc species; the fauna was mainly composed of gastropods (99.56% of individuals, 43 spp.) and bivalves (0.41%, 10 spp.) represented by species with a wide geographical distribution in Europe, followed by strictly Mediterranean species (Marina et al., Reference Marina, Urra, Rueda and Salas2012).
Multivariate techniques determined the presence of two main molluscan assemblages in the studied seagrass meadows. Within group B, the faunal composition of site 37, a muddy bottom colonized by Z. noltei, had a certain parallelism with the ‘reduced Macoma community’, which was previously reported in the area by Cadeé (Reference Cadée1968) and Mora (Reference Mora1982). On the Atlantic European coast, this community has been characterized by a strong dominance of Peringia ulvae (Pennant, 1777) (Currás & Mora, Reference Currás and Mora1990; Olabarria et al., Reference Olabarria, Urgorri and Troncoso1998). This fact was also observed in the Ensenada de O Grove. Furthermore, this community can be located in areas with high silt/clay content sometimes colonized by Zostera noltei or by this species and Zostera marina. Site 37 also had the lowest diversity in species richness similarly to areas close to a river in the Ría del Eo (Currás et al., Reference Currás, Sánchez-Mata and Mora1993) and the Ensenada de San Simón (Ría de Vigo) (Cacabelos et al., Reference Cacabelos, Gestoso and Troncoso2008). Sites 37 and 34 also had low values of evenness and this may be in relation to the great numerical dominance of P ulvae. The abundance of this species in these meadows may be explained by its eclectic feeding strategies (Jacobs et al., Reference Jacobs, Hegger and Ras-Willems1983) and its resilience to salinity changes in areas subjected to regular freshwater inputs. Sites 37 and 34 were also characterized by the presence of Venerupis aurea (Gmelin, 1790), Abra alba and Loripes lucinalis. This species composition was partially similar to that described from other Z. noltei beds in the North Sea (Reise, Reference Reise1981) and in other Galician rias such as Ría de Foz (Junoy, Reference Junoy1996), Ría de Ferrol (Olabarria et al., Reference Olabarria, Urgorri and Troncoso1998) and Ensenada de San Simón (Ría de Vigo) (Cacabelos et al., Reference Cacabelos, Gestoso and Troncoso2008).
Biocenotic characterization of subgroups A1 and A2 containing the major number of sites, could not be determined according to classic studies in terms of ‘facies’ and ‘communities’. However, composition of the assemblage and abundance of species found in these subgroups are those typical of muddy sediments not subjected to strong fluctuations of salinity. Furthermore, there were no similar gradients in sedimentary composition and associated fauna as those reported from other Galician rias (e.g. Mora, Reference Mora1982; Junoy, Reference Junoy1996; Moreira et al., Reference Moreira, Quintas and Troncoso2005; Lourido et al., Reference Lourido, Gestoso and Troncoso2006). This may be due to the overall muddy composition of studied sediments and other similar shared features (i.e. percentage of organic matter and shelter from oceanic influence). Thus, besides the presence of several groupings derived from multivariate analysis, many taxa were present in all groups which was eventually reflected in SIMPER results.
Low values of species richness and diversity have traditionally been associated with muddy sediments (Olabarria et al., Reference Olabarria, Urgorri and Troncoso1998; Moreira et al., Reference Moreira, Quintas and Troncoso2005) whereas the opposite pattern was found in coarser sediments with small amounts of silt/clay content. Our results confirmed this pattern, thus diversity (H′) presented a negative correlation with silt/clay content and percentage of organic matter. However, besides the muddy nature of the studied sites, species richness and diversity were high especially in muddy sand bottoms, which may be due to the very presence of seagrasses. For example, these seagrasses contribute to increase heterogeneity of habitat and provide refuge from predators for many species (Heck & Thoman, Reference Heck and Thoman1981; Orth et al., Reference Orth, Heck and Van Montfrans1984). Rhizomes and roots also increase stability of sediment, which in turn, is directly correlated with diversity (Persson, Reference Persson1983).
Subgroup A2 (sites 35 and 39) showed lower values of species richness and diversity than sites of group A1. The former can be considered as a transition between the richer assemblage of subgroup A1 and that of group B which shows lower values of species richness and diversity. Low values in the A2 and B groups can be explained by the greater silt/clay content and the intertidal nature of these sites with the associated stress derived from desiccation, temperature changes and food availability (Olabarria et al., Reference Olabarria, Urgorri and Troncoso1997). However, site 35 (subgroup A2), a muddy sand with Z. noltei, presented high diversity values (H′: 2.56) and species richness (S: 26). These values contrast with the data described by Junoy (Reference Junoy1996) (H′: 0.99) in the Ría de Foz (Spain) from similar habitats.
Biocenotic classification of muddy sand bottoms covered by Zostera is complex. Many species inhabiting sediments colonized by Z. marina are also present in unvegetated muddy sand assemblages (Pérès, Reference Pérès1958). Seagrass beds are open systems that may act as nurseries and provide refuge and foraging habitats for fishes and crustaceans (Larckum et al., Reference Larckum, McComb and Shepherd1989). In fact, edges of seagrass beds were considered as the first available refuge for organisms seeking refuge from predators among habitat patches (Sogard, Reference Sogard1989; Bologna, Reference Bologna2006). Seagrass meadows also export detritus to adjacent areas allowing the presence of detritivorous species. Previous works reported that edges of these structural habitats accumulate sediments (Orth, Reference Orth and Coull1977) algae and detritus (Polis & Hurd, Reference Polis and Hurd1996; Brooks & Bell, Reference Brooks and Bell2001). Luque & Templado (Reference Luque and Templado2004) pointed out that a surprising feature of seagrass beds is the similarity of the trophic composition at the family, genera or species level among meadows of different parts of the world. In the case of molluscs, gastropods such as Trochidae, Nassaridae, Rissoidae and Littorinidae were common in the studied seagrass bed as well as in other seagrass beds elsewhere (Rasmussen, Reference Rasmussen1973; Olabarria et al., Reference Olabarria, Urgorri and Troncoso1997; Luque & Templado, Reference Luque and Templado2004). Among bivalves, only the Veneridae and Lucinidae families were well-represented in the studied meadows. Semelids (genus Abra) and lucinids (L. lucinalis) have been recorded as typical species in reduced sediments among mats of Zostera (Jacobs, Reference Jacobs1980; Glémarec & Grall, Reference Glémarec and Grall2000). Loripes lucinalis was also reported in association with Z. marina in Ría do Eo (Currás et al., Reference Currás, Sánchez-Mata and Mora1993) and Gulbahace Bay (Aegean Sea: Çinar et al., Reference Çinar, Ergen, Ozturk and Kirkim1998). On the Galicia coast, Cacabelos et al. (Reference Cacabelos, Gestoso and Troncoso2008) reported a similar mollusc assemblage in Zostera beds in Ensenada de San Simón (Ría de Vigo, north-western Spain) with P. ulvae, Rissoa labiosa (Montagu, 1803), Turboella radiata (Philippi, 1836), Parvicardium exiguum, L. lucinalis, Abra nitida (Müller, 1789) and Chrysallida terebellum (Philipppi, 1844) as the most characteristic species. Similarly, Arroyo et al. (Reference Arroyo, Salas, Rueda and Gofas2006) described equivalent species for Z. marina beds located in southern Spain (Alboran Sea) with Jujubinus striatus (Linnaeus, 1758), Rissoa membranacea (J. Adams, 1800), Nassarius pygmaeus (Lamarck, 1822), Mitrella minor (Scacchi, 1836), Bittium reticulatum (da Costa, 1778) and Modiolarca subpicta (Cantraine, 1835), as the most frequent species. At aspecies level, the molluscan fauna in the Zostera beds in the Ensenada de O Grove is also comparable to that found in other eelgrass on the Atlantic coast of Europe where similar species were found such as the gastropods J. striatus, R. membranacea, Rissoa parva (da Costa, 1778), B. reticulatum, Nassarius reticulatus (Linnaeus, 1758), and the bivalves L. lucinalis, A. alba and Parvicardium exiguum (Jacobs & Huisman, Reference Jacobs and Huisman1982; Currás et al., Reference Currás, Sánchez-Mata and Mora1993; Fredriksen et al., Reference Fredriksen, Hartvig and Sæthre2005). Some of these species such as J. striatus and R. membranacea were also reported for Cymodocea meadows (Ballesteros et al., Reference Ballesteros, García Raso, Salas, Gofas, Moreno, Templado, Luque and Templado2004). In the present study the presence of Mediterranean species such as the gastropods Cyclope neriteus (very common in site 35) and Nassarius pfeifferi (only present in site 37) is remarkable. The presence of these foreign species in this area could be explained due to the important commercial exploitation and importation of oysters in the area (Rolán et al., Reference Rolán, Trigo, Otero-Schmitt and Rolán-Álvarez1985).
In conclusion, our study shows that mollusc assemblages are well-represented and had a high diversity in the Z. marina and Z. noltei meadows in the Ensenada de O Grove. This information reinforces the importance of seagrass meadows for preservation of biodiversity. This is the first quantitative and systematic study based on the molluscan fauna associated with the seagrass beds of the inlet. So this paper can be useful as a baseline study for both further future studies and environmental management in order to protect these areas.
ACKNOWLEDGEMENTS
The authors are very grateful to colleagues of the laboratory of Adaptaciones de Animales Marinos for their invaluable assistance in the fieldwork. This work received financial support from the XUGA30101A98 project. Constructive comments from two anonymous referees are appreciated.
Appendix Taxonomic list of molluscan species reported in the present study
Phylum Mollusca
Class Polyplacophora
Leptochiton cancellatus (Sowerby, 1840)
Lepidochitona cinerea (Linnaeus, 1767)
Lepidochitona iberica Kaas & Van Belle, 1981
Class Gastropoda
Diodora graeca (Linnaeus, 1758)
Puncturella noachina (Linnaeus, 1771)
Gibbula adansonii (Payraudeau, 1826)
Gibbula albida (Gmelin, 1791)
Gibbula cineraria (Linnaeus, 1758)
Gibbula magus (Linnaeus, 1758)
Jujubinus striatus (Linnaeus, 1758)
Bittium reticulatum (da Costa, 1778)
Cerithiopsis tubercularis (Montagu, 1803)
Littorina littorea (Linnaeus, 1758)
Littorina fabalis (Turton, 1825)
Littorina obtusata (Linnaeus, 1758)
Skeneopsis planorbis (O. Fabricius, 1780)
Eatonina fulgida (J. Adams, 1797)
Rissoa membranacea (J. Adams, 1800)
Rissoa parva (da Costa, 1778)
Peringia ulvae (Pennant, 1777)
Hyala vitrea (Montagu, 1803)
Calyptraea chinensis (Linnaeus, 1758)
Nassarius ovoideus (Locard, 1886)
Nassarius pfeifferi (Philippi, 1884)
Nassarius pygmaeus (Lamarck, 1822)
Nassarius reticulatus (Linnaeus, 1758)
Cyclope neriteus (Linnaeus, 1758)
Omalogyra atomus (Philippi, 1841)
Chrysallida indistincta (Montagu, 1808)
Turbonilla acuta (Donovan, 1804)
Ebala nitidissima (Montagu, 1803)
Opistobranchia, genera et sp. indet. 1
Opistobranchia, genera et sp. indet. 2
Opistobranchia, genera et sp. indet. 3
Diaphana minuta T. Brown, 1827
Retusa truncatula (Bruguière, 1792)
Retusa sp. 1
Haminoea navicula (da Costa, 1778)
Elysia viridis (Montagu, 1804)
Doris verrucosa Linnaeus, 1758
Class Bivalvia
Modiolarca subpicta (Cantraine, 1835)
Modiolula phaseolina (Philippi, 1844)
Loripes lucinalis (Lamarck, 1818)
Myrtea spinifera (Montagu, 1803)
Thyasira flexuosa (Montagu, 1803)
Montacutidae genera et sp. indet. 1
Kurtiella bidentata (Montagu, 1803)
Carditidae, genera et spp. indet.
Digitaria digitaria (Linnaeus, 1758)
Parvicardium exiguum (Gmelin, 1791)
Cerastoderma edule (Linnaeus, 1758)
Spisula subtruncata (da Costa, 1778)
Lutraria lutraria (Linnaeus, 1758)
Solen marginatus Pulteney 1799
Angulus tenuis (da Costa, 1778)
Tellina fabula (Gmelin, 1791)
Gari (Gobraeus) sp.
Abra alba (W.Wood, 1802)
Chamelea striatula (da Costa, 1778)
Dosinia exoleta (Linnaeus, 1758)
Dosinia sp. 1
Venerupis aurea (Gmelin, 1791)
Venerupis rhomboides (Linnaeus, 1767)
Venerupis corrugata (Gmelin, 1791)
Venerupis decussata (Linnaeus, 1758)
Sphenia binghami Turton, 1822
Thracia papyracea (Poli, 1791)


