INTRODUCTION
Sea turtles are late maturing, migratory animals who use both the oceanic and terrestrial environment during their life; hence, their life cycles tend to be complex (Musick & Limpus, Reference Musick, Limpus, Lutz and Musick1997; Bolten, Reference Bolten, Lutz and Musick2003). Capture-mark-recapture (CMR) studies can provide important data on size distribution, growth rates, site fidelity, residency, mortality rates and migratory destinations (Bjorndal & Bolten, Reference Bjorndal and Bolten1988; Limpus et al., Reference Limpus, Couper and Read1994; Meylan et al., Reference Meylan, Meylan and Gray2011). These studies, when carried out for long periods, can provide detailed demographic information of the different life stages in target populations (Chaloupka & Limpus, Reference Chaloupka and Limpus2001). Furthermore, assessing the relative importance of different foraging sites and local conservation concerns are of utmost importance for establishing conservation priorities (Hamann et al., Reference Hamann, Godfrey, Seminoff, Arthur, Barata, Bjorndal, Bolten, Broderick, Campbell, Carreras, Casale, Chaloupka, Chan, Coyne, Crowder, Diez, Dutton, Epperly, FitzSimmons, Formia, Girondot, Hays, Cheng, Kaska, Lewison, Mortimer, Nichols, Reina, Shanker, Spotila, Tomás, Wallace, Work, Zbinden and Godley2010).
The green turtle (Chelonia mydas Linnaeus, 1758), is one of the largest grazing reptiles, and the only essentially herbivorous sea turtle species (Bjorndal, Reference Bjorndal1980, Reference Bjorndal, Eckert, Bjorndal, Abreu-Grobois and Donnely1999) that occurs throughout the world's tropical and subtropical oceans (Hirth, Reference Hirth1997). Like other sea turtle species, green turtles are long-living animals with late sexual maturity (Miller, Reference Miller, Lutz and Musick1997; Bolten, Reference Bolten, Lutz and Musick2003). Typically, they carry out long-distance migrations between their feeding and breeding grounds (Papi et al., Reference Papi, Luschi, Crosio and Hughes1997; Akesson et al., Reference Akesson, Broderick, Glen, Godley, Luschi, Papi and Hays2003). These factors, in addition to a history of global meat and egg harvesting, have resulted in the reduction of several populations (National Research Council, 1990; Seminoff et al., Reference Seminoff, Resendiz and Nichols2002a) and the green turtle, C. mydas, is listed as an endangered species throughout its range (IUCN, 2012).
Neonate green turtles spend their lives in oceanic habitats (Carr et al., Reference Carr, Carr and Meylan1978; Carr & Meylan, Reference Carr and Meylan1980) and after several years become residents of neritic zones, where they feed on seagrasses and/or macroalgae (Bjorndal, Reference Bjorndal1980; Hirth, Reference Hirth1997). Once at these foraging grounds (e.g. reefs, coastal lagoons, estuaries and rocky shores) immature individuals can remain at specific feeding sites over extended periods (Limpus et al., Reference Limpus, Couper and Read1994; Balazs & Chaloupka, Reference Balazs and Chaloupka2004; Meylan et al., Reference Meylan, Meylan and Gray2011). As these turtles approach maturity, they leave these developmental habitats and move to adult resident habitats (Musick & Limpus, Reference Musick, Limpus, Lutz and Musick1997).
At some foraging grounds, only immature developmental stages are found (Meylan et al., Reference Meylan, Meylan and Gray2011) while in other areas mostly adults are present (Mortimer, Reference Mortimer1981; Bresette et al., Reference Bresette, Witherington, Herren, Bagley, Gorham, Traxler, Crady and Hardy2010; Meylan et al., Reference Meylan, Meylan and Gray2011). In the Atlantic, C. mydas adult resident habitats have been recorded in Panamá, Nicaragua (Mortimer, Reference Mortimer1981; Meylan et al., Reference Meylan, Meylan and Gray2011) and Florida (Bresette et al., Reference Bresette, Witherington, Herren, Bagley, Gorham, Traxler, Crady and Hardy2010).
Although less common, mixed aggregations composed of immature and adult turtles can occur on the same foraging ground as seen in a number of sites in the Pacific (e.g. Hawaii, Galapagos, Australia, Baja California) (Balazs et al., Reference Balazs, Forsyth and Kam1987, Green, Reference Guebert-Bartholo, Barletta, Costa and Monteiro-Filho1993, Limpus et al., Reference Limpus, Couper and Read1994; Seminoff et al., Reference Seminoff, Resendiz and Nichols2002a). To date, no mixed aggregations of green turtles have been identified in the Atlantic (see Meylan et al., Reference Meylan, Meylan and Gray2011).
When resources are plentiful, the individuals from one population may develop an affinity with different areas for specific activities, such as feeding and resting (Fuentes et al., Reference Fuentes, Lawler and Gyuris2006; Seminoff & Jones, Reference Seminoff and Jones2006; Ballorain et al., Reference Ballorain, Ciccione, Bourjea, Grizel, Enstipp and Georges2010). Thus, determining which areas turtles use to feed and rest is essential to generate proper conservation policies, such as regulation of tourism and fisheries (Seminoff et al., Reference Seminoff, Resendiz and Nichols2002a; Schofield et al., Reference Schofield, Hobson, Lilley, Katselidis, Bishop, Brown and Hays2010) and to guide management efforts and protection. In addition, the identification of areas where adult turtles forage is very important due to their high biological value (Crouse et al., Reference Crouse, Crowder and Caswell1987; Bolten et al., Reference Bolten, Crowder, Dodd, MacPherson, Musick, Schroeder, Witherington, Long and Snover2010). An adult might not reproduce until they are 30 years old, therefore when an individual attains sexual maturity, its ‘reproductive value’ increases as it will be able to contribute new offspring to future generations (Crouse et al., Reference Crouse, Crowder and Caswell1987; Heppell et al., Reference Heppell, Crowder, Crouse, Epperly, Frazer, Bolten and Witherington2003).
In Brazil, several long-term monitoring programmes are in place at the main green turtle foraging grounds (Gallo et al., Reference Gallo, Macedo, Giffoni, Becker and Barata2006; Torezani et al., Reference Torezani, Baptistotte, Mendes and Barata2010; Lima et al., Reference Lima, Felix, Klefasz, Melo and Godfrey2012; Colman et al., Reference Colman, Patrício, McGowan, Santos, Marcovaldi, Bellini and Godley2014). Juvenile green turtles are commonly found along the north coast of Bahia, many of them stranded on beaches, often as result of interactions with fishing gear (dos Santos et al., Reference dos Santos, Santos, Gallo, Giffoni, Baptistotte, Lima, Sales, Lopez, Becher, de Castilho, Thomé, dei Marcovaldi, de los M. L. Mendilaharsu, Barata, Sforza, dei Marcovaldi and dos Santos2011), however information on demography, spatial use and foraging ecology of green turtles in this region is still lacking. To fill this knowledge gap, this project aimed at obtaining information on the demography, spatial use and foraging ecology of green turtles in the northern coast of Bahia.
MATERIALS AND METHODS
Study area
This study was carried out on the north coast of Bahia, Brazil, between Guarajuba and Praia do Forte (12.675S 38.092W to 12.556S 37.989W), Camaçari and Mata de São João municipalities respectively (Figure 1). This coastline is characterized by the presence of coral reefs and shallow submerged reefs, across sim 17 km, with substantial air exposition during low tide (Moraes & Machado, Reference Moraes and Machado2003). These reefs are built mainly by hard corals, hydrocorals Millepora sp., and encrusting coralline algae, associated with a typical reef fauna and flora (Leão & Kikushi, Reference Leão and Kikuchi2005).

Fig. 1. Study area showing sampling areas on reef flats and submerged reefs. Reef flats (PG, Papa Gente; FAR, Praia do Forte Lighthouse; PB, Baixo Port; PESP, Itacimirim Beach; ESP, Espera Beach; GJ, Guarajuba Port; SCAR, Scar reef). Submerged reefs (PTT, Tartaruga Reef; PIB, Piebus Reef; CAV, Cavala Reef; CUR, Curuzu Shipwreck; PIS, Itacimirim Lagoon Reef). *Denotes sample sites where turtle visual counts were conducted to assess the activity patterns. AR, Rocas Atoll; FN, Fernando de Noronha Island; TR, Trindade Island (breeding grounds of C. mydas in Brazil).
Turtle capture and measurements
Captures of green turtles were conducted once a week between June 2009 and December 2013 at Praia do Forte, Bahia (BA), at the ‘Tartaruga’ submerged reef (PTT) located 600 m offshore (12.56882S; 37.98993W) (Figure 1). A monofilament nylon net (30 cm mesh size) was used to capture turtles. The net soak time was recorded to obtain Catch per Unit of Effort (CPUE) values. For each captured turtle, the curved carapace length (CCL) was measured to the nearest 0.1 cm with a flexible plastic tape, from the nuchal notch to the posterior tip of the supracaudal scutes (Torezani et al., Reference Torezani, Baptistotte, Mendes and Barata2010). The turtles were tagged with metal tags (INCONEL Style 681 model) on each front flipper, placed between the first and second scales, weighed whenever possible (50 kg scales with 0.3% precision) and released. Animals weighing over 50 kg were transferred to land (TAMAR's station at Praia do Forte) to be weighed on a sling with a 250 kg scale. Annual growth rates were calculated for individuals recaptured following a 9-month or greater interval (McNeill et al., Reference McNeill, Epperly, Avens, Snover and Taylor2008), using the following equation:
 $$\hbox{Annual growth rate}\, = \,{\rm SCL}_{\rm final}\, - \,{\rm SCL}_{\rm initial}\,/\,\hbox{catch interval (days)} \times 365$$
where, SCL, Straight Carapace Length. CCL measurements were transformed into SCL through the regression equation (SCL = (0.937 × CCL) + 0.294) (Teas, Reference Teas1993).
The size frequency distribution of green turtles captured in the present study was compared with other green turtle foraging grounds in Brazil. We included data on size composition of green turtles captured using cast nets in Vitória, Espirito Santo (ES) and by non-selective fisheries such as pound nets in Ubatuba, São Paulo (SP) south-eastern Brazil, and fishing weirs in Almofala, Ceará (CE) in the north-east coast of Brazil. These data were collected by the Tamar staff along the research stations and stored in the Database of Projeto Tamar (SITAMAR). Chelonia mydas individuals were considered adults when measuring over 90 cm CCL (smallest size registered on nesting beaches in Brazil) (Almeida et al., Reference Almeida, Moreira, Bruno, Thomé, Martins, Bolten and Bjorndal2011).
Green turtle stranding records from these areas were not used in this analysis. Data obtained from other foraging aggregations corresponded to the same period as the present study (June 2009 to December 2013). Given that the effort and the number of individuals amongst the aggregations were different, 322 values (i.e. the total number of individuals captured in the present study) were randomly drawn from each location. Recapture data from all areas were excluded from this analysis. Finally, to examine differences in size of individuals amongst the populations univariate analysis of variance through permutation with 5000 interactions was carried out. When significant differences were found, Tukey post-test was carried out to establish amongst which aggregations these differences occurred. Software R (version 2.15.1) and the lmPerm (Wheeler, Reference Wheeler2010; R Development Core Team, 2011) package were used.
Vegetation sampling and turtle sightings
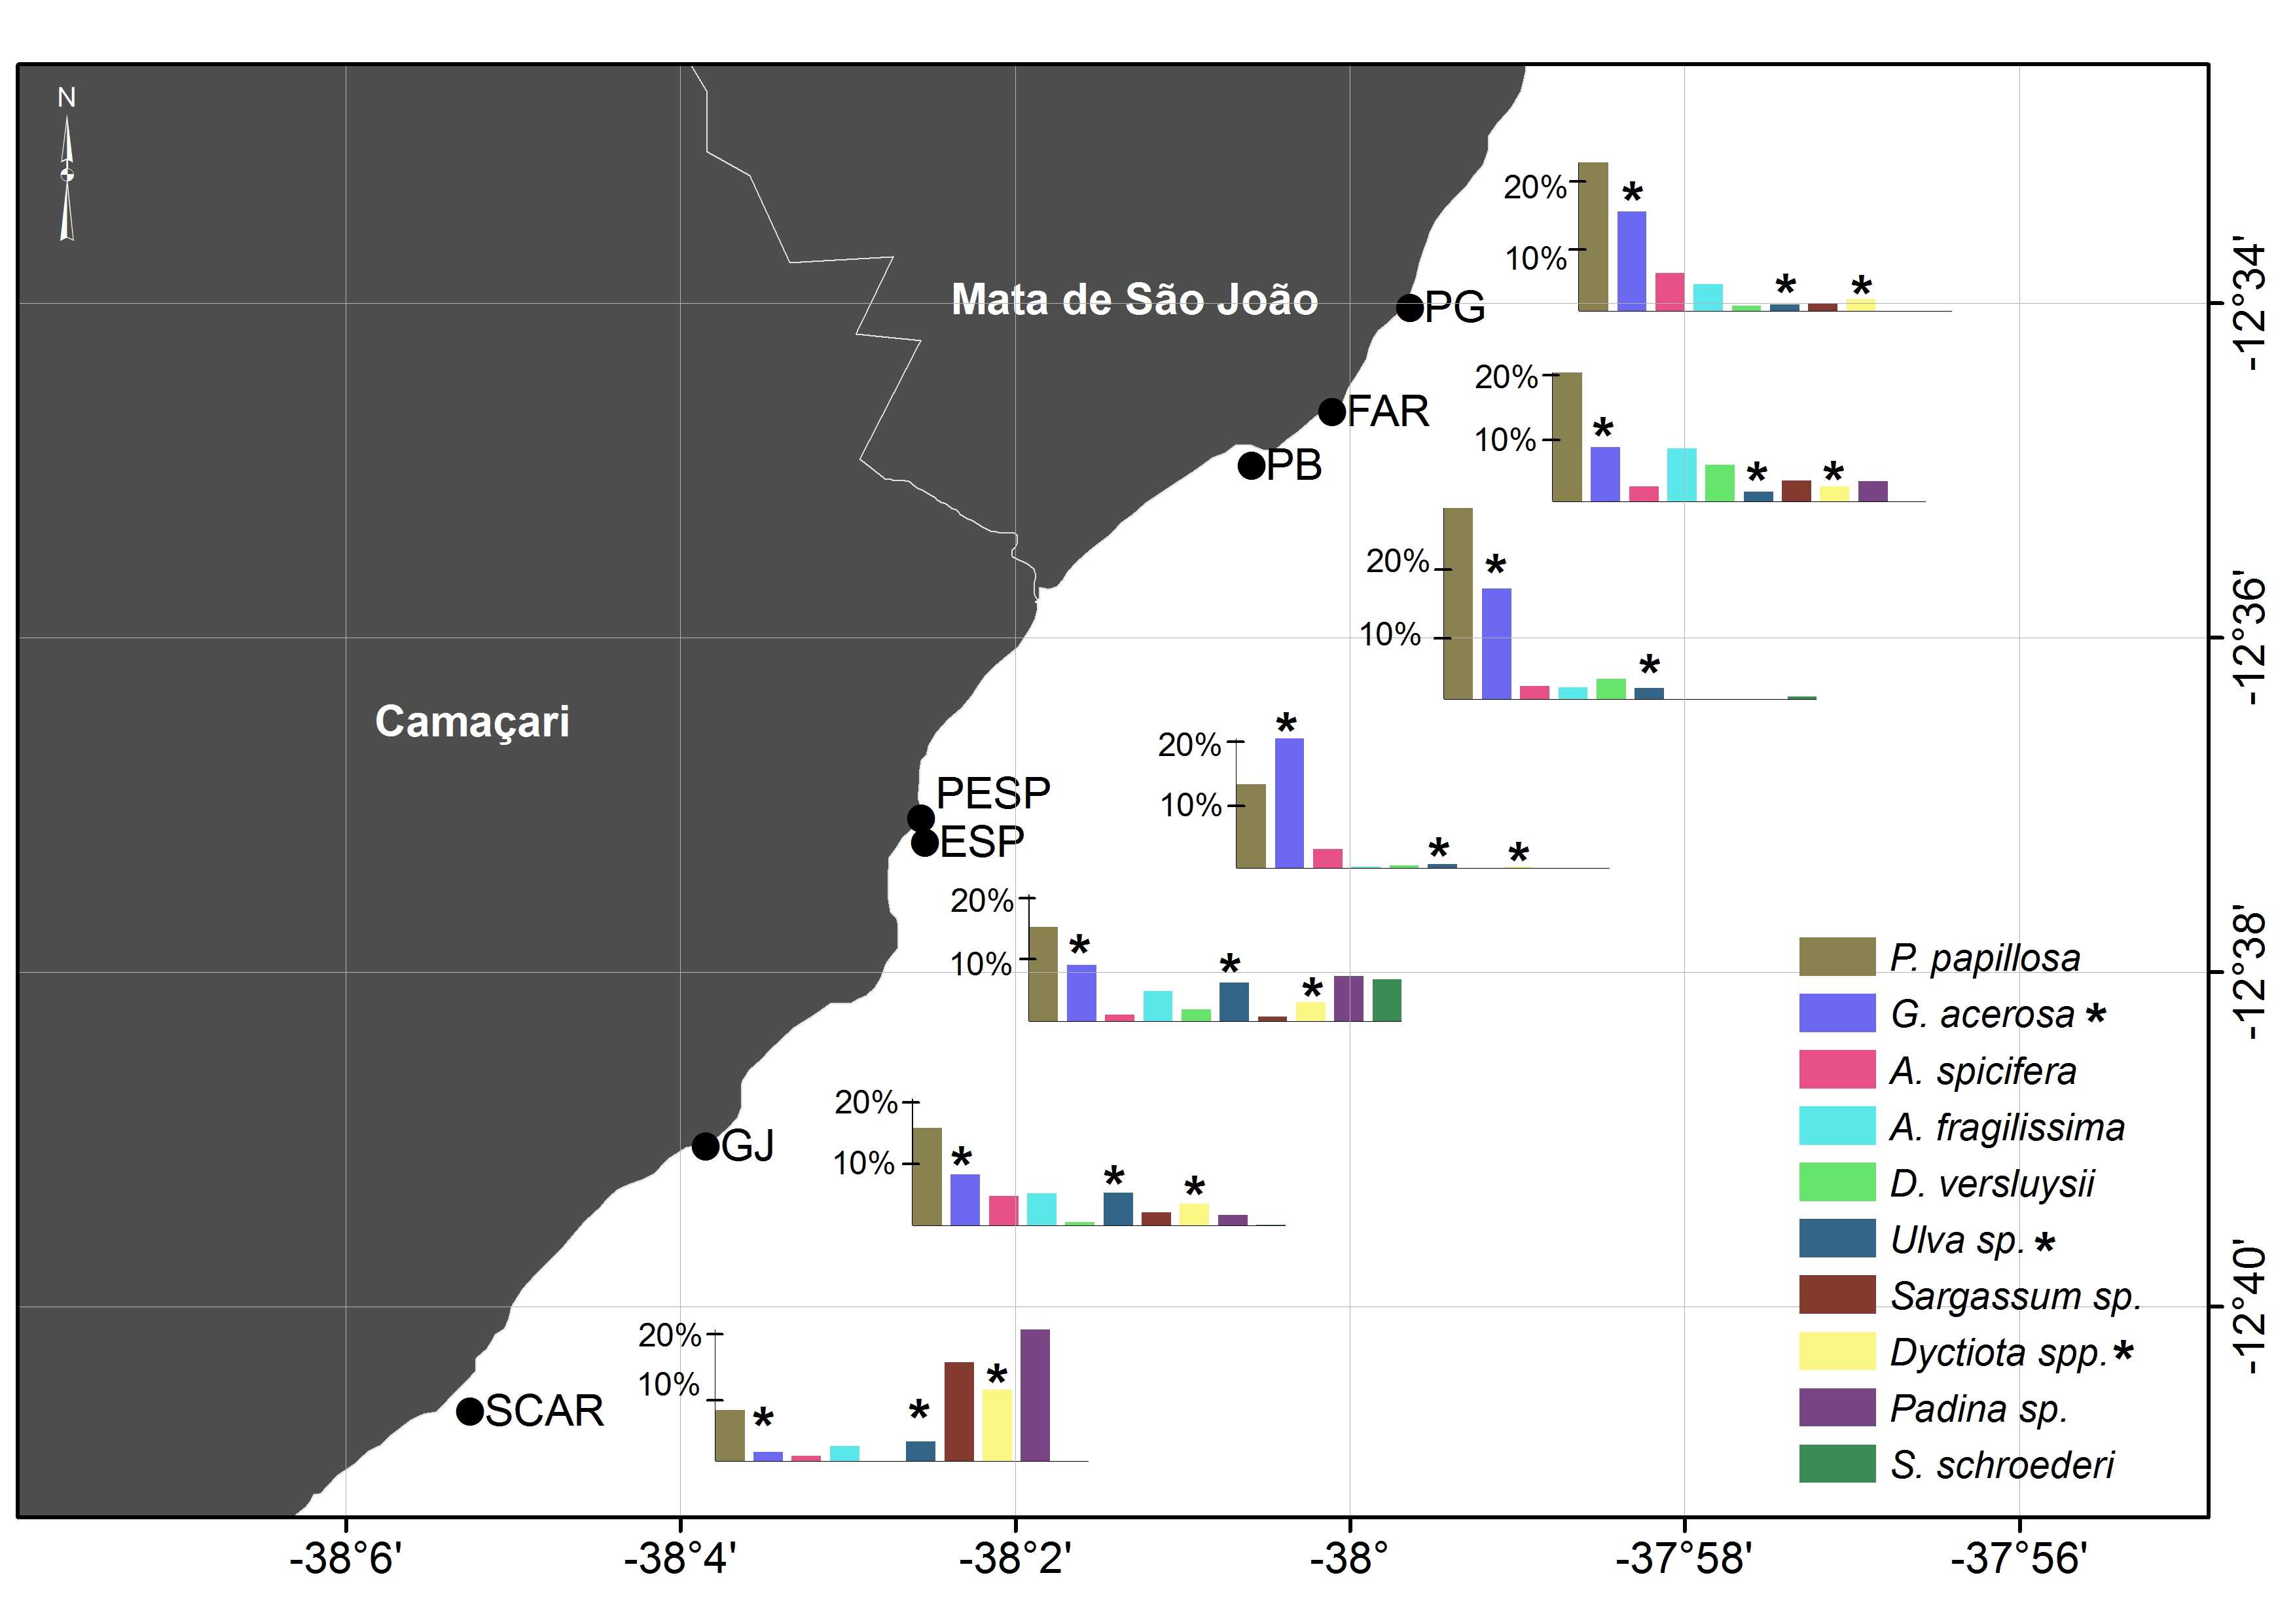
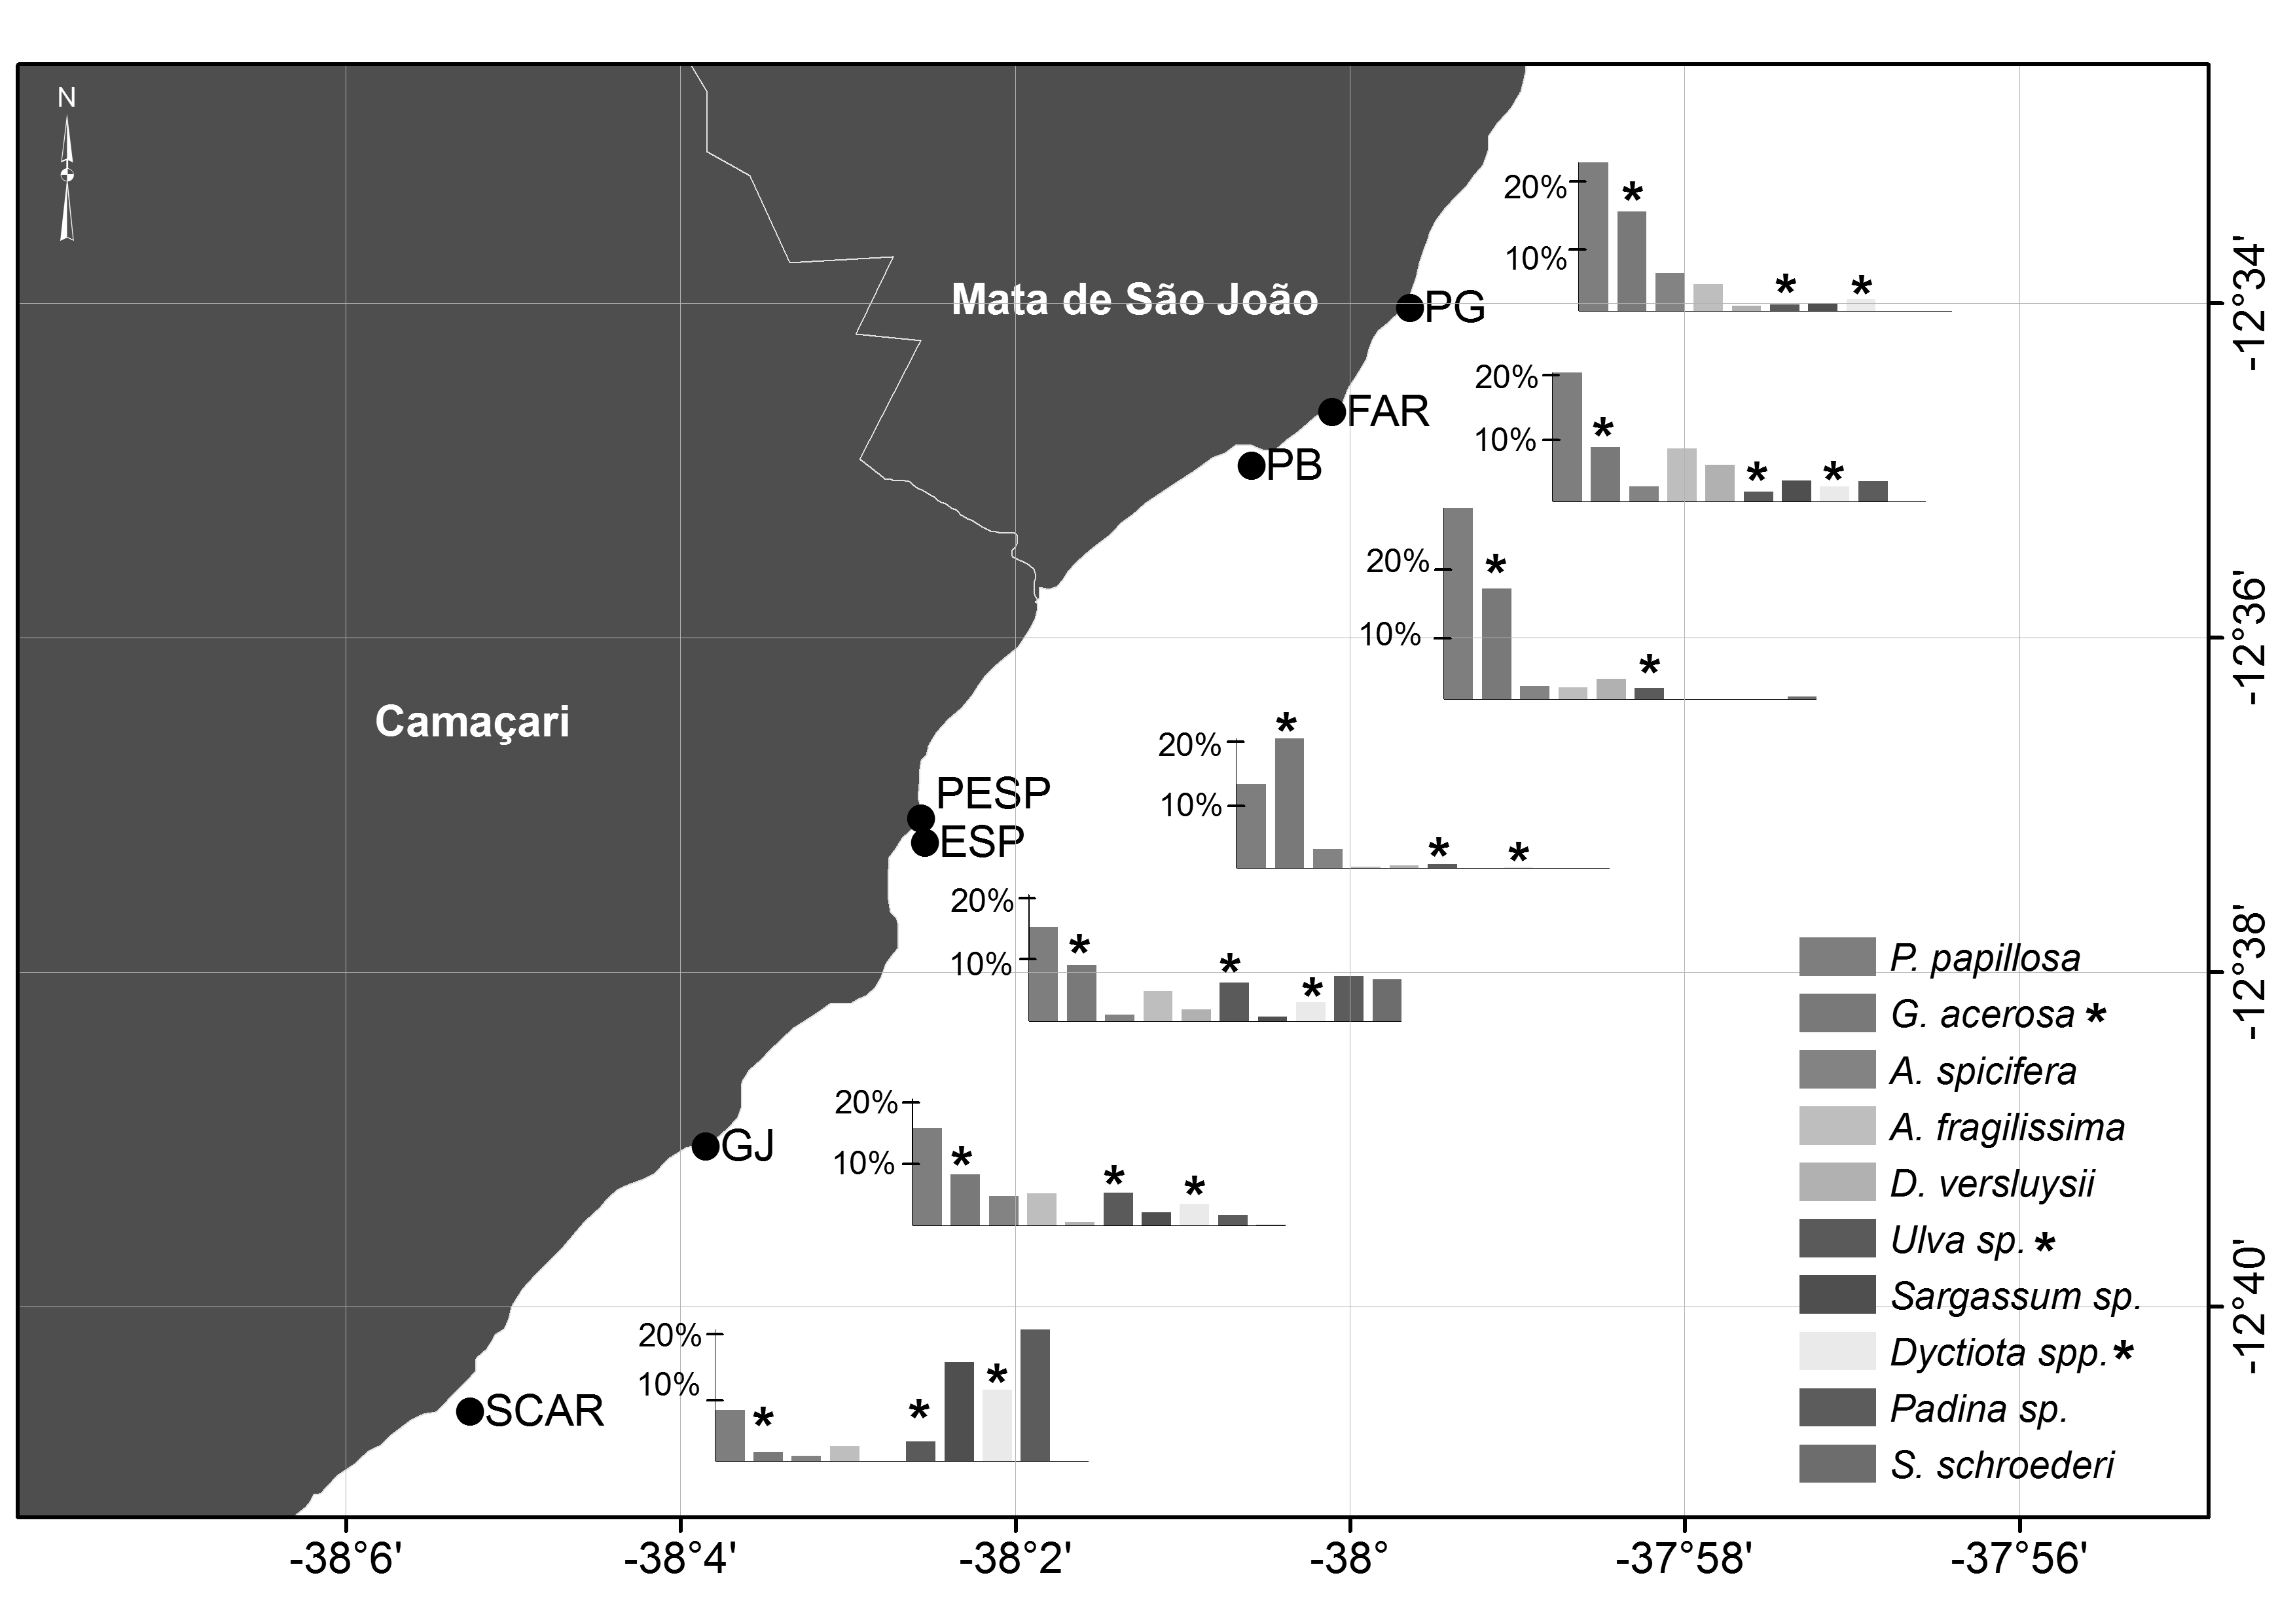
To sample the proportion of foraging items available for turtles, forty-two 20 m transects were carried out on seven reef flats along the coast (PG: Papa Gente, FAR: Praia do Forte Lighthouse; PB: Baixo Port; PESP: Itacimirim Beach; ESP: Espera Beach; GJ: Guarajuba Port; SCAR: Scar reef) (Figure 1). Ten 25 × 25 cm squares, subdivided in 25 smaller squares each, were placed 2 m apart from each other along each transect. In order to sample the variety of algae species present, transects were carried out in three sub-regions (sublittoral, eulittoral and supralittoral zones). For the greatest extent reefs, one to three sub-samples were obtained for each sample point, totalling up to 90 squares per reef. The sampling occurred always at low spring tide between May 2011 and January 2012; some algae specimens were collected for subsequent identification.
To determine turtle presence relative to vegetation cover stationary point counts were used through scanning methodology from seven land stations. This method consists of counting the number of times the head of one or several individuals appeared above water (López-Mendilaharsu et al., Reference López-Mendilaharsu, Estrades, Caraccio, Calvo, Hernández, Quirici, Menafra, Rodríguez-Gallego, Scarabino and Conde2006). The stations were located where the local topography (e.g. sand dunes, beach scarps) allowed the observation of the reef flats. All counts were carried out by the same observer in the same dates as the algal cover sampling, during the spring high tides. Each census was conducted during a 3 h period, and consisted of 5-min counts with a 10-min interval between them. Binoculars were not necessary as the observation sites were well within the observer's field of vision (~ 100 m).
Six submerged reef sites were sampled between January 2011 and December 2011 along the study area (BAR: Barracuda Submerged Reef; PTT: Tartaruga Submerged Reef; PIB: Piebus Submerged Reef; CAV: Cavala Submerged Reef; CUR: Curuzu Shipwreck, PIS: Submerged Reef Itacimirim Lagoon) (Figure 1). Two 20 m transects were haphazardly placed on each site, along which ten 25 cm2 squares, subdivided into 25 smaller squares, were placed 2 m apart from each other. The turtle counting was carried out from a 4.5 m inflatable vessel, using the stationary point count methodology before the dives; a 180° vision angle was scanned every 5 min, alternating the sides, therefore adopting the same methodology applied to the reef flats.
The macro-algae were grouped into Rhodophytes, Chlorophytes and Ochrophytes. A simple linear regression was used to evaluate the relationship of the total per cent algal cover on the average number of turtle sightings, given that at least three samplings were conducted at each place. The data were log base 10 transformed and a 0.05 significance level was adopted. Additionally, similarity analysis (ANOSIM) was used to examine potential differences amongst the reef flats based on the per cent cover of different species using the Bray–Curtis distance. The vegan package of R (version 2.15.1; R Development Core Team, 2011; Oksanen et al., Reference Oksanen, Blanchet, Kindt, Legendre, Minchin, O'Hara, Simpson, Solymos, Henry, Stevens and Wagner2011) and Primer 5.0 were used to run the analysis.
Diet analysis
From May 2010 to May 2013, 22 intact stomachs of dead turtles found in good condition were collected along the study area. All stomach contents were immediately frozen. The algal morphotypes were separated and preserved at 4% buffered formalin solution. The food items were identified to the lowest possible taxonomic level at LAMAR (Marine Algae Laboratory) in the Federal University of Bahia. The frequency occurrence (FO) of diet items was calculated as follows:
 $${\rm FO} = N \times 100/{\rm Nt}$$
where, N, Number of samples containing diet item; Nt, Total number of samples.
Activity patterns
Potential differences on the turtles’ foraging activity during distinct time periods were assessed for three reef flats out of the seven locations sampled for algal cover. These sites were selected based on the accessibility during spring high tides and presence of strategic viewpoints to observe turtle's activities.
The sampling was carried out on four time intervals (morning: 06:00 to 08:00; midday: 12:00 to 14:00; mid afternoon: 14:00 to 16:00 and late afternoon: 16:00 to 18:00), always during the spring high tides. Six replicates were obtained for each time interval on the three reefs, each one consisting of five 5-min counts on average with 10 min interval between the counts. To preserve data independence, all sampling was carried out on different days, totalling 72 observations. The visual surveys were conducted during 2011 from land stations on the beach (Figure 1). To verify the relationship of the time intervals on the average number of turtle sightings an ANOVA was performed considering the sampled reef flats (PG, PESP and PB) as fixed factors with three levels. The time intervals were also considered as fixed factors with four levels. When significant differences amongst the averages were found, a post-hoc Tukey test was conducted. The analysis was carried out using R (version 2.15.1).
RESULTS
Size frequency distribution and growth rates
From June 2009 to December 2013, a total of 322 green turtles were captured, 44 of which were recaptured at least once (i.e. 42 turtles were captured twice and 2 turtles captured three times). The interval between captures varied from 7 to 1218 days (mean = 425). The average CPUE was 1.88 captures/h. Curve carapace length (CCL) of the individuals ranged between 32.9 and 122.5 cm (mean = 63.1, SD = 20.7 cm). The weight of the immature turtles ranged from 5.0 to 82.6 kg (N = 287) while the weight of the adults ranged from 87.0 to 227.8 Kg (N = 35).
Among the 44 recaptured turtles, a subset of 22 had recapture intervals ≥9 months, which resulted in growth rate measurements (Table 1). Initial CCLs ranged from 37.3 to 75.6 cm. A gradual increase in growth rates was observed in turtles with 30.0–69.9 cm CCL, followed by a decrease in animals with 70.0–79.9 cm CCL (Table 1). Generally, the turtles increased in size (y = 0.0038 × x + 2.621, r 2 = 0.22) and weight (y = 0.0143 × x−1.093, r 2 = 0.54) between captures (Figure 2A, B). The annual growth rate amongst the recaptured turtles varied between 1.37 and 5.28 cm year−1 (mean = 3.03 ± 1.18 cm year−1; N = 22).
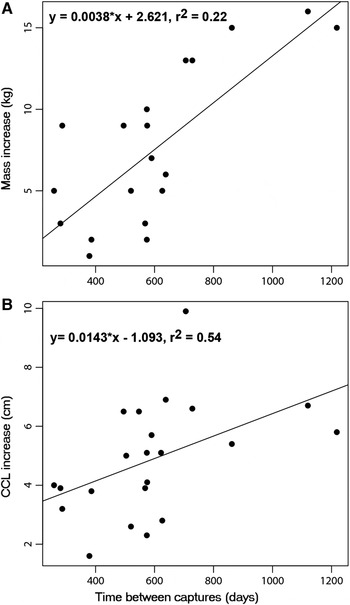
Fig. 2. Mass (A) and size (B) increase of green turtles recaptured at the Tartaruga submerged reef (PTT) in Praia do Forte, Bahia.
Table 1. Size-specific growth rates for Chelonia mydas recaptured at the Tartaruga submerged reef PTT (N = 22).

CCL, curved carapace length; SD, standard deviation; N, number of turtles.
There were significant size differences (P < 0.001) among foraging aggregations in Brazil; only Espírito Santo (ES) and São Paulo (SP) aggregations were not significantly different between each other (P > 0.05) (Figure 3). At the SP and ES aggregations, adults were absent and juveniles accounted for 100% of all turtles; while adult-size individuals in Ceará (CE) and Bahia (BA) corresponded to 2 and 11% of the foraging aggregation, respectively (Figure 4).

Fig. 3. Result of the pair-wise permutation test for the different aggregations in terms of size composition of C. mydas. H0: Null hypothesis; bars indicate 95% confidence intervals. CE, Ceará; BA, Bahia; ES, Espírito Santo and SP, São Paulo aggregations.

Fig. 4. Size class frequency distribution of C. mydas along different foraging aggregations in Brasil. ES: Espírito Santo (A), SP: São Paulo (B), BA: Bahia (C), CE: Ceará (D). Minimum adult size is indicated by a dashed line. CCL: curve carapace length (cm).
Resource availability and turtle distribution
Forty-four algae species were identified along the study area (Supplementary Tables S1 & S2). The average per cent cover of macro-algae on the reef flats was 53.8 ± 9.0%. The species with highest average per cent cover were the red algae Palisada papillosa (average ± SD = 15.2 ± 6.2) and Gelidiella acerosa (9.8 ± 5.6) which were present across all sites. Similarity analysis was significant for the general model (ANOSIM, P < 0.05; R = 0.124) due mainly to the highest percentage of brown algae on the SCAR reef flat in relation to the PG (P < 0.01), ESP (P < 0.05) and GJ (P < 0.01) sites, which were not significantly different from each other. The most geographically distant reef flat (SCAR) was also the most different in terms of species composition (Supplementary Table S1; Supplementary Figure S1). Macro-algae were only found on three of the six sampled submerged reefs, being PIS the one that showed the highest per cent cover (Supplementary Table S2).
The number of sightings of turtles increased with macro-algae abundance (r 2 = 0.34, F 2,13 = 5.59, P < 0.05) mainly due to the increase in the per cent cover of Rhodophytes (r 2 = 0.40, F 2,13 = 7.21, P < 0.05) (Figure 5).

Fig. 5. Number of turtle sightings in relation to per cent cover of algae (A) and major algal groups such as Rhodophyta (B), Chlorophyta (C), Ochrophyta (D) along the 13 sample points. Stars denotes the submerged reefs (PTT, Tartaruga Reef; PIB, Piebus Reef; CAV, Cavala Reef; CUR, Curuzu Shipwreck, PIS, Itacimirim Lagoon Reef, BAR, Barracuda Reef) and black circles indicate Reef Flats (PG: Papa Gente, FAR: Praia do Forte Lighthouse; PB, Baixo Port; PESP, Itacimirim Beach; ESP, Espera Beach; GJ, Guarajuba Port; SCAR, Scar reef).
Diet composition
The mean CCC of stranding turtles captured was 40.62 ± 17.53 cm (range: 26.5–113 cm). Algae were found to be the main diet component of the surveyed turtles. Stomach contents comprised 24 species of algae, 20 of which were Rhodophyta. The most frequent algae species in the gut samples were Gelidiela acerosa (68.2%) Hypnea musciformis (59.1%) and Gelidium coarctatum (50%) (Supplementary Table S3).
Activity patterns
There were significant differences on the average number of turtle sightings across the different time intervals (F 1,4 = 13,834, P < 0.001) (Supplementary Table S4), although there was considerable variation amongst the sampled sites (Figure 6). On reef flat PG the number of sightings was significantly higher during the afternoon, with a peak between 16–18 h (Figure 6). Reef flat PESP and PB did not show significant differences between time intervals (P > 0.05) (Supplementary Table S4), although on reef flat PESP the number of sightings was higher after midday (12–18 h). In general, all reef flats showed a lower average of sightings during the morning. Reef flat PB had the lowest number of sightings.

Fig. 6. Number of turtle sightings (mean ± SD) of green turtles at different time intervals as a measure of activity patterns for each of the sampled reef flats. PG, Papa Gente; PB, Baixo Port; PESP, Itacimirim Beach.
DISCUSSION
Size frequency distribution and growth rates
The northern coast of Bahia hosts a mixed aggregation of immature and adult green turtles, indicating that in the Atlantic green turtles from all size classes can co-occur on the same foraging ground. Mixed areas, composed of immature and mature individuals, have been observed at a number of sites in the Pacific (Limpus et al., Reference Limpus, Couper and Read1994; Seminoff et al., Reference Seminoff, Resendiz and Nichols2002a) however in the Atlantic there were no records of juvenile and adult foraging range overlapping (Meylan et al., Reference Meylan, Meylan and Gray2011).
Areas composed solely of immature individuals have been observed on many Caribbean islands (Meylan et al., Reference Meylan, Meylan and Gray2011), Florida (Bresette et al., Reference Bresette, Witherington, Herren, Bagley, Gorham, Traxler, Crady and Hardy2010) and all through subtropical and temperate waters of South America (Gallo et al., Reference Gallo, Macedo, Giffoni, Becker and Barata2006; Nagaoka et al., Reference Nagaoka, Bondiolli and de A. Monteiro-Filho2008; Torezani et al., Reference Torezani, Baptistotte, Mendes and Barata2010) while foraging grounds for subadults and adults have been also identified in Nicaragua (Bass et al., Reference Bass, Lagueux and Bowen1998), the Guajira Peninsula in Venezuela (Carr et al., Reference Carr, Carr and Meylan1978) and Florida (Bresette et al., Reference Bresette, Witherington, Herren, Bagley, Gorham, Traxler, Crady and Hardy2010), suggesting the existence of separated foraging areas for juveniles and adults in the Atlantic (Meylan et al., Reference Meylan, Meylan and Gray2011).
Although the northern coast of Bahia is dominated by medium-size individuals and adults comprise 11% of the green turtles in the area this study demonstrates the importance of in-water Capture-Mark-Recapture (CMR) studies to properly characterize the size distribution and abundance of sea turtles along foraging areas. Data from stranding records alone may provide limited information because mortality sources can be biased towards certain size classes (Meylan et al., Reference Meylan, Meylan and Gray2011).
Green turtles captured in Bahia included a wide range of sizes, from small juveniles to adult individuals, similar to what was observed in Ceará. However, a larger proportion of small juveniles (30–50 cm) were found in Ceará and larger individuals (40–80 cm) in Bahia. In addition, in Bahia the number of adults represented 11% of the sample while in Ceará this was 2%. The placing of weirs in Ceará in areas closer to the shore in the past few years, may be capturing smaller turtles which may account for the observed differences in sizes (E. Lima, personal communication), however, this needs further research. The other two foraging aggregations (SP and ES) were composed of immature individuals, mainly small juveniles in the 30–40 cm size range (Gallo et al., Reference Gallo, Macedo, Giffoni, Becker and Barata2006; Torezani et al., Reference Torezani, Baptistotte, Mendes and Barata2010) similar to other areas in southern Brazil (Nagaoka et al., Reference Nagaoka, Bondiolli and de A. Monteiro-Filho2008; Guebert-Bartholo et al., Reference Green2011; Reisser et al., Reference Reisser, Proietti, Sazima, Kinas, Horta and Secchi2013).
In Brazil, the main C. mydas nesting areas are located on oceanic islands; especially at Rocas Atoll, Fernando de Noronha Island and Trindade Island (Figure 1). To date, eight adult females tagged on Trindade Island and one tagged at Rocas Atoll have been recaptured along the north coast of Bahia (SITAMAR – unpublished data). Two of these nesting females tagged in Trindade Island and recaptured in Praia do Forte, Bahia, were seen again in the island in subsequent nesting seasons, confirming round-trip migrations between nesting and foraging areas in Brazil. Furthermore, one of the adult green turtles tagged during the present study was observed nesting in Trindade Island 7 months after being captured at Praia do Forte-BA. This brings further evidence about the connectivity between the two areas and that Bahia serves as a foraging ground for at least two of the main green turtle breeding grounds in Brazil. Knowledge of the complex relationships among nesting sites and foraging areas is crucial for understanding population-level impacts of anthropogenic threats, as well as designing effective conservation actions (Bolker et al., Reference Bolker, Okuyama, Bjorndal and Bolten2007).
Differences in growth rates among populations and individuals might be attributed to factors intrinsic to an individual (e.g. sex, genotype and health status) and environmental factors (e.g. water temperature, food quality and availability, year and turtle density) (Van Dam, Reference Van Dam, Eckert, Bjorndal, Abreu-Grobois and Donnely1999; Kubis et al., Reference Kubis, Chaloupka, Ehrart and Bresette2009). The mean annual growth rate recorded in the present study (3.03 cm year−1) was greater than the reported rates in some areas in the Pacific (Balazs & Chaloupka, Reference Balazs and Chaloupka2004; López-Castro et al., Reference López-Castro, Koch, Loza and Nichols2010; Seminoff et al., Reference Seminoff, Resendiz, Nichols and Jones2002b), whereas it was slightly lower than areas in Caribe (Bjorndal et al., Reference Bjorndal, Bolten and Chaloupka2000; McMichael et al., Reference McMichael, Seminoff and Carthy2008). Data on annual growth rates in the South-west Atlantic are very limited preventing some comparisons. In Brazil, similar growth rates (e.g. 3.1 cm year−1) were recorded in Espírito Santo (20°S latitude) (Torezani et al., Reference Torezani, Baptistotte, Mendes and Barata2010) whereas in Fernando de Noronha (3° S latitude) were slightly lower (i.e. 2.6 cm year−1) (Colman et al., Reference Colman, Patrício, McGowan, Santos, Marcovaldi, Bellini and Godley2014). Calculated growth rates in Espírito Santo (ES) were restricted to small juveniles (i.e. 27–47 cm) while the present study included animals from 30 to 80 cm. Thus comparing growth rates among the small size classes of green turtles in ES indeed showed higher growth rates. Green turtles in ES were captured at an effluent discharge channel with relatively high water temperatures (mean = 32°C) compared with the surrounding water (mean = 23.5°C) (Torezani et al., Reference Torezani, Baptistotte, Mendes and Barata2010) which may influence the rate of growth due to higher metabolic demands associated with elevated water temperatures (Mendonça, Reference Mendonça1983; Hazel et al., Reference Hazel, Lawler and Hamann2009). On the other hand the slower growth rates recorded in the island of Fernando de Noronha have been attributed to high mean annual abundance, suggesting density-dependent effects (Colman et al., Reference Colman, Patrício, McGowan, Santos, Marcovaldi, Bellini and Godley2014).
Foraging ecology
In general, the mean number of turtle sightings along the surveyed reefs increased along with the availability of algae, particularly red algae, which may suggest that Chelonia mydas forage in places that offer greater abundance of palatable algae. For instance, some of the most abundant red algae present along the study area (e.g. Gelidiella acerosa, Acantophora spicifera, Pterocladiella sp., Hypnea sp.) have been reported as part of the diet of green turtles (e.g. Sazima & Sazima, Reference Sazima and Sazima1983; López-Mendilaharsu et al., Reference López-Mendilaharsu, Gardner, Seminoff and Rodriguez2005; Fuentes et al., Reference Fuentes, Lawler and Gyuris2006; Arthur & Balazs, Reference Arthur and Balazs2008; Guebert-Bartholo et al., Reference Green2011). The analysis of gut contents in the present study also showed the preference of green turtles by red algae, and indicated that the most frequent food items consumed by the turtles (i.e. Gelidiella acerosa and Hypnea sp.) were among the most abundant along the area (Supplementary Table S1). Acantophora spicifera was abundant on reef flats but not frequently found in green turtle gut samples, showing that C. mydas is selective (Gilbert, Reference Gilbert2005; Fuentes et al., Reference Fuentes, Lawler and Gyuris2006; Guebert-Bartholo et al., Reference Green2011; Reisser et al., Reference Reisser, Proietti, Sazima, Kinas, Horta and Secchi2013).
High numbers of turtles were sighted at PG and PESP reef flats. Despite having similar algae composition and availability, PB, ESP and FAR reefs showed low numbers of turtles (Figure 5; Supplementary Table S1). There is an intensive human activity along the latter reefs, including fishing with gill nets and cast nets, boat traffic and other recreational activities (e.g. spear fishing, scuba diving, banana-boats and jet-skis), which may result in the turtles avoiding these reefs when foraging (e.g. Balazs et al., Reference Balazs, Forsyth and Kam1987; Seminoff et al., Reference Seminoff, Resendiz and Nichols2002a).
It is known that green turtles forage preferably in depths shallower than 12 m (Mortimer, Reference Mortimer1981; Fuentes et al., Reference Fuentes, Lawler and Gyuris2006), since the best foraging areas for marine herbivores are found at those depths (Ogden & Lobel, Reference Ogden and Lobel1978). In the present study, the average depth on the sampled reef flats was 4 m, so this may explain the low number of turtles sightings at shallow reef flats (<4 m) such as PB and FAR and a high number of turtles sightings at the deepest reef flats such as PESP and PG (Figure 5).
Despite having a relatively small algal cover, the submerged reef PTT showed a high number of turtles when compared with the other sampled sites (Figure 5). PTT is located in close proximity to the PG reef flat, which showed the highest average number of sightings among the coastal reef flats. Thus, it is possible that turtles foraging at PG use this submerged reef, located in close proximity, for resting. Observations made during a nocturnal scuba diving survey showed that this submerged reef serves as a resting site for green turtles (A.J. personal observation). This may indicate that the turtles save energy by choosing resting places which are nearest to abundant food resources, as noted in Hawaii by Balazs et al. (Reference Balazs, Forsyth and Kam1987).
Given that the reef flats are inaccessible during low tide, the turtles may seek other areas for foraging or refuge, as previously reported in other sites (Bjorndal, Reference Bjorndal1980; Mortimer, Reference Mortimer1981; Ogden et al., Reference Ogden, Robinson, Whitlock, Daganhardt and Cebula1983; Balazs et al., Reference Balazs, Forsyth and Kam1987). In northern coast of Bahia, turtles probably use the submerged reefs which are near to the coast to rest given that the availability of macro-algae was minimal on submerged reefs more distant from the coast (Supplementary Table S3). In the deeper waters, the turtles may also be seeking for temporary ‘cleaning stations’, as has been observed in Fernando de Noronha-PE (Sazima et al., Reference Sazima, Grossman, Bellini and Sazima2004) and in Bahia (Maia-Nogueira et al., Reference Maia-Nogueira, Medeiros, Jardim, Nunes and Sampaio2010).
Activity patterns
Green turtles were more active during the afternoon than in the morning, especially in reef flat PG where the turtles’ activity increased significantly during late afternoon, as corroborated by studies on the circadian cycle (Bjorndal, Reference Bjorndal1980; Ogden et al., Reference Ogden, Robinson, Whitlock, Daganhardt and Cebula1983), although those studies also indicated intense activity between 8:00 and 10:00 h. Similarly, a study carried out in south-eastern Brazil observed a higher percentage of green turtles foraging in the afternoon period (Meurer et al., Reference Meurer, Pereira, Pereira, Fajardo and Oliveira2008).
It was expected that a larger number of individuals would be foraging during the early morning hours, since turtles are most active in cooler water temperatures (Mendonça, Reference Mendonça1983). In the present system, where there is little variation in water temperature throughout the day, and access to resources is directly influenced by the tides, the latter apparently becomes preponderant. As our data were collected during the high spring tides, and the surveyed reef flats were inaccessible for turtles between 08:00 and 11:00 h, this time interval could not be compared with previous studies (e.g. Bjorndal, Reference Bjorndal1980; Ogden et al., Reference Ogden, Robinson, Whitlock, Daganhardt and Cebula1983). In the Indian Ocean, radio-monitored turtles showed increased foraging-related activities during the afternoon, but intense activity was also registered during the early morning period (Taquet et al., Reference Taquet, Taquet, Dempster, Soria, Ciccione, Roos and Dagorn2006). Tides can prevent access of the turtles to certain areas and several authors have noted that green turtles occur all over the seagrass or algae banks throughout the day as long as the duration of high tide (Fuentes et al., Reference Fuentes, Lawler and Gyuris2006; Taquet et al., Reference Taquet, Taquet, Dempster, Soria, Ciccione, Roos and Dagorn2006; Ballorain et al., Reference Ballorain, Ciccione, Bourjea, Grizel, Enstipp and Georges2010). Periods of low surface activities during the middle of the day have been associated with turtles adopting resting behaviour (Ogden et al., Reference Ogden, Robinson, Whitlock, Daganhardt and Cebula1983).
Conservation implications
Nutrient acquisition strategies are among the most important components of sea turtle life history influencing key demographic parameters such as somatic growth, age at maturity and time of reproductive migrations (Jones & Seminoff, Reference Jones, Seminoff, Wyneken, Musick and Lohmann2013). Reefs fringes in the northern coast of Bahia host an enormous variety of marine fauna and flora that provide feeding and resting habitats for adult and juvenile green turtles. The presence of adults also underscores the importance of these foraging grounds as adults usually migrate long distances to reach profitable habitats to allocate energy for reproduction (Okuyama et al., Reference Okuyama, Nakajima, Noda, Kimura, Kamihata, Kobayashi, Arai, Kagawa, Kawabata and Yamada2013). More research into the movements of turtles from this aggregation and genetic studies with large sample size would help to clarify the connectivity among foraging grounds in the South Atlantic (Colman et al., Reference Colman, Patrício, McGowan, Santos, Marcovaldi, Bellini and Godley2014) and major rookery sources to turtles from all life stages.
The fact that the northern coast of Bahia hosts a mixed aggregation of immature and adult green turtles advances our knowledge on how green turtles aggregate according to their size/age in Brazil. Additionally, the recent information on adult migrations which linked Trindade Island and Praia do Forte-BA in Brazil highlights the importance of tropical coastal habitats (e.g. reefs) for the conservation of green turtles.
Sea turtles are susceptible to human impacts at every life stage, from egg to hatchling, juvenile to adult, thereby placing them among the most conservation dependent of marine taxa (Hamann et al., Reference Hamann, Godfrey, Seminoff, Arthur, Barata, Bjorndal, Bolten, Broderick, Campbell, Carreras, Casale, Chaloupka, Chan, Coyne, Crowder, Diez, Dutton, Epperly, FitzSimmons, Formia, Girondot, Hays, Cheng, Kaska, Lewison, Mortimer, Nichols, Reina, Shanker, Spotila, Tomás, Wallace, Work, Zbinden and Godley2010). The implementation of management policies for fisheries and nautical tourism in the region is highly recommended, alongside effective enforcement of the legislation regarding predatory actions on reef environments. Protected Areas in Brazil are divided into two main categories: (1) full protection, where no use of natural resources is allowed; and (2) sustainable use, which allows the sustainable use of part of their resources. Along the northern coast of Bahia a sustainable use MPA extends to 15 km offshore from the coast. However, due to resource limitations, many of these sites lack monitoring and enforcement, which prevents an effective protection of these critical habitats (Magris et al., Reference Magris, Mills, Fuentes and Pressey2013). In this way, the creation of a more restrictive MPA strengthening the policies of the current one is strongly encouraged. The establishment of exclusion zones (leisure and fishing), particularly among those areas with higher abundance of favourable food items for the turtles (such as PESP and PG, Supplementary Figure S1), would contribute to safeguard fundamental ecological processes (e.g. green turtle grazing and nutrient recycling) and reduce the incidental capture by coastal fishing activities.
SUPPLEMENTARY MATERIAL
To view supplementary material for this article, please visit http://dx.doi.org/10.1017/S0025315415001629
ACKNOWLEDGEMENTS
We thank all the staff of PPGEcoBio. Dr E. R. Secchi and Dr C. L. S. Sampaio gave valuable comments on the first draft of the manuscript. My special thanks to Dr J. M. Nunes for algae identification, to Gringos Turismo for lending scuba diving equipment, to G. Maurutto for his valuable help with the maps and to all the staff at Projeto TAMAR – Praia do Forte for the help with data collection and logistic support. We thank Luena Fernandes for the English revision.
FINANCIAL SUPPORT
F.B. was supported by CNPq fellowships (Proc. N. 303897/2011-2; 239978/2012-9). A.J. received a scholarship from CAPES.