


Introduction
Copepod distribution patterns are influenced by environmental, biological and ecological processes, producing changes in richness, abundance and trophic structure (Michele & Foyo, Reference Michele and Foyo1976; Folt & Burns, Reference Folt and Burns1999; Huskin et al., Reference Huskin, Anadon, Medina, Head and Harris2001). Most of these animals live at the mercy of currents for both horizontal and vertical movement; however, some have the ability to move freely in the water column, grouping in patches and making diurnal and nocturnal vertical migrations (Folt & Burns, Reference Folt and Burns1999).
It has been estimated that more than 52% of the variation in marine plankton structure is due exclusively to physical and chemical processes in the water column such as temperature, salinity and dissolved oxygen (Folt & Burns, Reference Folt and Burns1999). These serve as specific regulators, directly conditioning processes such as vertical migration, predation, metabolism and reproduction (Steele, Reference Steele, Cushing and Walsh1976; Folt & Burns, Reference Folt and Burns1999; Cifuentes et al., Reference Cifuentes, Torres-García and Frías M2000; Huskin et al., Reference Huskin, Anadon, Medina, Head and Harris2001), as well as the presence or absence of some species in certain regions (Pinel-Alloul, Reference Pinel-Alloul1995; Gasca et al., Reference Gasca, Segura, Suárez-Morales, Gasca and Suárez1996; Currie et al., Reference Currie, Claereboudt and Roff1998).
Studies conducted in oceanic waters of Colombia that also include deep-water ecosystems (mesopelagic and bathypelagic) beyond 500 m depth are scarce (Medellín-Mora & Martínez-Ramírez, Reference Medellín-Mora, Martínez-Ramírez, Navas, Segura-Quintero, Garrido-Linares, Benavides-Serrato and Alonso2010; Gutiérrez-Salcedo, Reference Gutiérrez-Salcedo2011; Medellín-Mora et al., Reference Medellín-Mora, Escribano, Schneider, Correa-Ramírez and Campos2018). These studies highlight the high abundance and diversity of the copepod assemblage, its vertical structure, trophic habits, and the close relationship of distribution and abundance with cyclonic and anticyclonic circulation patterns (Panama-Colombia Gyre and mesoscale structures) and water column structure. Integrating this information is key because it allows us to determine how oceanographic processes condition assemblages in tropical oceanic waters, helping to understand and describe local, regional and global behaviour.
The Caribbean Oceanic ecoregion (CAO) is defined by characteristic natural attributes that give it a particular environmental and landscape identity, especially its oceanic waters, deep soft bottoms and predominantly pelagic organisms that live in the water column (INVEMAR, 2000; Díaz & Acero, Reference Díaz and Acero2003). The climatological and oceanographic classification proposed by Bastidas-Salamanca et al. (Reference Bastidas-Salamanca, Ricaurte-Villota, Santamaría-del-Angel, Ordoñez-Zúñiga, Murcia-Riaño, Romero-Rodríguez, Bastidas-Salamanca and Ricaurte-Villota2017) includes climatic stability produced by the high frequency of the north-east trade winds and the latitudinal oscillation of the Intertropical Convergence Zone between the months of November and May. The frequency of winds decreases from June to October, which is the hurricane and tropical storm season in the tropical South-west Atlantic (Bernal et al., Reference Bernal, Poveda, Roldán and Andrade2006; Ortiz, Reference Ortiz2007; Andrade, Reference Andrade2015; Velandia-Bohórquez et al., Reference Velandia-Bohórquez, Ricaurte-Villota, Bastidas-Salamanca, Murcia-Riaño, Romero-Rodríguez, Ordoñez-Zúñiga, Bastidas-Salamanca and Ricaurte-Villota2017).
The marine circulation of the CAO ecoregion is dominated by the effects of the North Equatorial current coming from the Atlantic Ocean and entering the Caribbean Basin through the arc of the Antilles. It is called the Caribbean Current, which drifts towards the north-west sector; the Venezuelan basin communicates with the Colombian Basin through the Aruba Passage, with a threshold of 4000 m in the north-east zone (López & Mesa, Reference López and Mesa1984; Hernández-Guerra & Joyce, Reference Hernández-Guerra and Joyce2000; Ruiz-Ochoa, Reference Ruiz-Ochoa2011; Bastidas-Salamanca et al., Reference Bastidas-Salamanca, Ricaurte-Villota, Santamaría-del-Angel, Ordoñez-Zúñiga, Murcia-Riaño, Romero-Rodríguez, Bastidas-Salamanca and Ricaurte-Villota2017). These circulation patterns, geomorphological features and local processes such as the La Guajira upwelling, inland water discharges from the Magdalena River and the Panama-Colombia counter-current modulate the oceanic environment and have an effect on the structure of the water column, causing copepod assemblages to change from one location to another (Andrade & Barton, Reference Andrade and Barton2005; Medellín-Mora & Martínez-Ramírez, Reference Medellín-Mora, Martínez-Ramírez, Navas, Segura-Quintero, Garrido-Linares, Benavides-Serrato and Alonso2010; Gutiérrez-Salcedo, Reference Gutiérrez-Salcedo2011; Medellín-Mora et al., Reference Medellín-Mora, Escribano, Schneider, Correa-Ramírez and Campos2018).
Studying this complex oceanic ecological system is important because the copepod assemblage is sensitive to changes in the environment, which allows some species to be indicators of hydrographic processes such as upwelling events, presence of marine currents and water masses, mainly due to their life strategies, high species diversity, density of individuals and tolerance to environmental stress. This explains distribution patterns in epipelagic ecosystems; the vertical distribution of the copepod assemblage can be defined by the characteristics of the water mass they inhabit, therefore any change may affect this community which is the structuring basis of the pelagic ecosystem, making it a system that deserves special attention (Björnberg, Reference Björnberg1963, Reference Björnberg and Boltovskoy1981; Banse, Reference Banse1964; Boltovskoy, Reference Boltovskoy1999; Gajbhiye, Reference Gajbhiye2002; Longhurst, Reference Longhurst2007; Acha et al., Reference Acha, Piola, Iribarne and Mianzan2015).
This study seeks to characterize vertically the zooplankton community in seven offshore exploration areas. With the data and samples collected we sought to determine the horizontal and vertical distribution patterns in the structure of the epipelagic and mesopelagic copepod assemblage (0–1000 m) of the CAO ecoregion and the oceanographic variables that regulate it. The horizontal distribution of the copepod assemblage and its relationship to temperature, salinity and dissolved oxygen regulators were established to achieve this objective. This study provides relevant information on the structure and abundance of copepods in the Colombian Caribbean offshore waters, providing key data to describe accurately the ecological processes and the different responses to the oceanographic factors that modulate them.
Materials and methods
Study area
The Colombian Caribbean Sea is a semi-closed area surrounded by the land masses of South America and Central America and separated from the Atlantic Ocean by the ridges associated with the arch of the Antilles Islands (Lozano-Duque et al., Reference Lozano-Duque, Medellín-Mora, Navas, Navas, Segura-Quintero, Garrido-Linares, Benavides-Serrato and Alonso2010). The CAO ecoregion is the territorial and Economic Exclusive Zone oceanic waters, which range from 130 to more than 3000 m depth (Díaz & Acero, Reference Díaz and Acero2003). The Caribbean current to the west, the Panama-Colombia counter-current to the east and the deep current of the Caribbean form the principal pattern of circulation, in conjunction with the high mesoscale activity. The weather is determined by its location in the tropical zone, with less evident seasonal periods that are manifested by changes in the patterns of winds and precipitation, and that have been explained mainly by the movements of the Intertropical Convergence Zone (ITCZ) and its influence on the dynamics of the north-east trade winds.
Seven oceanographic expeditions were carried out in oceanic waters of the Colombian Caribbean Sea during 2013 and 2018: COL 1, GUAOFF 3, COL 2, COL 3, COL 4, COL 5 and COL 10; in each expedition a sector of CAO ecoregion was sampled, mostly during the rainy period (November–December), except COL1 (dry period) (Figure 1).
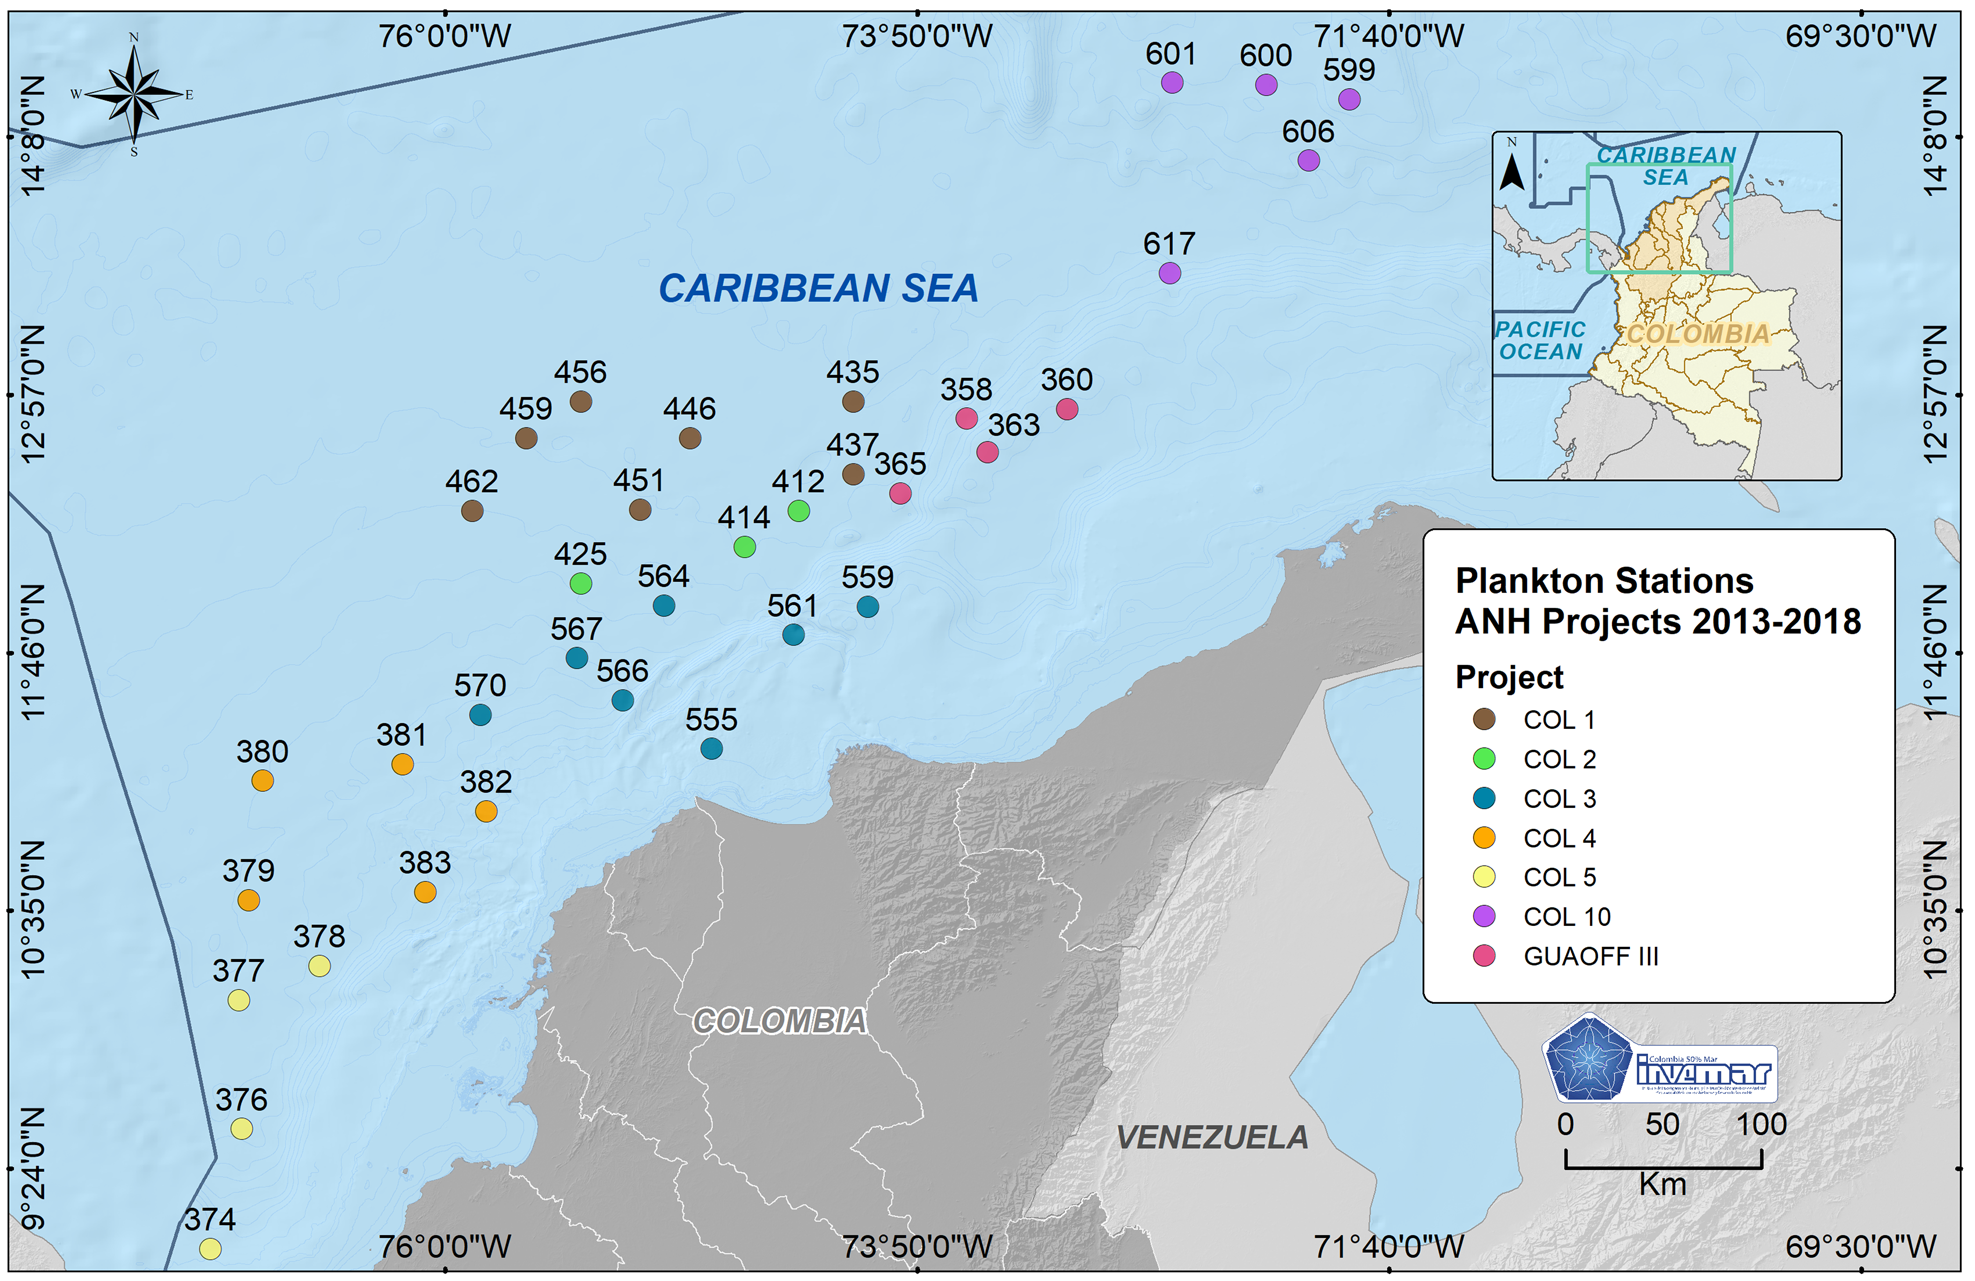
Fig. 1. Location of zooplankton and oceanographic variable sampling stations in the CAO ecoregion of the Colombian Caribbean Sea.
In total 36 stations were sampled; oceanographic data and zooplankton samples were collected in each. Zooplankton were collected with bongo nets of 200 μm and 0.6 m mouth-diameter with a Hydrobios flow meter attached to the mouth to calculate the volume of filtered water. Stratified vertical trawls in four depth ranges (0–60 m, 70–140 m, 170–340 m, 540–1000 m) were made using a General Oceanics open-close system.
The samples of zooplankton were narcotized with magnesium chloride 10% and fixed with normalized formalin 4%, then they were taken to the lab of the Museo de Historia Natural Marina de Colombia (MHMNC) of INVEMAR. In the laboratory, zooplankton samples were fractionated with a Folsom splitter until the subsample contained ~300–500 copepods. Adult copepods were sorted, counted and identified to species whenever possible (Björnberg, Reference Björnberg1963, Reference Björnberg and Boltovskoy1981; Bradford-Grieve et al., Reference Bradford-Grieve, Markhaseva, Rocha, Abiahy and Boltovskoy1999; Gaviria & Aranguren, Reference Gaviria, Aranguren, Gaviria and Aranguren2003; Boxshall & Hasley, Reference Boxshall and Hasley2004; Razouls et al., Reference Razouls, De Bovée, Kouwenberg and Desreumaux2005–2021).
In situ data of temperature, salinity and dissolved oxygen concentration were obtained for all depths using a high-resolution conductivity/temperature/depth/oxygen (CTDO) profiler (SBE-19 Plus V2 SeaCAT of SeaBird Electronics Inc.). In the laboratory, data quality and cleansing were done with the program SeaBird Data Processing 2.3.0.
Data processing of oceanographic variables and analysis
Oceanographic data were processed with the Gibbs SeaWater (GSW) Oceanographic Toolbox of TEOS-10 (IOC et al., 2010). We used absolute salinity and potential temperature to calculate the stability of the water column, the buoyancy or Brunt-Väisälä frequency and Potential Density Anomalies. Vertical profiles and cross sections of each variable were plotted with the Ocean Data View (ODV) program. The Data Variation Interpolation Analysis (DIVA) tool was used in vertical section. The temperature, salinity and oxygen profiles were validated with a HYCOM (Hybrid Coordinate Ocean Model) reanalysis with high resolution (1/12°) and climatological information obtained from the World Ocean Atlas 2018 with a resolution of 1°. The mixed layer depth (MLD) was estimated for each sampling station using a threshold density value (Δρ = 0.03 kg m−3) from a near-surface depth of 10 m, following the procedure of de Boyer Montégut et al. (Reference de Boyer Montégut, Madec, Fischer, Lazar and Iudicone2004).
To characterize the water masses between 0–1000 m in the CAO ecoregion, conservative temperature (Θ, °C) and absolute salinity (psu) were derived from the CTD data and T-S diagrams were made in the ODV software. Finally, to obtain the percentage contribution of each water body between 0 and 1000 m, a classical Optimal Multiparameter Analysis (OMP) was performed in MATLAB software, following the manuals and routines of Karstensen & Tomczak (Reference Karstensen and Tomczak M1999) and Karstensen (Reference Karstensen2020). We used the interactive mode and characteristic water types from secondary information (Table 1). The data were extracted and plotted in the Ocean Data View Program version 5.2.1.
Table 1. References for the identification and characterization of the south-western Atlantic water masses present in the Colombian Caribbean Sea

Biotic assemblage analysis
A multivariate analysis was done with the statistical package PRIMER v.7.0.13 (Clarke & Gorley, Reference Clarke and Gorley2015) to evaluate the structure of the copepod assemblage. Horizontal (stations) and vertical (depth range) spatial patterns were analysed from a matrix of species and population density data standardized in individuals per cubic meter (ind. m−3) (Boltovskoy, Reference Boltovskoy1999). Data were first fourth root-transformed using the method of Taylor (Reference Taylor1961) and a resemblance matrix was calculated based on the Bray–Curtis similarity coefficient (Bray & Curtis, Reference Bray and Curtis1957; He, Reference He1999), then a non-metric multidimensional scaling ordination (n-MDS) was performed. The significant differences of clusters found in the nMDS were found using a multivariate one-way similarity analysis (ANOSIM) (Ludwig & Reynolds, Reference Ludwig and Reynolds1988; Clarke & Gorley, Reference Clarke and Gorley2015). Finally, a SIMPER similarity percentage analysis was carried out to determine which copepod species contributed more to the formation of each cluster (Clarke & Warwick, Reference Clarke and Warwick1998, Reference Clarke and Warwick1999, Reference Clarke and Warwick2001).
To determine the preferred or most likely depth of copepods in water column, the most common species which accumulated 70% of the total individuals in the entire water column were selected and the weighted average depth (WMD) was calculated using the following equation:

where xi is the density of species per m3 at a given depth, t is the thickness of the stratum (range of depth) and z is the depth of a sample (centre of the depth interval) (Worthington, Reference Worthington1931; Andersen et al., Reference Andersen, Devey, Gubanova, Picheral, Melnikov, Tsarin and Prieur2004; Hampton et al., Reference Hampton, Gray, Izmest, Moore and Ozersky2014). The range of distribution, maximum and minimum depth of capture of each species was also determined.
Environmental and copepod assemblages analysis
Finally, to evaluate the relative contribution of each oceanographic variable to the structure of the copepod assembly of the CAO ecoregion, a multivariate analysis was performed using a Distance-based Linear Model (DistLM). The similarity matrix of the biological data and the standardized matrix of the oceanographic variables were used, and a stepwise selection procedure and an Akaike selection criterion (AICc) were performed with the PRIMER v. 7.0.13 statistical package with the methods offered in the PERMANOVA+ expansion package (Akaike, Reference Akaike1974; McArdle & Anderson, Reference McArdle and Anderson2001; Clarke & Gorley, Reference Clarke and Gorley2015). DistLM results are displayed using Distance Based Redundancy Analysis (dbRDA), in which the model that best explains the variation in the data cloud is plotted (McArdle & Anderson, Reference McArdle and Anderson2001). For the horizontal analysis of the oceanographic data, only the variation of the first 200 m of the water column was taken into account, since it is in this surface layer where the greatest variation of the data occurs, reflecting the trend of the mixing layer and the ocean-atmosphere interaction (Mann & Lazier, Reference Mann and Lazier1995).
Results
Oceanographic variables and analysis
Physical characterization of the CAO ecoregion
Salinity ranged between 37.21 and 25.73, with an average of 36.57 ± 0.005 psu. The lowest values were found in surface layers associated with runoff waters and the maximum values were found between 80 and 200 m (halocline); these values decreased progressively to 1000 m (Figure 2A). The profile of dissolved oxygen in the water column was variable between stations and showed two clusters of stations on the surface (4.5 mg l−1), one with lower oxygen concentrations. The lowest values (<3 mg l−1) were between 400 and 600 m, below this depth oxygen increased again; these stations belong to the central region (Figure 2B). The other group showed values of 5.5–6 mg l−1 on the surface and lower values of 4–4.5 mg l−1 at a depth of 200 m and higher (5 mg l−1) near 1000 m (Figure 2B). The temperature profile between 0 and 1000 m showed a constant decrease with increase in depth, with a mean of 28.12 ± 0.02 °C at the surface and 5.65 ± 0.004 °C near 1000 m; the thermocline was located around 50 m (Figure 2C). The Potential Density Anomaly varied between 18 and 27 kg m−3, with lower values above 200 m which increased with depth; it was very stable at depths below 300 m, where the potential density reached values of 27.2 kg m−3 (Figure 2D).

Fig. 2. Vertical profiles of the oceanographic variables analysed in the offshore system of the Colombian Caribbean Sea between 0–1000 m. (A) Salinity (psu). (B) Dissolved oxygen (mg l−1). (C) Temperature (°C) and (D) potential density anomalies (kg m−3).
The vertical section of temperature showed a stratified pattern in offshore waters, with values between 30.31 °C at the surface and 4.98 °C at 1000 m depth. In the north-east section between 73.5 °W and 72 °W the thermocline was deeper (~300 m) in comparison with the central and south-west regions in which the thermocline was at 200 m (Figure 3A). The salinity and potential density sections showed similar behaviour with a marked stratification in the water column, with deeper halocline and pycnocline in the north-east region (Figure 3B, C). The lowest values of salinity (<35 psu) were in surface oceanic waters of the central region. The vertical section of dissolved oxygen showed similar behaviour in the south-west and north-east regions, with high values at the surface (>6 mg l−1) that decreased with depth; between 300 and 800 m the oxygen decreased to 3.5 mg l−1, then increased again below this depth. In the central section the concentrations were lower than in the other zones; values of 4 mg l−1 were recorded in the first 50 m, below this depth the lowest values of oxygen were recorded from ~150–800 m, with a minimum of 2.65 mg l−1 near 500 m (Figure 3C).
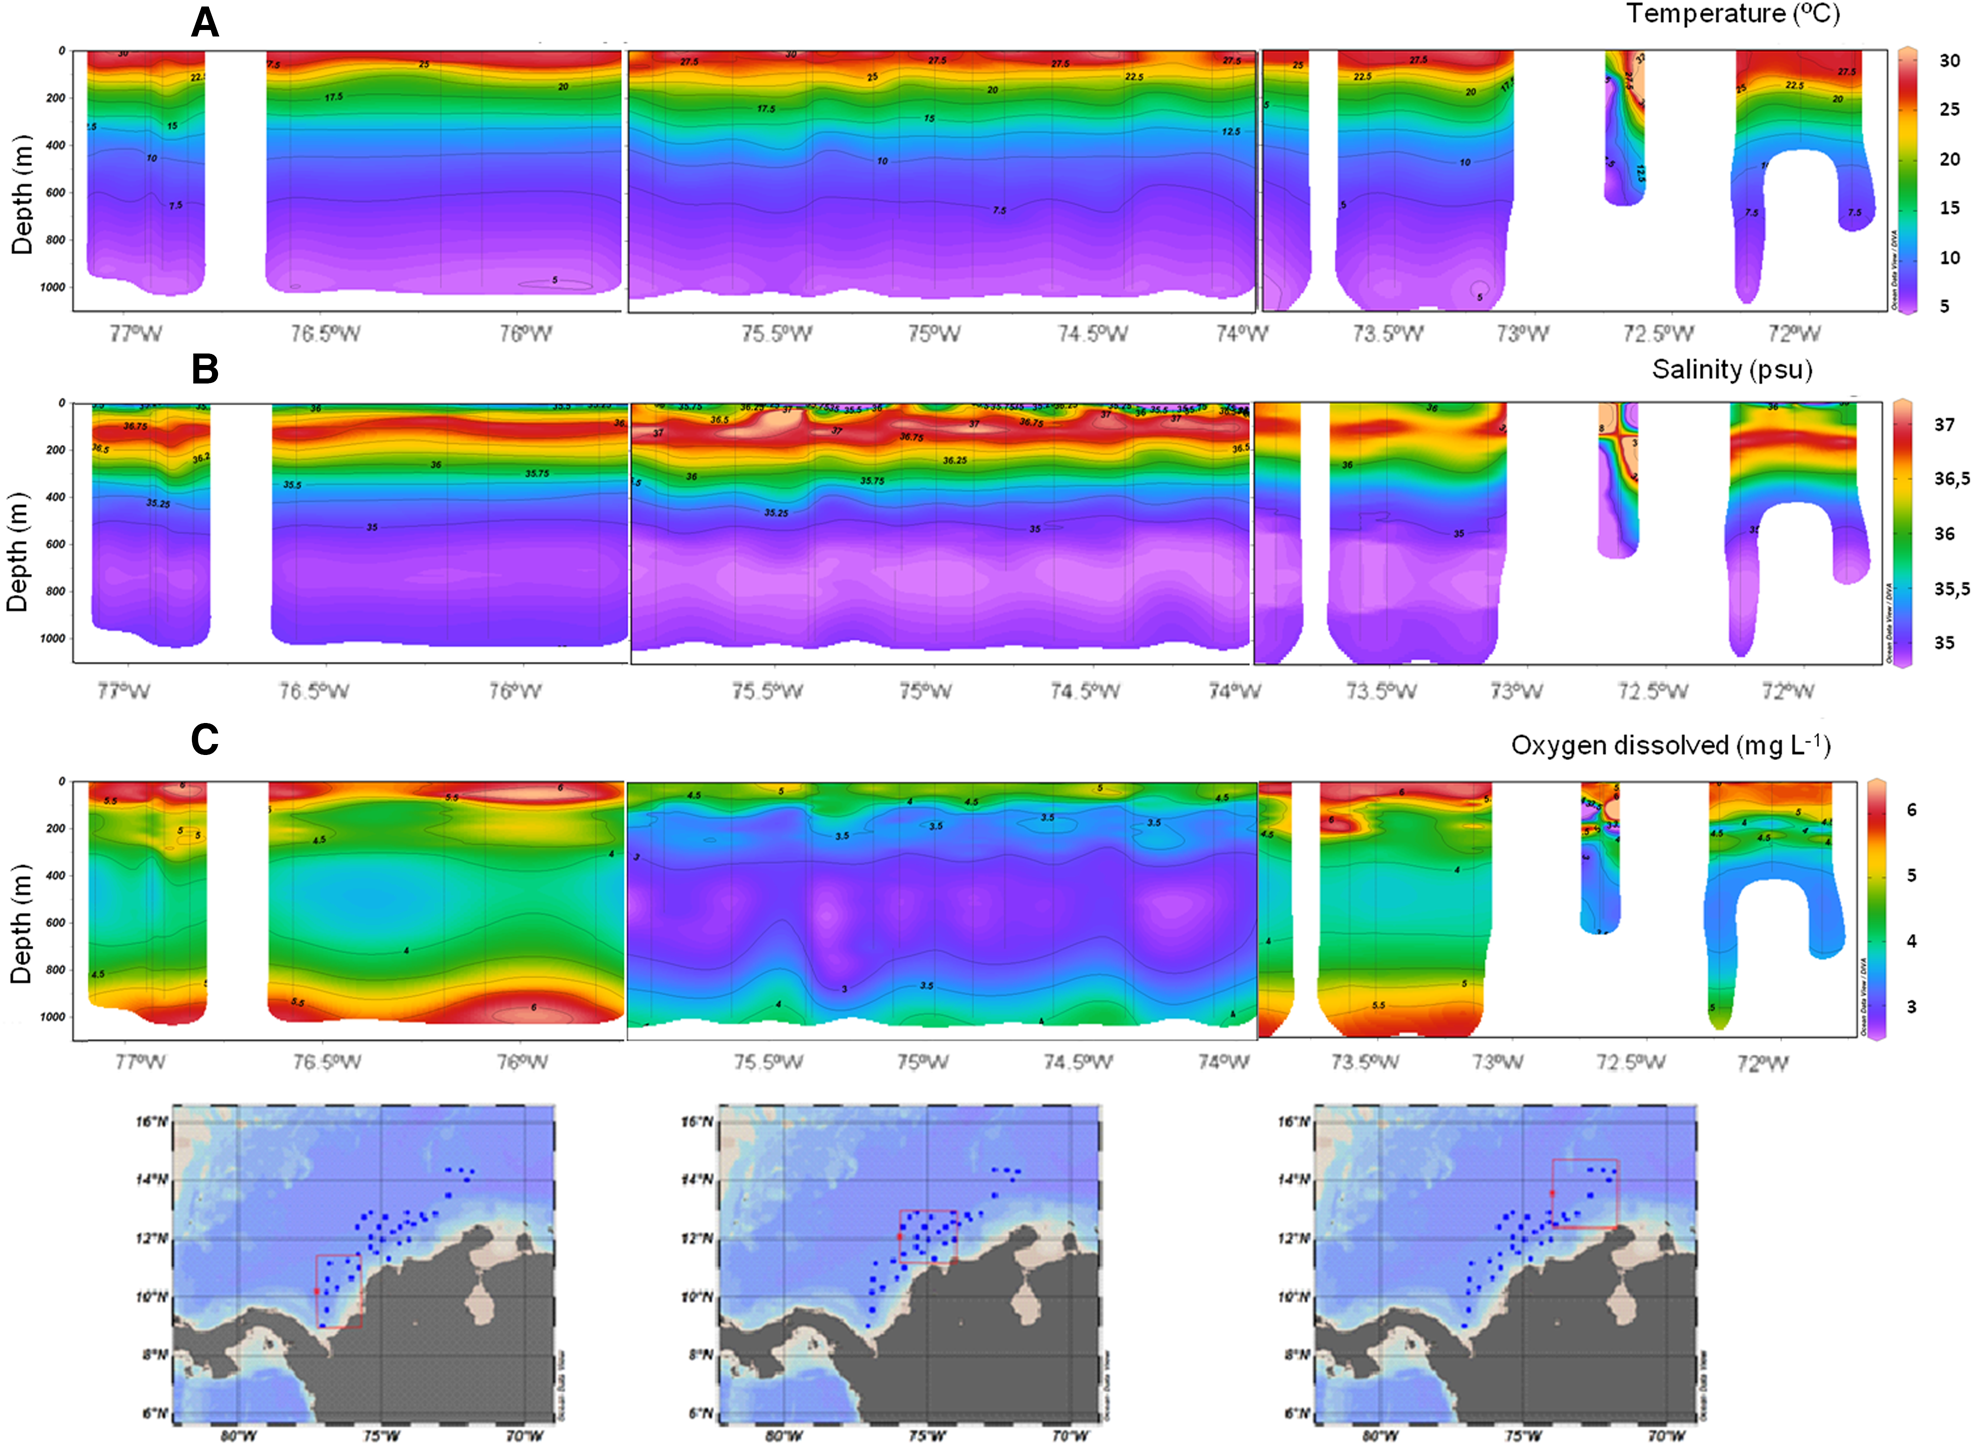
Fig. 3. Latitudinal section of the oceanographic variables analysed in the offshore system of the Colombian Caribbean Sea between 0–1000 m. (A) Temperature (°C). (B) Salinity (psu). (C) Dissolved oxygen (mg l−1).
The potential density sections showed a marked stratification in the first 200 m of the water column, with deeper pycnocline in the north-east region (Figure 4A). The Brunt–Vaisala frequency (buoyancy frequency) was variable mainly in the first 200 m. A water column with high stratification (10–15 cycles per hour – cph) was observed in the south-west region, while the north-east region was more mixed (0–5 cph). The central region showed both conditions, with stratified and mixed sectors below 50 m (Figure 4B). The Mixed Layer Depth (MLD) showed an overall mean of 52 ± 23 m, the north-east zone was the deepest with a mean of 76 ± 17 m, while the central and south-west zones had means of 45 ± 19 m and 41 ± 21 m, respectively (Figure 4C).

Fig. 4. Latitudinal section of potential density anomaly (kg m−3) (A), Brunt–Vaisala frequency (Cycl h−1) (B) and mixed layer depth (MLD) (C).
Water masses in the CAO ecoregion
Four water masses were registered in oceanic waters of the Colombian Caribbean: (1) The Caribbean Surface Water (CSW) was localized between 0–50 m, where it reached 100% contribution. This water mass showed an average temperature of 29 °C, low salinity (34 psu) and high concentrations of dissolved oxygen (>6 mg l−1) (Figure 5A, B). (2) The Subtropical Underwater (SUW) was found between 50 and 250 m depth, the 100% contribution was found around 160 m; this water mass had temperatures around 22 °C and high salinity (37 psu), the dissolved oxygen concentration was lower compared with the CSC (Figure 5A, C). (3) The Western North Atlantic Central Water (wNACW) was located between 400 and 900 m; it had low temperature (8–20 °C), high salinity (35–36 psu) and low concentration of dissolved oxygen. The wNACW showed 100% contribution near 350 m; the north-east section was more heterogeneous and dynamic than the south-west and central parts (Figure 5A, D). (4) The Antarctic Intermediate Water (AAIW) was found from 600 m depth and extends beyond 1000 m. This mass showed low temperature (about 3.5 °C), oxygen (3 mg l−1) and salinity (35 psu). The AAIW shares some characteristics in the upper limit with wNACW, which makes their separation diffuse. A water core was found in the north-east section around 700 m, composed of 90% AAIW and 10% wNACW. The percentage of contribution of AAIW was more evident in the central section where it reached close to 80%. The south-west section showed lower contribution (60–70%) of AAIW compared with the other zones (Figure 5A, E). The climatological means of temperature, salinity and oxygen and TS-O plot obtained with the WOA2018 database are consistent with the values recorded in the study area (Supplementary Material Figure S1).

Fig. 5. Characterization of the water masses in the CAO ecoregion between 77.0°W and 71.9°W. (A) T-S diagram, colour bar is depth (m). (B–E). Percentage of contribution of water masses. (B) Caribbean Surface Water (CSW). (C) Subtropical Underwater (SUW). (D) Western North Atlantic Central Water (wNACW) and (E) Antarctic Intermediate Water (AAIW).
Biotic assemblage analysis
Composition and population density
The order Calanoida was the most representative with 63.1% of the total abundance (ind. m−3), followed by the orders Cyclopoida and Harpacticoida with 33.3 and 2.8%, respectively. The order Mormonilloida was represented only by the species Mormonilla phasma, which had an average density of 5.2 ± 1.1 ind. m−3. The five most abundant families were Clausocalanidae and Paracalanidae (Order Calanoida), Corycaeididae, Oithonidae and Oncaeidae (Order Cyclopoida). The most abundant species was Clausocalanus furcatus with an average of 111.4 ± 14.1 ind. m−3, followed by Oithona setigera with 52.1 ± 14.1 ind. m−3, Calocalanus pavo with 43.1 ± 7.8 ind. m−3 and Farranula gracilis with 34.6 ± 5.5 ind. m−3.
Total population density of copepods in oceanic waters of the Colombian Caribbean had a mean of 616.6 ± 71.9 ind. m−3 and a range of 100–1542 ind. m−3. Higher densities (1542–1079 ind. m−3) were more frequent in the offshore stations of the central region or close to it. The lowest densities (100–358 ind. m−3) were found in the stations closer to the coast of the central region and the farthest in the north-east region. The south-west region and some stations of the central region showed medium densities (358–1079 ind. m−3) (Supplementary Figure S2).
Copepod population density decreased with depth (Figure 6). The first depth range (0–60 m) showed an average of 340 ± 45.3 ind. m−3; high densities were recorded (602–1051 ind. m−3) in some stations of the three regions, but mostly medium values were found. In the second range (70–140 m) only two stations of the central region had high densities; other stations recorded medium and low densities (1–77 ind. m−3). The north-east and south-west regions showed medium densities. The third range of depth showed medium and low densities; the medium values were found in the central and south-west regions. The range of 540–1000 m had the lowest densities, with an average of 19.6 ± 2.7 ind. m−3 (Figure 6).

Fig. 6. Distribution of abundances of copepods (ind. m−3) across different depth ranges. (A) 0–60 m; (B) 70–140 m; (C) 170–340 m; (D) 540–1000 m.
Horizontal and vertical distribution of copepods
The horizontal distribution of copepod species was analysed using clustering with the Simprof test and an n-MDS, in (1) all water columns studied (0–1000 m) and (2) by range of depth. The former found three groups or associations (A1, A2, A3) (Figure 7A). The A1 with a similarity close to 70% was formed by seven stations located in the central region with influence of the Magdalena River. The second association (A2) included five stations offshore of the north-east region, specifically in the Aruba Passage. The third association (A3) was formed by the remaining stations (22), distributed in oceanic waters throughout the Colombian Caribbean Sea (Figure 7A, Supplementary Figure S3). Only station 425 located in front of the department of Bolivar (central region), was isolated from the three associations. The ANOSIM test of species and abundances of copepods of the water column studied (0–1000 m) determined that there were significant differences between these three associations (overall R: 0.84; P = 0.001), and in all their combinations (A1–A2, R = 1; P = 0.001), (A3–A2; R = 0.718; P = 0.001) and (A3–A1; R = 0.885; P = 0.001).

Fig. 7. (A) Two-dimensional grouping of stations sampled in the CAO ecoregion from multidimensional non-metric scaling analysis (nMDS). Association 1 (A1), Association 2 (A2) and Association 3 (A3). (B) Two-dimensional grouping of depth ranges sampled in the CAO ecoregion based on multidimensional non-metric scaling analysis (nMDS). Depth ranges: R1: 0–60 m; R2: 70–140 m; R3: 170–340 m; R4: 540–1000 m.
The vertical distribution of copepod species did not show a clear separation by depth (Figure 7B). Apparently, the data were concentrated in a single group, five stations were dispersed from the main group in the deepest range (540–1000 m); these stations had low abundance (Figure 7B). The ANOSIM test showed significant differences between the depth ranges evaluated (overall R: 0.306; P = 0.001). The contribution of species between depth ranges showed that the highest percentages of dissimilarity (ds/sim) were found in the first three ranges with the last range (540–1000 m) (R1–R4: 66.26%; R2–R4: 59.95%; R3–R4: 55.06%). The species that contributed most to the differentiation were Clausocalanus furcatus (R1–R4 with 3.65% and R3–R4 with 2.38%) and Oithona setigera (R2–R4 with 1.61%).
The set of species that contributed most to the differentiation of horizontal associations was calculated with a similarity analysis (SIMPER). The comparison between associations A3 and A1 showed a dissimilarity of 44.09%; the species Agetus flaccus (3.4%), Clausocalanus furcatus (2.5%) and Farranula gracilis (2.5%) were the most important. The contrast between A3 and A2 showed 41.21% dissimilarity; this differentiation was given by the copepods Calocalanus minor (3.7%), Agetus flaccus (3.7%) and Subeucalanus subtenuis (2.7%). Finally, the associations A1 and A2 had 44.69% dissimilarity; Calocalanus minor (4.7%), Undinula vulgaris (3.3%) and Scolecithrix danae (3.1%) were the most representative (Table 2).
Table 2. SIMPER classification analysis with the species that contributed with the highest percentages to the dissimilarity between associations (A1, A2, A3)

Av, Average; Abd, Abundance; Contrib., Contribution; Cum. Contrib., Cumulative Contribution.
Weighted average depth (WAD)
Sixteen species that contributed more than 70% to the cumulative density in each of the depth ranges were selected to calculate the Weighted Average Depth (WAD) (Figure 8, Supplementary Figure S4). These species were found in all depth ranges, highlighting the sections of the water column where they contributed significantly to the cumulative density. Some species such as C. furcatus, C. pavo, F. gracilis, U. vulgaris, T. turbinada, A. flaccus and M. clausi have their WAD above 200 m depth, while other species such as M. phasma, P. abdominalis, L. flavicornis, R. cornutus and C. rapax have their WAD below 200 m depth. Most species have a preference for more superficial waters and present maximum density of ~70 m depth. The species P. abdominalis and C. rapax presented preference for deeper waters. The minimum abundance was near 800 m depth.

Fig. 8. Weighted average depth (WAD) of the 16 species that provided more than 70% of cumulative individual density throughout the water column. The red line indicates the 200 m depth. Range = distribution of species in the water column, Z abd max = Maximum abundance depth in the water column, Z abd min = Minimum abundance depth in the water column.
Environmental and copepod assemblages analysis
Temperature, salinity, dissolved oxygen, sigma and BVF were selected as independent variables for the DISTLM analysis and copepod abundance as variable response (dependent); all studied variables between 0–1000 m were significant (P = 0.001) (Supplementary Table S1). Temperature, sigma and oxygen explained 15, 14 and 10%, respectively of the copepod variability, followed by salinity 10% and BVF 8%. The stepwise routine did not exclude any environmental variables; all variables together explained 0.29 (R 2) of the variation in the copepod assemblage (Supplementary Table S1). The analysis of biotic (copepods) vs abiotic (environmental) variables, adding Mixed Layer Depth of 0–200 m showed that all variables except salinity were significant (P > 0.05). BVF and oxygen explained 17 and 11% of the variance, respectively. BVF, dissolved oxygen and MLD were selected by the DISTLM model, with Akaike value of 241.13 and R 2 of 0.35 (Supplementary Table S1).
Discussion
Oceanographic variation in the CAO ecoregion
During the years and periods (rainy season) of study, the oceanic waters of the Colombian Caribbean were stratified, with a well-defined mixed layer, thermocline, oxycline and halocline, especially in the first 200 m, which were warmer and less dense waters; below this depth waters were saltier, colder and denser. This characteristic and the description of water masses were similar and consistent with those reported for offshore Colombian Caribbean waters by Andrade & Barton (Reference Andrade and Barton2000), Hernández-Guerra & Joyce (Reference Hernández-Guerra and Joyce2000), Lozano-Duque et al. (Reference Lozano-Duque, Medellín-Mora, Navas, Navas, Segura-Quintero, Garrido-Linares, Benavides-Serrato and Alonso2010), Andrade (Reference Andrade2015), Bastidas-Salamanca & Ricaurte-Villota (Reference Bastidas-Salamanca and Ricaurte-Villota2017) and Correa-Ramírez et al. (Reference Correa-Ramírez, Rodríguez-Santana, Ricaurte-Villota and Paramo2020).
We found low salinity values in surface waters of the central zone, showing the influence of waters of the Magdalena River in the oceanic zone, as well as sectors of high stratification. Low dissolved oxygen was recorded in this zone; values were lower at the surface (4 mg l−1) compared with other studies in oceanic waters of the Colombian Caribbean during the same period, which found values of 6–7 mg l−1 (Lozano-Duque et al., Reference Lozano-Duque, Medellín-Mora, Navas, Navas, Segura-Quintero, Garrido-Linares, Benavides-Serrato and Alonso2010; Medellín-Mora et al., Reference Medellín-Mora, Escribano, Schneider, Correa-Ramírez and Campos2018). A recent study reported values of 4.2 mg l−1 in the river, 6.9 mg l−1 in Bocas de Ceniza and 7.0 mg l−1 in the adjacent ocean (8 km from the mouth of river at 100 m depth) (Torregroza-Espinosa et al., Reference Torregroza-Espinosa, Restrepo, Escobar, Brenner and Newton2020). The lowest values were found at 200–600 m (2.65 mg l−1); in a previous study the minimum value was close to 4 mg l−1 (Lozano-Duque et al., Reference Lozano-Duque, Medellín-Mora, Navas, Navas, Segura-Quintero, Garrido-Linares, Benavides-Serrato and Alonso2010). These lower values could be explained by high bacterial activity and particulate material from the river and its transport towards oceanic waters. However, there are few studies in offshore waters of Colombia and it is necessary to carry out accurate oxygen measurements, including pH, with calibrated equipment in different climatic periods.
The north-east oceanic stations showed low BVF (less stratification) and the deepest MLD in comparison to the central and south-west zones; these results agree with values previously recorded for the study period during the rainy season (Medellín-Mora et al., Reference Medellín-Mora, Escribano, Schneider, Correa-Ramírez and Campos2018; Montoya-Sánchez et al., Reference Montoya-Sánchez, Devis-Morales, Bernal and Poveda2018; Correa-Ramírez et al., Reference Correa-Ramírez, Rodríguez-Santana, Ricaurte-Villota and Paramo2020) and are consistent with high values of geostrophic currents and deeper mixing layer in the offshore waters of the northern Colombian Caribbean Sea (Supplementary Figure S5). In the Caribbean Sea off Colombia the stratification (BVF) is dominated by salinity, which makes the water column highly stable to the depth of the subsurface salinity maximum (100–200 m), and mechanical mixing is the dominant process of salt diffusion from the SUW towards the surface (Correa-Ramírez et al., Reference Correa-Ramírez, Rodríguez-Santana, Ricaurte-Villota and Paramo2020).
The Subtropical Underwater (SUW) showed a stable nucleus around 200 m among the sampled zones; this water mass is formed between 100 and 200 m in the middle of the tropical Atlantic, and remains at that depth as it goes through the basin where it acquires all the thermohaline characteristics that define it (Gordon, Reference Gordon1967), a thermocline marked between 50 and 100 m and a maximum of subsurface salinity between 100–200 m depth, which extends throughout the Caribbean (Hernández-Guerra & Joyce, Reference Hernández-Guerra and Joyce2000). An extensive mixing layer was found after the SUW, with an amplitude of ~600 m where the Western North Atlantic Central Water (wNACW) and the Antarctic Intermediate Water (AAIW) masses were recorded; the wNACW core was recorded at about 400 m, while the AAIW core is deeper and at about 1000 m. These amplitude ranges can vary from 200 m to almost 1000 m depending on the thermohaline structure of the water column, as has been documented in other basins such as Mexico (Vidal et al., Reference Vidal, Vidal and Hernández1990, Reference Vidal, Vidal, Hernández, Meza and Zambrano1994) and Brazil (Jullion et al., Reference Jullion, Heywood, Neira-Garabato and Stevens2010), and even for the Colombia basin these masses have been recorded at lower depths (Urbano-Rosas, Reference Urbano-Rosas1993; Giraldo, Reference Giraldo1994; Lozano-Duque et al., Reference Lozano-Duque, Medellín-Mora, Navas, Navas, Segura-Quintero, Garrido-Linares, Benavides-Serrato and Alonso2010; Gutiérrez-Salcedo, Reference Gutiérrez-Salcedo2011; Andrade, Reference Andrade2015). wNACW and AAIW are the most extensive water masses in the Colombian Caribbean, and are also considered young and poor in comparison with the other water masses, because they have almost no incidence of sunlight (<1%), low oxygen levels, low temperatures and high salinity (Longhurst, Reference Longhurst1985a, Reference Longhurst1985b; Emery & Meincke, Reference Emery and Meincke1986; Emery, Reference Emery, Holton, Curry and Pyle2001; Bastidas-Salamanca et al., Reference Bastidas-Salamanca, Ricaurte-Villota, Santamaría-del-Angel, Ordoñez-Zúñiga, Murcia-Riaño, Romero-Rodríguez, Bastidas-Salamanca and Ricaurte-Villota2017).
Structure of the copepod assembly
Horizontal distribution of copepod assembly
The structure of the oceanic community of copepods presented spatial zoning, but it does not strictly coincide with the sectorization (south, centre, north) described by other authors for the coastal zone (Ávila de Tabares, Reference Ávila de Tabares1971; Campos & Plata, Reference Campos and Plata1990; Bernal & Zea, Reference Bernal and Zea1993, Reference Bernal and Zea2000; Bernal et al., Reference Bernal, Werding, Zea, Campos and Acero2004; Franco-Herrera et al., Reference Franco-Herrera, Castro and Tigreros2006); on the contrary, it responds to physicochemical and oceanographic characteristics of the oceanic province off the Colombian Caribbean, grouping the assembly into three zones, as described below.
-
The oceanic Colombian zone
Corresponds to the A3 association obtained from the n-MDS analysis. This zone showed high temperatures, lower salinity, water masses with a homogeneous composition, and the highest densities of individuals (1541.8 ind. m−3) in comparison with the other zones. The oceanic Colombian zone is considered a sub-basin of dilution with warm surface waters, due to three factors: (1) the influx of fresh water, coming from rainfall and discharges from the Atrato, Sinú and Magdalena rivers, and important geographic features such as the Darien Gulf and the Ciénaga Grande de Santa Marta (Bernal et al., Reference Bernal, Poveda, Roldán and Andrade2006; Restrepo et al., Reference Restrepo, Zapata, Díaz, Garzón-Ferreira and García2006); (2) the persistence of the cyclonic circulation of the Darien counter-current (also known as the Panama-Colombia counter-current) and (3) the orientation of the coast that provides protection from winds (Bernal et al., Reference Bernal, Poveda, Roldán and Andrade2006; Restrepo et al., Reference Restrepo, Zapata, Díaz, Garzón-Ferreira and García2006; Correa-Ramírez et al., Reference Correa-Ramírez, Rodríguez-Santana, Ricaurte-Villota and Paramo2020). These factors transport and recirculate suspended material, making it possible for the mixing processes to have longer duration, longer residence times and a higher concentration of nutrients available to support the base of the food webs, which contributes to increasing the density of individuals in the assemblage (Centurioni & Niiler, Reference Centurioni and Niiler2003; Medellín-Mora et al., Reference Medellín-Mora, Escribano, Schneider, Correa-Ramírez and Campos2018; Correa-Ramírez et al., Reference Correa-Ramírez, Rodríguez-Santana, Ricaurte-Villota and Paramo2020).
-
The influence of the Magdalena River zone
Corresponds to the A1 association obtained from the nMDS analysis; it had the lowest values of individual density (100.05–106.4 ind. m−3), as found by Medellín-Mora et al. (Reference Medellín-Mora, Escribano, Schneider, Correa-Ramírez and Campos2018) (60.3 ind. m−3) and Gutiérrez-Salcedo (Reference Gutiérrez-Salcedo2011) (32.6 ind. m−3) in oceanic waters. Typical oceanic copepod assemblages have lower density of individuals in coastal areas, influenced by river discharges, with turbid and less saline waters (Hopcroft et al., Reference Hopcroft, Roff, Webber and Witt1998), however, at the distal edges of these plumes where turbidity decreases there are areas of high productivity associated with increased enrichment that promote algal blooms and consequently increase the abundance of zooplankton (DeMaster et al., Reference DeMaster, Smith, Nelson and Allers1996; Hopcroft et al., Reference Hopcroft, Roff, Webber and Witt1998; Salisbury et al., Reference Salisbury, Campbell, Meeker and Vörösmarty2001; Rivera-Monroy et al., Reference Rivera-Monroy, Twilley, Bone, Childers, Coronado-Molinam, Feller, Herrera-Silveira, Jaffe, Mancera, Rejmankova, Salisbury and Weil2004).
-
The offshore north-east zone
Corresponds to the A2 association obtained in the nMDS analysis (stations near the Aruba Passage); it had individual densities between 861.98 ind. m−3 and 214.62 ind. m−3. Four exclusive species were found (Arietellus aculeatus, Euchirella rostrata, Onychocorycaeus giesbrechti and Triconia similis), all typical inhabitants of mesopelagic and bathypelagic environments, exclusively oceanic, detritivorous and carnivorous (Boxshall & Hasley, Reference Boxshall and Hasley2004; Razouls et al., Reference Razouls, De Bovée, Kouwenberg and Desreumaux2005–2021). There are few exclusive species found in the north-eastern zone compared with the other two zones; this may be an effect of the conditions of circulation and currents, which can have a direct effect on the assembly of copepods, decreasing the density of individuals and reducing species richness in the surface layers, displacing them in an east-west direction by the dominant circulation, because this community lives at the mercy of currents for displacement (Michele & Foyo, Reference Michele and Foyo1976; Folt & Burns, Reference Folt and Burns1999; Huskin et al., Reference Huskin, Anadon, Medina, Head and Harris2001; Longhurst, Reference Longhurst2007; Paramo et al., Reference Paramo, Correa and Núñez2011; Medellín-Mora et al., Reference Medellín-Mora, Escribano, Schneider, Correa-Ramírez and Campos2018).
Mesoscale eddies play an important role in the transport of coastal waters to the ocean (Andrade et al., Reference Andrade, Hormazábal and Combes2014) by favouring the horizontal and vertical transport of nutrients known as cyclonic eddy pumping that results in upwelling events from the Subtropical Surface Water body. The results obtained for the north-eastern zone between 100 and 400 m suggest that there are favourable conditions for these mixing processes and possible outcropping conditions, with low temperatures and high salinity, which is one of the mechanisms associated with increased biological production in these oceanic zones (Falkowski et al., Reference Falkowski, Ziemann, Kolber and Bienfang1991; Aristegui et al., Reference Aristegui, Tett, Hernández-Guerra, Basterretxea, Montero, Wild, Sangrà, Hernández-León, Canton, García-Braun, Pacheco and Barton1997; McGillicuddy et al., Reference McGillicuddy, Anderson, Bates, Bibby, Buesseler, Carlson, Davis, Ewart Falkowski, Goldthwait, Hansell, Jenkins, Johnson, Kosnyrev, Ledwell, Li, Siegel and Steinberg2007; Ruiz-Ochoa, Reference Ruiz-Ochoa2011; Correa-Ramírez et al., Reference Correa-Ramírez, Rodríguez-Santana, Ricaurte-Villota and Paramo2020).
Vertical distribution of the copepod assembly
The vertical structure of the oceanic copepod community is determined by the distribution of water masses, therefore there is a vertical gradient in the copepod assembly that responds directly to different layers in the column water, since the depth ranges were classified mainly by differences in the abundance of oceanic copepod assembly.
The abundance of the assemblage decreases considerably in tropical and subtropical oligotrophic waters (Medellín-Mora et al., Reference Medellín-Mora, Escribano, Corredor-Acosta, Hidalgo and Schneider2021), as occurred in this study, where the density went from 340 ± 45.3 ind. m−3 at the surface to 19.6 ± 2.7 ind. m−3 in the deepest range. These results are consistent with values reported for the edge of the continental shelf of Colombia down to 200 m, between 120.9 ± 22.7 ind. m−3 and 19.9 ± 5.6 ind. m−3 (Medellín-Mora & Martínez-Ramírez, Reference Medellín-Mora, Martínez-Ramírez, Navas, Segura-Quintero, Garrido-Linares, Benavides-Serrato and Alonso2010) and down to 600 m, between 110.6 ind. m−3 for the superficial layers and 8.6 ind. m−3 for the deep layers (Gutiérrez-Salcedo, Reference Gutiérrez-Salcedo2011); in south-eastern Brazil, population densities varied between 555.4 ± 989.12 ind. m−3 and 14.21 ± 24.98 ind. m−3 (Dias et al., Reference Dias, Araujo, Paranhos and Bonecker2010) and between 6417 ± 361.1 ind. m−3 and 100 ± 23.1 ind. m−3 (Becker, Reference Becker2014).
The copepod assemblage of the CAO ecoregion showed a typical vertical offshore distribution pattern, where decreasing abundance and species replacement as depth increases suggest the transition from surface waters with photosynthetic activity to deep oligotrophic waters (Banse, Reference Banse1964; Vinogradov, Reference Vinogradov1968; Dias et al., Reference Dias, Araujo, Paranhos and Bonecker2010; Oliveira Dias et al., Reference Oliveira Dias, Valente de Araujo, Paranhos and Costa Bonecker2010). The low population density of deep water in tropical and subtropical ecosystems is not necessarily the result of inefficient resource use by the deep-sea copepod assembly, but rather the direct result of low surface production and reduced flow of organic material from the surface layers to the deep waters (Vinogradov, Reference Vinogradov1968; Scotto di Carlo et al., Reference Scotto di Carlo, Ianora, Fresi and Hure1984; Huys & Boxshall, Reference Huys and Boxshall1991; Dias et al., Reference Dias, Araujo, Paranhos and Bonecker2010; Oliveira Dias et al., Reference Oliveira Dias, Valente de Araujo, Paranhos and Costa Bonecker2010).
The analysis of the weighted average depth (WAD) allowed determining the abundance nuclei of the species that influenced more importantly the similarity between the groups formed; the species with WAD above 200 m depth, that respond to the epipelagic conditions and the ocean-atmosphere interaction, are mostly herbivorous and omnivorous species (Razouls et al., Reference Razouls, De Bovée, Kouwenberg and Desreumaux2005–2021); the vertical distribution of these copepods is related to the physiological regimes of phytoplankton, and showed the highest abundances in areas where phytoplankton blooms occur (Cummings, Reference Cummings1984), i.e. Clausocalanus furcatus, Calocalanus pavo, Farranula gracilis, Undinula vulgaris, Temora turbinata, Agetus flacus and Mecynocera clausi (Boltovskoy, Reference Boltovskoy1999; Suárez-Morales & Gasca, Reference Suárez-Morales and Gasca2000; Boxshall & Hasley, Reference Boxshall and Hasley2004). The dominant species in this study, C. furcatus, has herbivorous habits, a high reproductive rate and the ability to gather in patches along the water column, which allows it to be highly efficient in obtaining food in ocean environments, making it the most abundant species not only on the surface but also in subsurface waters (70–140 m) and intermediate waters (170–340 m). This species is dominant in tropical and subtropical oligotrophic regions, very frequent in epipelagic and mesopelagic ecosystems and less frequent between 500 and 1000 m (Frost & Fleminger, Reference Frost and Fleminger1968; Fragopoulu et al., Reference Fragopoulu, Siokou-Frangou, Christou and Mazzocchi2001; Oliveira Dias et al., Reference Oliveira Dias, Valente de Araujo, Paranhos and Costa Bonecker2010).
The copepods Clausocalanus furcatus, Oncaea venusta, Temora stylifera and T. turbinata are considered indicators of the North Equatorial Current and possibly the Caribbean Surface Water masses; they are found in a latitudinal gradient from neritic to oceanic waters from north-east (14 °N) to south-west (9 °N); they are frequently and abundantly recorded in open waters of the South-west Atlantic Ocean (Björnberg, Reference Björnberg and Boltovskoy1981; Razouls et al., Reference Razouls, De Bovée, Kouwenberg and Desreumaux2005–2021; Oliveira Dias et al., Reference Oliveira Dias, Valente de Araujo, Paranhos and Costa Bonecker2010; Becker, Reference Becker2014). Their abundance and frequency of occurrence respond to the conditions of the ocean systems, so they may be indicators of good conditions in the surface layers (Michele & Foyo, Reference Michele and Foyo1976; López & Mesa, Reference López and Mesa1984; Dias et al., Reference Dias, Araujo, Paranhos and Bonecker2010; Oliveira Dias et al., Reference Oliveira Dias, Valente de Araujo, Paranhos and Costa Bonecker2010; Becker et al., Reference Becker, Eiras Garcia and Santarosa2018); these species constitute an important part of the local fauna of the CAO ecoregion assembly.
Important species that are commonly found in epipelagic ecosystems were also present in mesopelagic and bathypelagic environments, as was shown by the SIMPER test, this being the case of Clausocalanus furcatus, Oithona setigera and Farranula gracilis, and vice versa, i.e. deep species found in the surface layers, as was the case of Rhincalanus cornutus, Pleuromamma abdominalis, Mormonilla phasma and Conaea rapax. This may be due to vertical migration mechanisms involved in interspecific competition, by occupying different positions in the water column; this means that if populations occupy different positions in the water column they will have different size and quality of food available, potentially reducing interspecific competition for food and space (Steele, Reference Steele, Cushing and Walsh1976; Williams, Reference Williams1985; Ambler & Miller, Reference Ambler and Miller1987; Oliveira Dias et al., Reference Oliveira Dias, Valente de Araujo, Paranhos and Costa Bonecker2010). Local patterns of mesoscale circulation may also favour the homogeneity of the local copepod assembly in the region (Huys & Boxshall, Reference Huys and Boxshall1991; Suárez-Morales & Gasca, Reference Suárez-Morales and Gasca2000; Andersen et al., Reference Andersen, Devey, Gubanova, Picheral, Melnikov, Tsarin and Prieur2004).
Integral biological and oceanographic analysis
Variation in the distribution, abundance and dominance of some species in the copepod assemblage responds to local oceanographic variations, as revealed by the distance-based linear model (DistLM), which shows that all the variables studied explain the behaviour of the assemblage of copepods. Thermohaline variations, dissolved oxygen and density of the water column explained the greatest percentage of variability and modulated the decrease in the abundance of the copepod assemblage vertically, as well as its horizontal distribution, mainly in the stations furthest from the coast of the central zone, which had low levels of dissolved oxygen and copepod densities between 150 and 800 m.
Species respond differently to the physicochemical changes of the spine, depending on their trophic habits, metabolism and their ability to move away from the anomaly produced in their environment. In the case of dissolved oxygen, the critical lower limit for aerobic metabolism is ~0.2 mg l−1, exceeding the tolerance limits of the species, affecting their behaviour, growth, reproduction and survival (Childress, Reference Childress1975; Wishner et al., Reference Wishner, Gowing and Gelfman1998). No values close to this critical limit were found in the CAO ecoregion; however, it has been documented that some species of epipelagic and mesopelagic copepods such as Undinula vulgaris, Nanocalanus minor, Pleuromamma abdominalis and Rhincalanus cornutus can move through areas with low dissolved oxygen for limited periods of time, living anaerobically or decreasing their metabolism to enter diapause stages (Longhurst, Reference Longhurst1967a; Boyd et al., Reference Boyd, Smith and Cowles1980; Alldredge et al., Reference Alldredge, Robison, Fleminger, Torres, King and Hamner1984; Wishner et al., Reference Wishner, Gelfman, Gowing, Outram, Rapien and Williams2008).
The assembly is not limited by the concentration of dissolved oxygen in the surface layers, unless a significant increase in temperature increases the demand for oxygen above the capacity of the system (Breitburg et al., Reference Breitburg, Levin, Oschlies, Grégoire, Chavez, Conley, Garçon, Gilbert, Gutiérrez, Isensee, Jacinto, Limburg, Montes, Naqvi, Pitcher, Rabalais, Roman, Rose, Seibel, Yasuhara and Zhang2018). At greater depths, the upper and lower limits of the low-oxygen bands (oxic-anoxic interfaces) generate sites of high activity of bacteria, producing increased carbon cycles and flows (Wishner et al., Reference Wishner, Gelfman, Gowing, Outram, Rapien and Williams2008). Although it could not be clearly determined in this study, these borderline interfaces could be used as shelter during stressful physiological conditions, representing an important food resource for filtering organisms, which attract superior consumers, turning them into places with important food resources, causing regions with important patches of zooplankton, especially copepods, around the areas with low oxygen (Longhurst, Reference Longhurst1967a, Reference Longhurst1967b; Wishner et al., Reference Wishner, Gowing and Gelfman1998; Breitburg et al., Reference Breitburg, Levin, Oschlies, Grégoire, Chavez, Conley, Garçon, Gilbert, Gutiérrez, Isensee, Jacinto, Limburg, Montes, Naqvi, Pitcher, Rabalais, Roman, Rose, Seibel, Yasuhara and Zhang2018).
The most important variables in the first layer (0–200 m) were stratification (BVF), dissolved oxygen and MLD, another association was found in the stations of the north-east zone near the Aruba Passage, where low stratification and the deepest MLD were found. Farstey et al. (Reference Farstey, Lazar and Genin2002) found that changes in the vertical distribution of zooplankton co-varied with changes in the mixed-layer depth with homogeneous distribution in conditions of mixing and distribution in the photic layer in stratified conditions, however, some large species of genus Pleuromamma make diel vertical migration regardless of mixing.
Any local change produced in the water column can directly influence the distribution and abundance of zooplankton by processes of advection and mixing of water masses, which generates displacement and interaction between species of different bathymetric ranges that increase the diversity of species in oceanic environments (Suárez-Morales & Gasca, Reference Suárez-Morales and Gasca2000; Dias et al., Reference Dias, Araujo, Paranhos and Bonecker2010; Morales et al., Reference Morales, Loreto-Torreblanca, Hormazabal, Correa-Ramírez, Nuñez and Hidalgo2010; Hidalgo et al., Reference Hidalgo, Escribano, Fuentes, Jorquera and Vergara2012; Medellín-Mora et al., Reference Medellín-Mora, Escribano, Schneider, Correa-Ramírez and Campos2018; Menezes et al., Reference Menezes, Macedo-Soares and Santarosa2019).
To summarize, the horizontal structure of the copepod assembly in the CAO ecoregion presents a spatial sectorization in three zones, defined by oceanographic and biological characteristics: the oceanic Colombian zone, the influence of the Magdalena River zone and the offshore north-east zone, governed mainly by the Panama-Colombia Gyre, the continental water input of the Magdalena River and the water input from the Caribbean Current. In association with this sectorization the vertical structure of the copepod assembly in the CAO ecoregion has a defined vertical gradient in species structure associated with water masses, finding important species of the epipelagic ecosystem frequently in mesopelagic and bathypelagic ecosystems due to migration mechanisms and water mixing processes that favour the homogeneity of the local copepod assembly, suggesting a vertical trend that responds more to biological conditions such as density and composition. Finally, the species Clausocalanus furcatus, Oncaea venusta, Temora stylifera and T. turbinata are proposed to be considered as indicator species of the North Equatorial Current and the Caribbean Surface Water (CSW), and the species Mormonilla phasma and Conaea rapax as indicators of deep-water masses such as the Western North Atlantic Central Water (wNACW) and the Antarctic Intermediate Water (AAIW).
Supplementary material
The supplementary material for this article can be found at https://doi.org/10.1017/S0025315422000133
Acknowledgements
This study was funded by The National Agency of Hydrocarbons of Colombia, the Institute of Marine and Coastal Research – INVEMAR. We thank the Marine Ecosystem Biodiversity Program (BEM) and the Natural Marine History Museum of Colombia (MHNMC), the B/I ANCON crew and scientific staff who participated in the cruises.
Financial support
The cruises and this work were funded by the National Agency of Hydrocarbons of Colombia and the Institute of Marine and Coastal Research – INVEMAR. Additional funding has been provided by the Universidad Nacional de Colombia.


