


Introduction
Organotin (OT) compounds have been utilized as antifouling biocides since 1960. Higher concentrations of OT were detected in coastal areas around the world (Chiavarini et al., Reference Chiavarini, Massanisso, Nicolai, Nobili and Morabito2003; Harino et al., Reference Harino, Mori, Yamaguchi, Shibata and Senda2005a, Reference Harino, O'Hara, Burt, Chesman and Langston2005b). Those compounds have been of great concern due to their adverse effects on non-target marine organisms, such as oyster shell malformations and imposex (Laughlin & Linden, Reference Laughlin and Linden1985; Gibbs & Bryan, Reference Gibbs and Bryan1986; Bryan & Gibbs, Reference Bryan, Gibbs, Newman and McIntosh1991; Gibbs et al., Reference Gibbs, Spencer and Pascoe1991). In 2008, the International Convention on the Control of Harmful Antifouling Systems on ships (AFS Convention), which prohibited the use of OTs as active ingredients in antifouling systems for ships, was ratified by the International Maritime Organization (IMO). After the ban on the use of tributyltin (TBT) compounds, the concentrations of OT compounds in aquatic environments must be monitored in order to evaluate the effect of the regulation. However, there are few reports on the measurement of organotin compounds concentrations (Lee et al., Reference Lee, Kim, Lee, Choi and Oh2015; Ruiz et al., Reference Ruiz, Albania, Carro and Barreiro2015).
Aquaculture is a main industry in Southeast Asia, and aquatic resources such as farm-raised shrimp are exported. Plantation-produced palm oil is also a major export industry in Southeast Asia. These two main drivers of the economy in Southeast Asia are made possible by the climate and natural environment there. However, the economic development means that trade will flourish, and active trade leads to OT pollution. Before the IMO regulations, there were many papers on the concentrations of OTs in the Association of Southeast Asian Nations (ASEAN). For example, Midorikawa et al. (Reference Midorikawa, Arai, Harino, Ohji, Cu and Miyazaki2004) reported on OT concentrations in in Vietnam. The concentrations of TBT in sediment and clams were in the ranges of 0.89–34 ng g−1 dry weight (dw) and 1.4–56 ng g−1 wet weight (ww), respectively. Harino et al. (Reference Harino, Ohji, Wattayakorn, Arai, Rungsupa and Miyazaki2006) reported that concentrations of TBT in sediment and green mussels from Thailand ranged from 2–1246 ng g−1 dw and 4–45 ng g−1 ww, respectively. Sudaryanto et al. (Reference Sudaryanto, Takahashi, Monirith, Ismail, Muchtar, Zheng, Richardson, Subramanian, Prudente, Hue and Tanabe2002) reported widespread contamination with butyltin (BT) compounds along the coastal waters of developing Asian countries by the measuring the concentrations in green mussels (Mytilus edulis). Among Southeast Asian countries, Malaysia has been undergoing particularly rapid economic growth in the past two decades. Therefore, there are concerns about contamination with organotin compounds in Malaysia. Tong et al. (Reference Tong, Pang, Phang and Lai1996) reported that TBT in water samples from Peninsular Malaysia was in the range of <3.4–20 ng l−1 and that imposex may be caused in gastropods. Hashimoto et al. (Reference Hashimoto, Watanabe, Noda, Hayashi, Kurita, Takasu and Otsuki1998) reported concentrations of BT compounds along the Strait of Malacca that were high enough to cause deleterious effects on aquatic organisms, such as imposex in gastropods. Sudaryanto et al. (Reference Sudaryanto, Takahashi, Iwata, Tanabe and Ismail2004) reported the concentrations of BT compounds in Malaysia; they detected BTs in all samples, ranging from 3.6–900 ng g−1 ww, 3.6–210 ng g−1 ww, and 18–1400 ng g−1 dw in mussels, fish and sediments, respectively. Harino et al. (Reference Harino, Arai, Ohji, Ismail and Miyazaki2009) detected higher concentrations of TBT and triphenyltin (TPT) compounds in sediment and green mussel (Perna viridis) from Peninsular Malaysia; the maximum concentrations of TBT found in green mussel were near the tolerable average residue level (TARL). Thus, higher concentrations of TBT were detected in aquatic environments in Malaysia. Therefore, attention must be paid to OTs contamination in Malaysian coastal waters.
This study elucidates the status of OT compound contamination in aquatic animals in Malaysia after the IMO ban on the use of such compounds. The study also characterizes the bioaccumulation of OT compounds in aquatic organisms by examining the relationships between the OT concentrations and the trophic level, using stable nitrogen isotope δ 15N to evaluate bioaccumulation of OTs, or biological measurement of aquatic organisms. The results form the basis of a discussion about the biological impact of OTs on aquatic biota in coastal waters of Malaysia and provide additional information about contamination in coastal ecosystems.
Materials and methods
Sampling description
Malaysia is located in the centre of Southeast Asia and consists of two geographic regions divided by the South China Sea: Peninsular Malaysia and Malaysian Borneo. Among Southeast Asian countries, Malaysia has become famous as an exporter of electronic parts, and both aquaculture and palm oil plantations have also become major industries there. Many seagrasses and mangrove areas have been destroyed by the large number of factories, farms and trading ports constructed around the southern part of Peninsular Malaysia. Malaysia has also become famous as a resort recently, because many areas face the sea.
We focused on Merambong and Tinggi Island, which have different industrial bases. Merambong is located between the southern part of Peninsular Malaysia and Singapore (Figure 1). Although the area has many factories, a big trading port, and reclamation of the waterfront, there are some rich natural environments with mangrove and seagrass areas. The seagrass beds are ~1.3 km in length. Tinggi Island is located at the east coast of Johor, and the tourism industries are its main economic activities. Most of the coastal area in Tinggi Island, featuring long coastlines with white sandy beaches is used as a resort area.

Fig. 1. The sampling sites of biota collected from Merambong and Tinggi Island, Malaysia.
To confirm the status of organotin compound contamination of aquatic animals in the seagrass area of Malaysia, many aquatic animals were taken as samples from Merambong and Tinggi Island. From Merambong, on 7–8 September 2012, 4 species of clam, 3 of crab, 1 of cuttlefish, 1 of mollusc, 3 of sea cucumber, 2 of sea star, 2 of shrimp, 2 of snail, and 11 species of fish were taken; on 27–29 May 2013, 6 species of fish were taken (Table 1). From Tinggi Island on 7–8 September 2012, 2 species of clam, 2 of crab, 1 of cuttlefish, 4 of sea cucumber, 1 of sea star, 1 of sea urchin, 1 of shrimp, and 15 of fish were taken (Table 2). These animals were dissected immediately after collection. All samples were brought back to Japan in a cold box and stored in a freezer at −20°C until chemical analysis.
Table 1. Biological measurement of species of biota in seagrass area of Merambong, Malaysia, in 2012 and 2013

TL, total length; SL, shell length; CW, carapace width; ML, mantle length.
Parentheses show the numbers of individuals.
Table 2. Biological measurement of species of biota in seagrass area of Tinggi Island, Malaysia, in 2012

TL, total length; SL, shell length; CW, carapace width; ML, mantle length.
Parentheses show the numbers of individuals.
Chemical analysis
The method used to determine the OTs in biological samples was based on that of Harino et al. (Reference Harino, Arifin, Rumengan, Arai, Ohji and Miyazaki2012), with some modification. Two grams of sediment sample or plant sample was cut by scissors and put in a centrifuge tube. One hundred micrograms of mixed acetone solution containing 1 μg ml−1 each of monobutyltin trichloride (MBTCl)-d9, dibutyltin dichloride (DBTCl)-d18, tributyltin monochloride (TBTCl)-d27, monophenyltin trichloride (MPTCl)-d5, diphenyltin dichloride (DPTCl)-d10, and triphenyltin monochloride (TPTCl)-d15 was added to the centrifuge tube as a surrogate standard. The mixture was shaken with 10 ml of 1 M HCl-methanol/ethyl acetate (1/1) for 10 min. After centrifugation for 10 min, the residue was again extracted with 10 ml of 1 M HCl-methanol/ethyl acetate (1/1). After centrifugation, the combined supernatants and 30 ml of saturated NaCl solution were then transferred to a separatory funnel. The analytes were extracted twice with 15 ml of ethyl acetate/hexane (3/2) solution, and the organic layer was combined. Fifty millilitres of hexane was mixed into the organic layer, and the mixture was left to stand for 20 min. After removal of the aqueous layer, the organic layer was dried with anhydrous Na2SO4 and concentrated up to trace level. The analytes were diluted with 5 ml of ethanol, 5 ml of acetic acid − sodium acetate buffer (pH 5.0), and 10 ml of distilled water, followed by ethylation by shaking with 1 ml of 5% NaBEt4 for 30 min. The solution containing ethylated OTs was saponified with 10 ml of 1 M KOH–ethanol solution by shaking for 1 h. Forty millilitres of distilled water and 10 ml of hexane were added to the solution, and the mixture was shaken for 10 min. The ethylated OT residue in the aqueous layer was extracted again by shaking for 10 min with 10 ml of hexane. The combined organic layers were dried with anhydrous Na2SO4. After being concentrated up to 1 ml, the solution was cleaned by a Florisil Sep-Pak column (Waters Association Co. Ltd). The analytes were eluted with 10 ml of 5% diethyl ether/hexane. All eluting solvent was collected in a bottom flask. The solution was concentrated up to 0.5 ml after the addition of tetrabutyltin (TeBT)-d36 and tetraphenyltin (TePT)-d20 as internal standards. The final solution was concentrated up to 0.5 ml.
A gas chromatograph (6890A series, Agilent Technologies) equipped with a mass spectrometer (5973N, Agilent) was used for analysis of the OTs. The separation was carried out in a capillary column coated with 5% phenyl methyl silicone (J&W Scientific Co., 30 m length × 0.25 mm i.d., 0.25 μm film thickness). The column temperature was held at 60°C for the first 2 min, then increased to 130°C at 20oC min−1, 210°C at 10oC min−1, 260°C at 5°C min−1 and 300°C at 10°C min−1. Finally, the column temperature was held at 300°C for 2 min. The interface temperature, ion source temperature and ion energy were 280°C, 230°C and 70 eV, respectively. Selected ion monitoring was operated under this program. The monitoring ions of 235 (233) for MBT, 261 (263) for DBT, 263 (261) for TBT, 253 (255) for MPT, 303 (301) for DPT and 351 (349) for TPT were used to quantify the concentrations of OTs. The parentheses show the qualifier ions. One microlitre of the sample was injected by splitless injection. The concentrations of OTs in this study are expressed as Sn4+.
Evaluation of the analytical procedure
The quality of the data obtained by the analytical procedure for OTs and alternative biocides was examined. When 1 μg of OTs were spiked to 1 g of biological sample, the recovery rates of the OTs were in the range of 90–109% and the relative standard deviations (RSDs) were in the range of 8–12%. The detection limits of each OT, based on a signal-to-noise ratio of 3, was 0.1 ng Sn g−1 wet wt.
Stable nitrogen isotope (δ 15N)
The concentrations of stable nitrogen isotope, δ 15N, were measured because δ 15N is used to evaluate bioaccumulation. The method used to determine nitrogen-stable isotopes in plant samples was based on that of Vu et al. (Reference Vu, Casareto, Hayashizaki, Sangsawang, Toyoda, Tran and Suzuki2017). The samples were kept frozen (~ −20°C) for a few days after collection and then were moved to a laboratory and dried in an electric oven at 60°C for 6 h. They were kept dry until analysis at room temperature. The samples were powdered using a pestle and mortar. Subsamples were placed in ultrapure tin capsules, and the samples were burned in an elemental analyser (Flash EA, Thermo Fisher Scientific, Waltham, MA, USA). Combustion gases continuously moved through a flow controller (ConFlo III, Thermo Fisher), and then the stable nitrogen isotope compositions were detected with a mass spectrometer (Delta plusXP, Thermo Fisher). L-alanine was used as the working standard. Stable isotope ratios were expressed in δ notation (parts per thousand, ‰) as deviations from international standards according to the following equation:

where X represents 15N and R represents isotope ratios 15N/14N. R sample and R standard are the isotope ratios of the sample and the international standard, atmospheric N2, respectively.
Statistics
Differences between data were analysed using the Mann−Whitney U-test, and the significance of the correlation coefficient and that of the regression slope were tested by Spearman's rank correlation coefficient (Sokal & Rohlf, Reference Sokal and Rohlf2003).
Results
The concentrations of OTs in aquatic organisms
The concentrations of the total BTs (∑BTs = TBT + DBT + MBT) in aquatic organisms from Merambong and Tinggi Island were found to be in the ranges of 8.2–151 and 3–109 ng g−1 ww, respectively (Table 3, Figures 2 and 3). A comparison of the concentrations of ∑BTs between Merambong and Tinggi Island revealed ∑BTs of 32.4 ± 21.4 (Mean ± SD) ng g−1 ww and 29.2 ± 13.0 ng g−1, respectively, indicating no significant differences (P > 0.5) (Table 3, Figures 2 and 3).

Fig. 2. Concentrations of BTs (A) and PTs (B) in biota from Merambong.
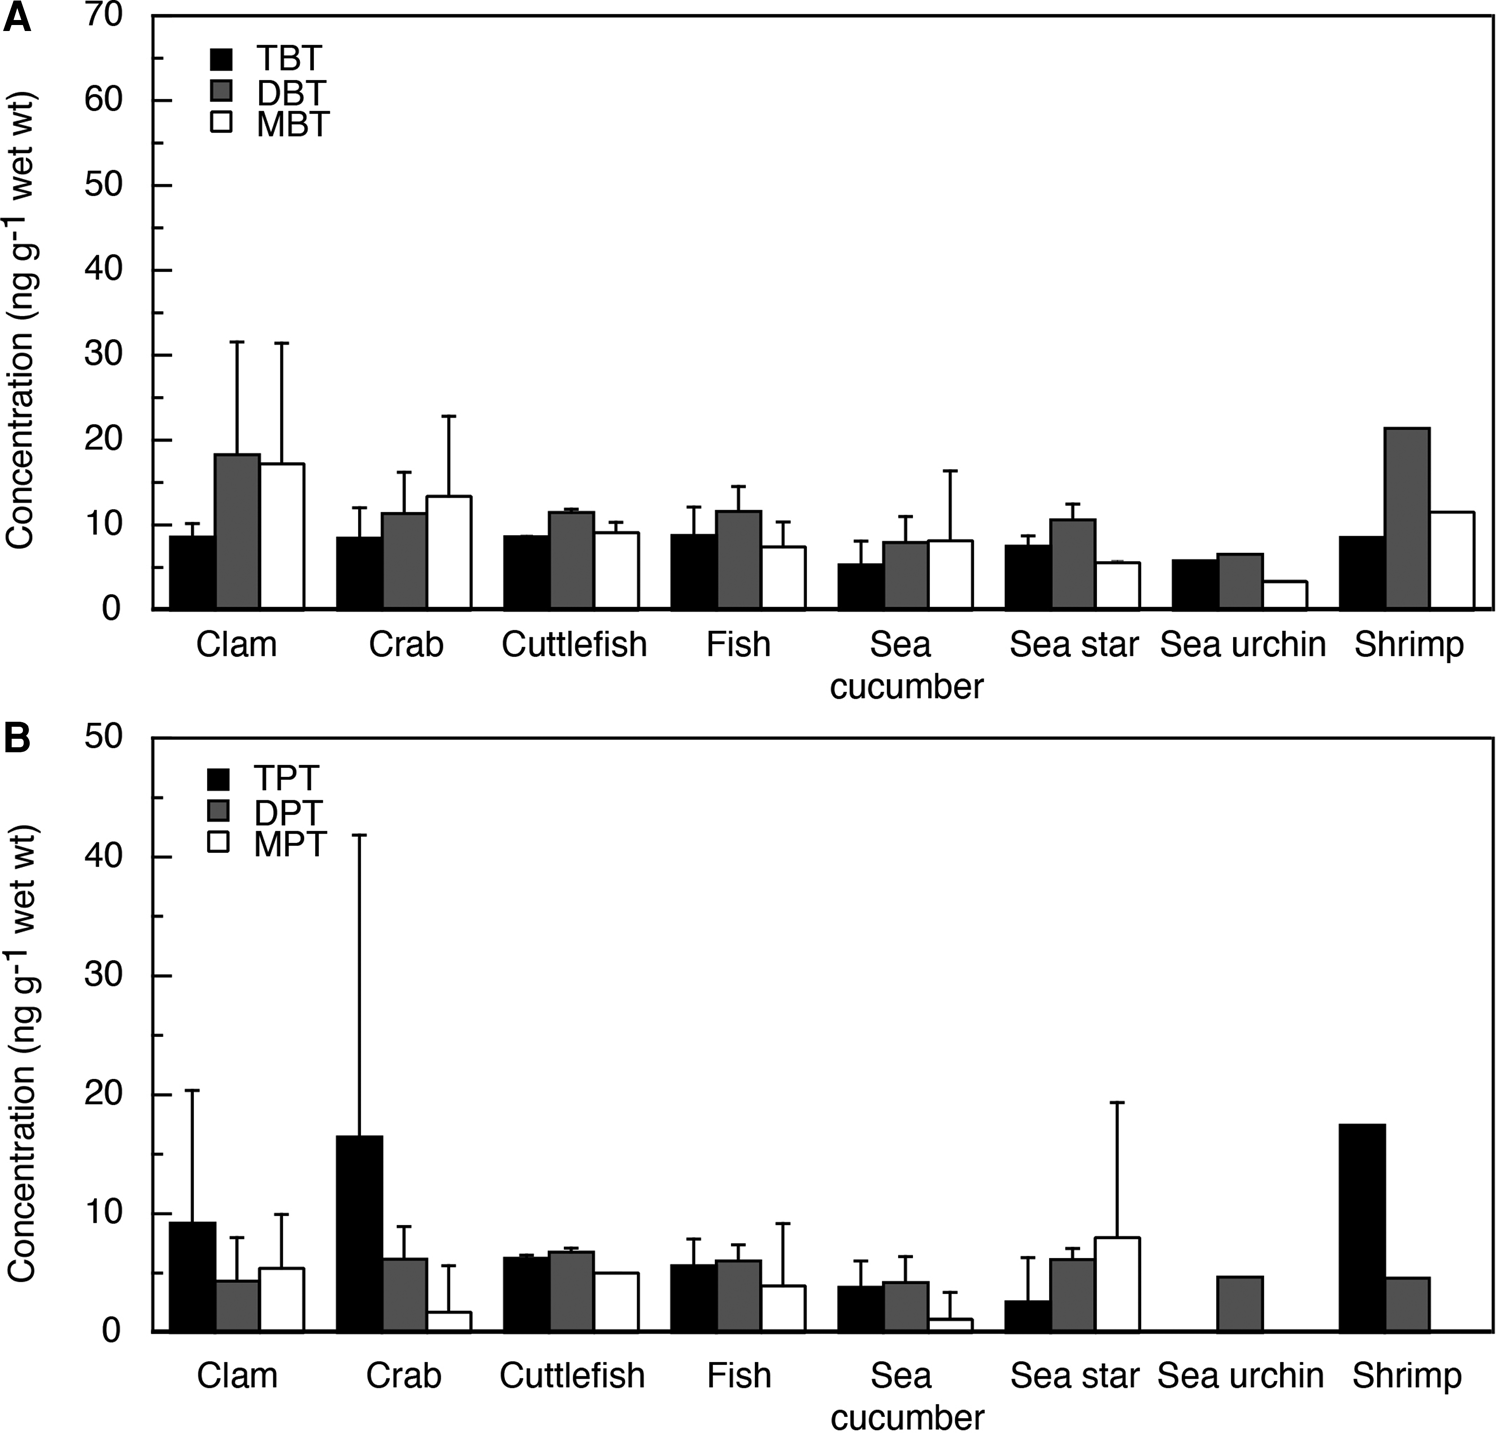
Fig. 3. Concentrations of BTs (A) and PTs (B) in biota from Tinggi Island.
Table 3. Concentrations of BTs and PTs (ng g−1 wet wt) in biota from Merambong and Tinggi Island, Malaysia, in 2012
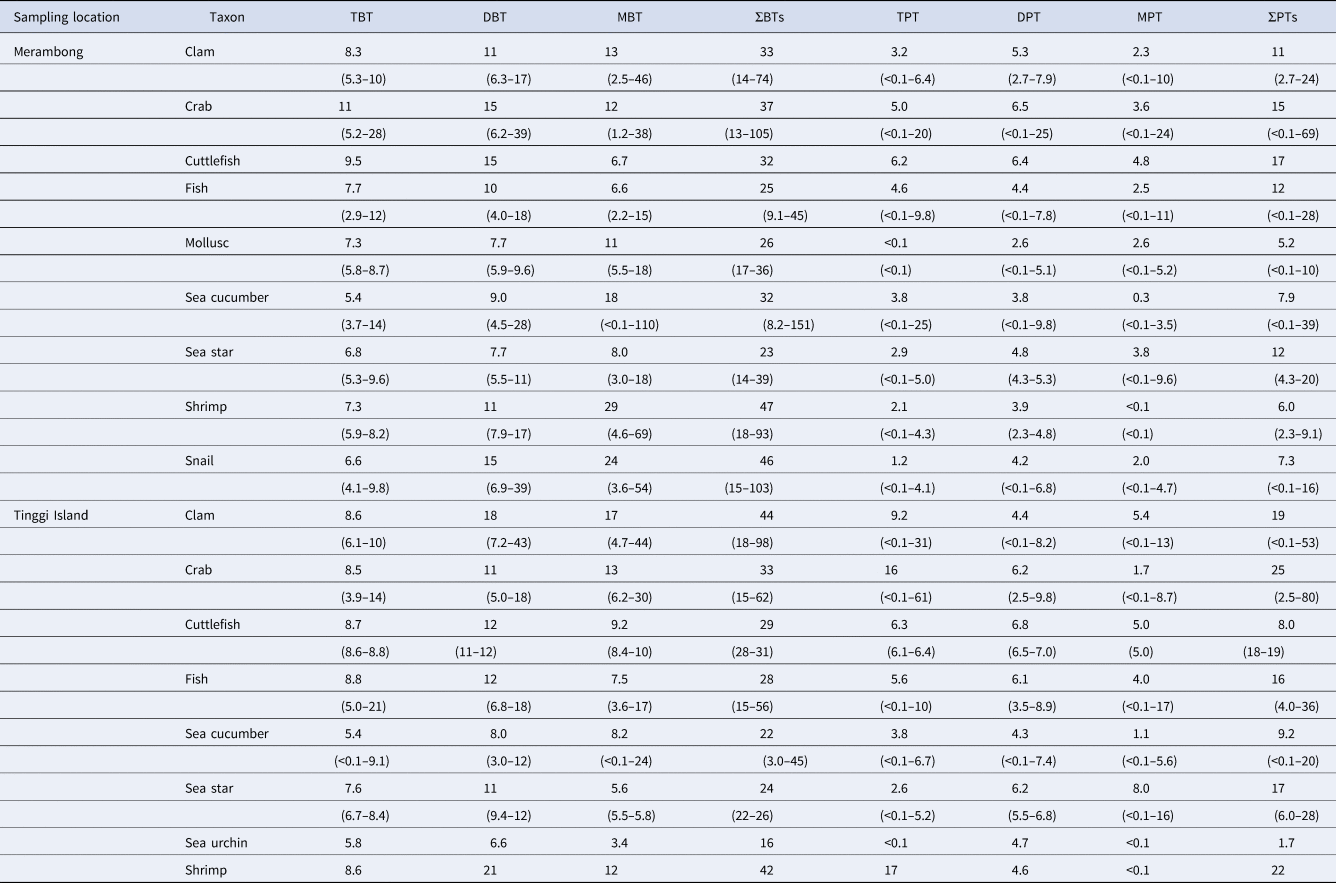
Parentheses show the range of concentration of each compound.
Mean TBT levels were in the range of 5.4–11 ng g−1 ww in aquatic organisms from Merambong (Table 3, Figure 2). The concentrations of TBT were compared among species of aquatic organisms, revealing similar levels. The ratio of DBT and MBT, which are degradation products of TBT, were higher than those of TBT in each aquatic organism from Merambong (Figure 4). Mean TBT levels were in the range of <0.1–21 ng g−1 ww in aquatic organisms from Tinggi Island (Table 3, Figure 3). The mean concentrations of TBT among each species of aquatic organisms were similar to each other. In most aquatic organisms from Tinggi Island, the ratios of DBT and MBT among BTs were higher than those of TBT (Figure 5).

Fig. 4. Compositions of BTs (A) and PTs (B) in biota from Merambong.

Fig. 5. Compositions of BTs (A) and PTs (B) in biota from Tinggi Island.
The concentrations of PTs in each species of aquatic organisms from Merambong and Tinggi Island were measured (Table 3, Figures 2 and 3). The mean concentrations of the total PTs (∑PTs = TPT + DPT + MPT) from Merambong and Tinggi Island were, respectively, 10.5 ng g−1 ww, in the range of <0.1–69 ng g−1 ww, and 15.1 ng g−1 ww, in the range of <0.1–88 ng g−1 ww. In both regions, mean concentrations of ∑PTs were significantly lower than those of BTs (P < 0.0001), and those concentrations from Tinggi Island were significantly higher than those from Merambong (P < 0.0005) (Table 3, Figures 2 and 3).
TPT was detected in the range of <0.1–25 ng g−1 ww in aquatic organisms from Merambong (Table 3, Figure 2). Although the rate of each PT varies among aquatic organisms from Merambong, the ratios of MPT and DPT were higher than those of TPT (Figure 4). TPT in aquatic organisms in Tinggi Island was detected in the range of <0.1–61 ng g−1 ww (Table 3, Figure 3). Although in clam, crab and shrimp TPT was the dominant compound among PTs, in the other aquatic organisms from Tinggi Island the rates of the PTs were similar to or the rates of degradation products of TPT were higher than that of TPT (Figure 5).
Comparison with OT concentrations among species of aquatic organisms
Mean concentrations of BTs and PTs in each species of aquatic organisms from Merambong and Tinggi Island are shown in Table 3, Figures 2 and 3. Mean concentrations of ∑BTs in each species of aquatic organisms from Merambong were highest in the order of shrimp > snail > crab > clam > sea cucumber > cuttlefish > mollusc > fish > sea star. The concentrations of ∑PTs were highest in the order of cuttlefish > crab > sea star > fish > clam > sea cucumber > snail > shrimp > mollusc. The average concentration of ∑BTs in each species of aquatic organisms from Tinggi Island was highest in the order of clam > crab > shrimp > cuttlefish > fish > sea star > sea cucumber > sea urchin. The average concentrations of ∑PTs were highest in the order of crab > clam > cuttlefish > shrimp > sea star > fish > sea cucumber > sea urchin. Mean concentrations of BTs were higher than those of PTs in the samples from Tinggi Island, similar to the pattern in the samples from Merambong as shown in Table 3, Figures 2 and 3.
The relationships between δ 15N and each OT concentrations in the aquatic organisms were calculated to elucidate these factors. No correlation was observed between δ 15N and BT or PT in Merambong (P > 0.05) (Table 4). In contrast, although the correlation coefficients between δ 15N and OT compounds in aquatic organisms from Tinggi Island were low, positive correlations were observed between δ 15N on the one hand and, on the other, DBT, DPT, TPT and ∑PTs (P < 0.05) (Table 5).
Table 4. Correlation coefficient between each organotin compound and δ 15N in biota from Merambong

*P < 0.05, **P < 0.01.
Table 5. Correlation coefficient between each organotin compound and δ 15N in biota from Tinggi Island

*P < 0.05, **P < 0.01.
The relationships between weight and OT concentrations in aquatic organisms were also investigated (Table 6). Negative correlations between weight and ∑BTs were also observed in fish from Merambong (P < 0.05), and negative correlations between weight and ∑PTs were observed in clam from Tinggi Island (P < 0.05). However, no correlations between weights and OT concentrations in the other aquatic organisms were observed (P > 0.05).
Table 6. Correlation coefficient between weight and ΣBTs or ΣPTs in biota from Merambong and Tinggi Island

*P < 0.05.
Concentrations of organotin compounds in the tissues and organs of fish from seagrass area of Merambong
The concentrations of BTs were measured in muscle, liver and egg of fish from Merambong (Figure 6). BTs were detected in all tissues and organs examined in the present study. The mean concentrations of ∑BTs (24.5 ± 23.0 ng g−1) in liver were significantly higher than those in muscle (7.1 ± 1.9 ng g−1) (P < 0.01). The level of ∑BTs in egg was similar to that in muscle. In contrast, PTs were detected in few samples. No significant differences in ∑PTs were observed between muscle and liver (P > 0.1), and those levels were similar to those in egg.

Fig. 6. Concentrations of BTs in muscle, liver, and egg of fish in seagrass area of Merambong, 2013. M, muscle; L, liver; E, egg.
The rates of TBT, DBT and MBT among BTs are shown in Figure 7. In most fish, MBT was dominant among BTs, followed by DBT. In Eleuteronema tetradactylum, the rates of TBT in muscle and egg were higher than that in liver. TPT accounted for 100% of the total PTs in muscle, liver and egg, although MPT accounted for 100% in one muscle sample.
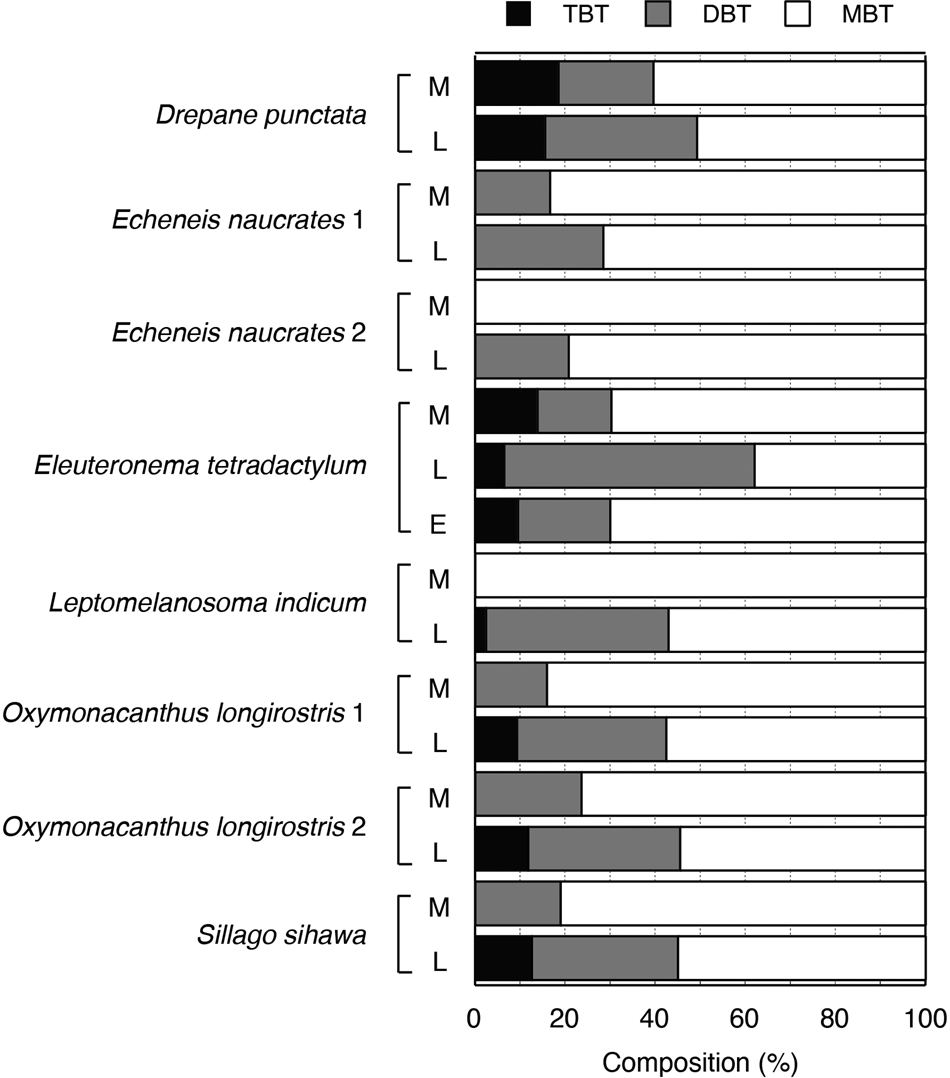
Fig. 7. Compositions of BTs in fish from seagrass area of Merambong, 2013. M, muscle; L, liver; E, egg.
Discussion
OT concentrations in aquatic organisms
Butyltin compounds were detected in aquatic organisms from Merambong and Tinggi Island. After the ban of the use of TBT by the IMO, there have been few reports on the concentrations of BT compounds in biota. For example, the concentrations of BTs were 16–31 ng g−1 dw in banded murex Hexaplex trunculus from the Adriatic Sea (Cacciatore et al., Reference Cacciatore, Brusa, Noventa, Antonini, Moschino, Formalewicz, Gion, Berto, Gabellini and Marin2018), 33–73 ng g−1 dw in rock shell Reisha clavigera from Hong Kong (Ho & Leung, Reference Ho and Leung2016) and 34–1676 ng g−1 dw in mussel Mytilus galloprovincialis from the Croatian Adriatic Coast (Furdek et al., Reference Furdek, Vahcic, Scancar, Milacic, Kniewald and Mikac2012). These concentrations of BTs in biota after the ban on OTs were in the range of 16–1676 ng g−1 dw. However, these values were on a dry weight basis. To compare with the concentrations of BTs and PTs, it is necessary to convert these values into wet weight. Verhaegen et al. (Reference Verhaegen, Monteyne, Neudecker, Tulp, Smagghe, Cooreman, Roose and Parmentier2012) reported that the dry weight to wet weight ratio of peeled shrimp was 22.4 ± 1.1%. Therefore, the mean water content of aquatic organisms was assumed to be 80%. Converted to a wet weight basis, the reported concentrations of BTs in aquatic organisms after the ban of OTs were in the range of 3.2–335 ng g−1 ww. The concentrations of BTs from Merambong and Tinggi Island were in the range of 8.2–151 ng g−1 ww and 3–109 ng g−1 ww, respectively. The concentrations of BTs from both locations were similar to the reported values.
TBT detected in samples from Merambong and Tinggi Island were in the range of 2.9–28 ng g−1 ww and <0.1–21 ng g−1 ww, respectively. TBT concentrations were 4–124 ng g−1 dw in brown shrimp (Crangon crangon) from the North Sea (Verhaegen et al., Reference Verhaegen, Monteyne, Neudecker, Tulp, Smagghe, Cooreman, Roose and Parmentier2012), <4–18 ng g−1 dw in H. trunculus from the Adriatic Sea (Cacciatore et al., Reference Cacciatore, Brusa, Noventa, Antonini, Moschino, Formalewicz, Gion, Berto, Gabellini and Marin2018), 13.3–35.7 ng g−1 dw in R. clavigera from Hong Kong (Ho & Leung, Reference Ho and Leung2016) and <6–1045 ng g−1 dw in M. galloprovincialis from the Croatian Adriatic Coast (Furdek et al., Reference Furdek, Vahcic, Scancar, Milacic, Kniewald and Mikac2012). When converted to a wet weight basis assuming a water content of 80%, the concentrations of TBT in aquatic organisms after the ban on OTs were in the range of <1.2–209 ng g−1 ww. TBT concentrations in samples from Merambong and Tinggi Island were near the low ends of the ranges of reported values.
Although the concentrations of TBT in aquatic organisms from Merambong and Tinggi Island were similar among the species, the ratios of TBT degradation products DBT and MBT among the total BTs were higher than those of TBT. Ohji et al. (Reference Ohji, Harino, Hayashizaki, Inoue, Yusoff and Nishida2019) reported that the rates of degradation products in sediment and leaves collected from Merambong and Tinggi Island in 2012 were higher than those of TBT. The rate of each BT in the aquatic organisms in this study showed a similar trend to that of sediment and leaves.
No significant differences in TBT concentrations between Merambong and Tinggi Island were observed in this study. Ohji et al. (Reference Ohji, Harino, Hayashizaki, Inoue, Yusoff and Nishida2019) reported that the average concentrations of TBT in sediment from Merambong and Tinggi Island in 2012 were 4.5 ng g−1 dw and 4.2 ng g−1 dw, respectively, and that TBT concentrations in Merambong were similar to those in Tinggi Island. Moreover, no differences were observed in average concentrations of BTs in mangrove leaves between those two regions. The horizontal distributions of TBT concentrations in aquatic organisms were similar to those in sediment and leaves.
The concentrations of BTs in aquatic organisms from Merambong were similar to those from Tinggi Island. Ohji et al. (Reference Ohji, Harino, Hayashizaki, Inoue, Yusoff and Nishida2019) reported that the BT concentrations in sediment from Merambong were higher than those in sediment from Tinggi Island in 2012, and there were no significant differences in the total BT levels in leaves between two regions. The BT concentrations in sediment show contamination from the past, because the half-lives of BTs in sediment are several years (Langston et al., Reference Langston, Pope, Davey, Langston, O'Hara, Gibbs and Pascoe2015). On the other hand, the concentrations of BTs in leaves show current contamination. In aquatic organisms, the trend of BT concentrations between Merambong and Tinggi Island was similar to that in leaves; Merambong is located in an industrial area, and Tinggi Island is used as a resort area. Despite the differences in industrial bases the status of BT contamination in aquatic organisms is similar between two locations.
Phenyltin compounds were also detected in aquatic organisms from Merambong and Tinggi Island. There were few reports regarding the levels of PTs in biota. ∑PT concentrations were 541–6855 ng g−1 dw in R. clavigera from Hong Kong (Ho & Leung, Reference Ho and Leung2016), and <11–126 ng g−1 dw in M. galloprovincialis from the Croatian Adriatic Coast (Furdek et al., Reference Furdek, Vahcic, Scancar, Milacic, Kniewald and Mikac2012). These concentrations of PTs in biota after the ban on OTs were in the range of <11–6855 ng g−1 dw. Converting those concentrations to a wet weight basis, assuming water content of 80%, the concentrations of PTs in biota after the ban were in the range of <2.2–1371 ng g−1 ww. The concentrations of PTs from Merambong and Tinggi Island were in the ranges of <0.1–69 ng g−1 ww and <0.1–88 ng g−1 ww, respectively. PT concentrations in Merambong and Tinggi Island were near the low ends of the ranges of the reported values, as were BT concentrations.
TPT was detected in each species from Merambong and Tinggi Island in the ranges of <0.1–25 ng g−1 ww and <0.1–61 ng g−1, respectively. TPT levels were 1–24 ng g−1 dw in C. crangon from the North Sea (Verhaegen et al., Reference Verhaegen, Monteyne, Neudecker, Tulp, Smagghe, Cooreman, Roose and Parmentier2012), 489–6404 ng g−1 dw in R. clavigera from Hong Kong (Ho & Leung, Reference Ho and Leung2016) and <11–126 ng g−1 dw. in M. galloprovincialis from the Croatian Adriatic Coast (Furdek et al., Reference Furdek, Vahcic, Scancar, Milacic, Kniewald and Mikac2012). Conversion of these reported values to a wet weight basis, assuming 80% water content, gives us 0.2–1281 ng g−1 ww of TPT in biota after the ban on OTs. Triphenyltin concentrations in Merambong and Tinggi Island were near the low ends of the ranges of reported values.
The concentrations of total PTs in aquatic organisms from Tinggi Island were significantly higher than those from Merambong. Ohji et al. (Reference Ohji, Harino, Hayashizaki, Inoue, Yusoff and Nishida2019) did not detect PTs in sediment and did not observe differences in PT concentrations in leaves between the two areas in 2012. TPT in aquatic organisms from Merambong and Tinggi Island were detected in the range of <0.1–25 ng g−1 ww and <0.1–61 ng g−1, respectively. Ohji et al. (Reference Ohji, Harino, Hayashizaki, Inoue, Yusoff and Nishida2019) observed no differences in TPT levels between the two areas in 2012. The horizontal distributions of total BT and TPT in aquatic organisms were different from those in leaves.
Comparison of OTs concentrations among species of aquatic organisms
The differences in BT and PT concentrations in species of aquatic organisms are shown in Figures 2 and 3. The concentrations were similar between the two locations. Namely, the concentrations of BTs and PTs in crab and clam were high and those in fish were low. Crab and clam have narrow ranges of activity and are deposit feeders. Fish have a wide range of activity, and their food is mainly plankton and algae. In other words, the difference in concentrations may be due to the respective diets and habitats of these animals.
The correlations between δ 15N and OTs are discussed, because δ 15N was used as a food web indicator (Tables 4 and 5). Although weak, correlations were found between δ 15N on the one hand and, on the other, each TPT as well as total PT concentrations in biota from Tinggi Island, whereas no correlations were found between δ 15N and each TBT and total BT concentrations. It was reported that TBT was not accumulated through the food web (Stäb et al., Reference Stäb, Traas, Stroomberg, van Kesteren, Leonards, van Hattum, Brinkman and Cofino1996; Kono et al., Reference Kono, Minami, Yamada, Tanaka and Koyama2008). On the other hand, Kono et al. (Reference Kono, Minami, Yamada, Tanaka and Koyama2008) reported that TPT was accumulated through the food web. As these reports were published before the ban on TBT and TPT by the IMO, it is considered that these trends occurred when there were many TBT and TPT loads to the aquatic environment. Meanwhile, no correlation was observed between δ 15N and each OT concentration in biota from Merambong. It is considered that TBT and TPT were not accumulated through the food web, because the loads of TBT and TPT have decreased.
Correlations were found between TBT and TPT or total PT in Merambong and Tinggi Island. This suggested that TPT was used as an antifouling paint as well as TBT, and that, despite the small scale of the loads to the aquatic organisms, it is presumed that the accumulations of TBT and TPT in aquatic organisms have continued. It was reported that an extremely low concentration of TBT is toxic to susceptible organisms, such as molluscs (Gibbs et al., Reference Gibbs, Pascoe and Bryan1988; Lee, Reference Lee, Champ and Seligman1996) and crustaceans (Ohji et al., Reference Ohji, Arai and Miyazaki2002, Reference Ohji, Arai and Miyazaki2003), which might lead to disturbances in the dynamics of the populations in ecosystems.
Table 6 shows the relationships between the weights of various aquatic organisms and total BT or total PT. The correlation coefficient of the weight of fish from Merambong and total BTs, and that of the weight of clam from Tinggi Island and total PTs, were −0.410 and −0.741, respectively. It is considered that the correlation coefficient became negative because the loads of these OTs decreased, and that OT concentrations were diluted by the growth of aquatic organisms. No correlations were found between the weight of each species of the other aquatic organisms and the BT or PT concentration.
Concentrations of organotin compounds in the tissues and organs of fish from Merambong
The concentrations of BT compounds in muscles, liver and eggs of fish are shown in Figure 6. The BT concentrations in liver were higher than those in muscle. The rate of MBT was higher than those of the other BT compounds (Figure 7). These results shows that TBT absorbed by fish is concentrated in the liver and degraded. Among BTs, DBT and MBT were detected at high levels in the liver tissue of the pike (Stäb et al., Reference Stäb, Traas, Stroomberg, van Kesteren, Leonards, van Hattum, Brinkman and Cofino1996). TBT is known to be dealkylated in the liver by ethoxyresorufin O-deethylase (EROD) activity and P-450 enzymes (Fent & Bucheli, Reference Fent and Bucheli1994), thus in the present study TBT was degraded and excreted from fish via bile. The BT concentration in egg in Eleuterronea letradactylum is also shown in Figure 6. Considering the transition of BTs to the next generation, it is important to measure BT concentrations in eggs. The BT concentrations in eggs were of similar levels to those in muscle, suggesting the transition of BTs from parental females to their eggs. It was also reported that BTs transfer from parental females to offspring in the viviparous surfperch Ditrema temmincki (Ohji et al., Reference Ohji, Harino and Langston2018). BTs are suspected of having the potential for deleterious effects in the eggs or offspring of fish such as E. tetradactylum and D. temmincki. TBT has adverse effects in fish, such as physiological abnormality even at ambient water levels (e.g. Hall & Bushong, Reference Hall, Bushong, Champ and Seligman1996). Therefore, these contaminants might affect these fishes in the coastal ecosystems.
Conclusion
BT and PT concentrations were measured in various species of aquatic organisms from Merambong and Tinggi Island, Malaysia and were found to be within the reported ranges. The two regions showed no differences in levels of BT contamination. Among BTs, the ratios of DBT and MBT, which are the degradation products of TBT, were higher than those of TBT. The concentrations of PTs in Merambong and Tinggi Island were within the reported ranges. No differences were observed in TPT levels between the two regions.
No correlation was found between δ 15N and the concentrations of each OT in biota from Merambong, suggesting that TBT and TPT do not accumulate through the food web. However, it is presumed that the intake of both TBT and TPT in aquatic organisms has decreased, because weight was negatively correlated with TBT concentrations in aquatic organisms. In tissues and organs of fish, BT concentrations were higher in liver than in muscle. It is noteworthy that BTs were detected in egg, implying that there is a potential for BTs to affect future generations.
Thus, even after OTs were banned, they were detected in aquatic organisms, although at lower concentrations. As the present OTs levels still have the potential to affect marine organisms, it is important to continue the monitoring of OTs in biota.
Acknowledgements
The authors would like to thank the staff of University Putra Malaysia for their help with field sampling.
Financial support
This work was supported by the Core-to-Core program of the Japan Society for the Promotion of Science (JSPS), B. Asia–Africa Science Platforms ‘CREPSUM’ (K.I., a grant number JPJSCCB20200009); Grants-in-Aid for Scientific Research from the Japan Society for the Promotion of Science (JSPS) (M.O., grant numbers JP26701008, JP19K12366).


