


Introduction
Mechanistic understanding of how organisms respond to environment changes is crucial for assessing and then forecasting species distribution in the context of ongoing climate change. In the face of climate change, species are largely predicted to shift poleward as global temperatures increase or to experience local extinction (Allison et al., Reference Allison, Paula, Jim and John2005; VanDerWal et al., Reference VanDerWal, Murphy, Kutt, Perkins, Bateman, Perry and Reside2012; Sirami et al., Reference Sirami, Caplat, Popy, Clamens, Arlettaz, Jiguet, Brotons and Martin2017; Liao et al., Reference Liao, Li, Wang, Marshall, Hui, Ma, Zhang, Helmuth and Dong2021). For survival in newly occupied habitats, organisms develop behavioural, physiological and evolutionary adaptations (Huey et al., Reference Huey, Kearney, Krockenberger, Holtum, Jess and Williams2012; Somero et al., Reference Somero, Lockwood and Tomanek2017), and a species' capability of physiological and evolutionary adaptations and their plasticity determine ‘winners’ and ‘losers’ in response to climate change (Somero, Reference Somero2010). Therefore, assessing a species' physiological performance among different populations along a species distribution range, especially investigating the physiological characteristics of the newly established population, is essential for understanding population dynamics and biogeographic patterns in the context of climate change.
The composition and function of gut microbiota can strongly influence an animal's performance in different levels of biological organization. Extensive studies have shown that the gut microbial community of populations from different habitats is highly variable and helps animals adapt to their local environments (Offret et al., Reference Offret, Paulino, Gauthier, Château, Bidault, Corporeau, Miner, Petton, Pernet, Fabioux, Paillard and Blay2020). For example, the digestive bacterial microbiota of two bivalve species (oyster Crassostrea gigas and clam Ruditapes philippinarum) with different ecological niches show small differences. However, significant changes in their digestive bacterial microbiota were induced after days to months of implantation at different tidal levels (Offret et al., Reference Offret, Paulino, Gauthier, Château, Bidault, Corporeau, Miner, Petton, Pernet, Fabioux, Paillard and Blay2020). The interactions of internal microbiota with the external and internal environment may thus represent an important component of ecological fitness for molluscs in a new environment (Lokmer et al., Reference Lokmer, Kuenzel, Baines and Wegner2016). Hence, for understanding the change of species distribution range in the face of climate change, it is important to investigate the relationship between the gut and the environment microbial community along the species' distribution range.
Multiple factors, including temperature, pH, diet composition and others, can affect the composition of gut microbial communities, and the modes of microbial transmission between an animal's gut and their environment is complex (Carmody et al., Reference Carmody, Gerber, Luevano, Gatti, Somes, Svenson and Turnbaugh2015; Dill-McFarland et al., Reference Dill-McFarland, Peery, Pauli and Suen2015; Sylvain et al., Reference Sylvain, Cheaib, Llewellyn, Gabriel Correia, Barros Fagundes, Luis Val and Derome2016; Fontaine et al., Reference Fontaine, Novarro and Kohl2018; Soriano et al., Reference Soriano, Ramírez, Araujo, Gómez-Gil, Castro and Sánchez2018; Li et al., Reference Li, Xue, Zhang and Wang2020). As previous studies described, marine invertebrates can select specific environment microbes, and then form a gut microbial community which is different from the environmental microbial community (C. gigas and R. philippinarum) (Offret et al., Reference Offret, Paulino, Gauthier, Château, Bidault, Corporeau, Miner, Petton, Pernet, Fabioux, Paillard and Blay2020). Therefore, it is important to clarify the relationship between an animal's gut microbiota and the local bacterial community from their environment to aid an understanding of how an animal adapts to its local environment from the perspective of gut microbiota.
The intertidal rocky shore is a key interface of ocean, atmospheric and terrestrial environments, and rocky intertidal species are subject to a frequent emersion and immersion cycle (Stillman & Somero, Reference Stillman and Somero1996; Helmuth et al., Reference Helmuth, Mieszkowska, Moore and Hawkins2006). Thus, the gut microbial community can be affected by microbial communities on the rocky shore and planktonic microbiota in the seawater. In the face of climate change, some rocky intertidal species are experiencing a poleward distribution shift (Zacherl et al., Reference Zacherl, Gaines and Lonhart2003; Helmuth et al., Reference Helmuth, Mieszkowska, Moore and Hawkins2006). For instance, along the European Atlantic rocky intertidal zone, the dominant species shifted to the cold-affinity species (Burrows et al., Reference Burrows, Hawkins, Moore, Adams, Sugden, Firth and Mieszkowska2020). The blue mussel Mytilus edulis had extended its range a further 500 km northward to Isfjorden on Svalbard Island by 2002 (Berge et al., Reference Berge, Johnsen, Nilsen, Gulliksen and Slagstad2005). A northward distribution shift of rocky intertidal species has also been found along China's coastline (Dong et al., Reference Dong, Huang, Wang, Li and Wang2016; Wang et al., Reference Wang, Wang, Choi, Ding, Li, Han, Ding, Guo, Huang, Duan, Cheng, Chen, Hawkins, Jiang, Helmuth and Dong2020). During a northward distribution shift, intertidal species have to cope with their local environmental factors, and so it is important for mechanistic understanding of how rocky intertidal species survive in the newly occupied environment to investigate the relationship between gut microbiota and environmental microbiota.
The snail Nerita yoldii behaves as a grazing gastropod living in the intertidal zone, mainly deriving foods by nibbling rocks with benthos and plankton (Ding et al., Reference Ding, Wang and Dong2018). This species has been experiencing a northward distribution range shift in recent decades (Wang et al., Reference Wang, Yan, Cheng, Huang, Wang, Ding and Dong2018, Reference Wang, Wang, Choi, Ding, Li, Han, Ding, Guo, Huang, Duan, Cheng, Chen, Hawkins, Jiang, Helmuth and Dong2020). Nerita yoldii was first reported north of the Yangtze River Estuary on oyster reefs at Liyashan Oyster Reef (32°08′45″N 121°32′59″E) in the 1980s (Tong & Meng, Reference Tong and Meng1985). However, the northern range limit has moved to Zhonganpeng (33°01′N 120°52′E) according to a recent investigation (Wang et al., Reference Wang, Yan, Cheng, Huang, Wang, Ding and Dong2018). Therefore, N. yoldii is an excellent model species for studying the relationship between the gut microbiota and environmental bacteria in the context of species distribution range shift. In the present study, we aimed to study the relationship between the host's gut microbiota and the intertidal environmental microbial community on the rock and in the water along China's coast by determining the composition of gut microbiota of the intertidal snail N. yoldii using 16S rRNA amplicon sequencing analysis.
Materials and methods
Sample collection
Samples of the snail N. yoldii (N = 5), rock chips (N = 3) and the surrounding seawater (N = 3) were collected randomly and respectively from five locations along China's coastline in December 2018. Among these locations, two of them, Wenzhou (WZ, 27°51′N 121°10′E), Zhejiang and Xiamen (XM, 24°25′N 118°08′E), Fujian, are original populations on the natural rocky shore, and three of them, Zhonganpeng (ZAP, 33°01′N 120°52′E), Yangguangdao (YGD, 32°31′N 121°23′E) and Lvsi (LS, 32°06′N 121°35′E), Jiangsu, are newly established populations on the artificial shoreline (Figure 1). The 95% percentile of the air temperature 2 m above the ground (T 95) during the period four weeks before sampling was 2.73 °C, 4.61 °C, 4.81 °C, 7.72 °C and 13.84 °C in ZAP, YGD, LS, WZ and XM, respectively. All collected samples were put in an icebox, transported back to the laboratory and stored at −20 °C for further laboratory studies.

Fig. 1. Sampling sites. ZAP = Zhonganpeng (33°01′N 120°52′E), YGD = Yangguangdao (32°31′N 121°23′E), LS = Lvsi (32°06′N 121°35′E), WZ = Wenzhou (27°51′N 121°10′E), XM = Xiamen (24°25′N 118°08′E). The red point represents original populations on the natural shores, and the blue point represents newly established populations on artificial hard structures.
For seawater sample collection, 200 ml seawater was vacuum-filtered through Millipore 0.22 μm filtration paper (EMD Millipore Corporation, USA). For the rock samples, rock chips (~1 cm2) were collected from the rock surface that the snails inhabited, using a hammer and chisel on two transects (~30 m interval) at each site (Ding et al., Reference Ding, Wang and Dong2018).
DNA extraction and 16S rRNA gene sequencing
Genomic DNA extractions were performed using a modified cetyltrimethylammonium bromide (CTAB) method (Zhang & Lin, Reference Zhang and Lin2005). All samples were incubated with 0.5 ml CTAB buffer (2% CTAB, 1.4 M NaCl, 20 mM EDTA pH = 8.0, 100 mM Tris-HCl pH = 8.0, 0.2% SDS, 400 μg ml−1 proteinase K) at 56 °C for ~24 h for thorough cell lysis. DNA quality and quantity were checked using a NanoDrop device (ND-2000, Thermo Fisher Scientific, USA). After being qualified, those of the same type at the same place were mixed with the volume. The V4–V5 regions of the 16S ribosomal gene was PCR-amplified from the diluted genomic DNA template (1 ng μl−1). The PCR primers and the barcodes were designed as described in Caporaso et al. (Reference Caporaso, Lauber, Walters, Berg-Lyons, Huntley, Fierer, Owens, Betley, Fraser, Bauer, Gormley, Gilbert, Smith and Knight2012). PCR products were purified using the Agarose Gel DNA Purification Kit (Takara, Dalian, China). The libraries were constructed using Ion Plus Fragment Library Kit (Thermo Fisher Scientific, USA), and the quality and quantity of the final amplicon pool was checked using the fluorescent agent Qubit (Thermo Fisher Scientific, USA) and sequenced on an Ion S5™ XL platform (Thermo Fisher Scientific, USA).
Microbiota data analyses
The following steps were performed using the Quantitative Insights into Microbial Ecology microbiome analysis package (QIIME 2 2020.2) (Bolyen et al., Reference Bolyen, Rideout, Dillon, Bokulich, Abnet, Al-Ghalith, Alexander, Alm, Arumugam, Asnicar, Bai, Bisanz, Bittinger, Brejnrod, Brislawn, Brown, Callahan, Caraballo-Rodríguez, Chase, Cope, Da Silva, Diener, Dorrestein, Douglas, Durall, Duvallet, Edwardson, Ernst, Estaki, Fouquier, Gauglitz, Gibbons, Gibson, Gonzalez, Gorlick, Guo, Hillmann, Holmes, Holste, Huttenhower, Huttley, Janssen, Jarmusch, Jiang, Kaehler, Kang, Keefe, Keim, Kelley, Knights, Koester, Kosciolek, Kreps, Langille, Lee, Ley, Liu, Loftfield, Lozupone, Maher, Marotz, Martin, McDonald, McIver, Melnik, Metcalf, Morgan, Morton, Naimey, Navas-Molina, Nothias, Orchanian, Pearson, Peoples, Petras, Preuss, Pruesse, Rasmussen, Rivers, Robeson, Rosenthal, Segata, Shaffer, Shiffer, Sinha, Song, Spear, Swafford, Thompson, Torres, Trinh, Tripathi, Turnbaugh, Ul-Hasan, van der Hooft, Vargas, Vázquez-Baeza, Vogtmann, von Hippel, Walters, Wan, Wang, Warren, Weber, Williamson, Willis, Xu, Zaneveld, Zhang, Zhu, Knight and Caporaso2019).
Sequence quality control and feature table construction
The ‘dada2’ plugin was applied to control sequence quality and to export the feature table (via q2-dada2) (Callahan et al., Reference Callahan, McMurdie, Rosen, Han, Johnson and Holmes2016). After being denoised, the feature table and feature data were acquired, and then were summarized and visualized.
Statistical analysis
All amplicon sequence variants (ASVs) were aligned with MAFFT (via q2-alignment) (Katoh et al., Reference Katoh, Misawa, Kuma and Miyata2002). The phylogenetic tree of representative sequences was constructed using the ‘q2-phylogeny’ plugin (via q2-phylogeny) (Price et al., Reference Price, Dehal and Arkin2010). Due to different sequencing depths, all samples were rarefied to 5620 sequences per sample. To evaluate the complexity of gut microbiota, alpha diversity (Shannon index, observed OTUs) and beta diversity (weighted UniFrac, unweighted UniFrac, Jaccard distance and Bray–Curtis distance) were calculated using ‘q2-diversity’ plugin after the samples were rarefied (Lozupone & Knight, Reference Lozupone and Knight2005; Lozupone et al., Reference Lozupone, Hamady, Kelley and Knight2007). To access the beta diversity, we applied principal coordinate analysis based on Bray–Curtis distance metrics, which use phylogenetic information to calculate community similarity. Principal coordinates analysis (PCoA) was performed based on Bray–Curtis distance metrics and displayed with R software (version 4.0.1).
Taxonomy was assigned to ASVs using the ‘q2-feature-classifier’ (Bokulich et al., Reference Bokulich, Kaehler, Rideout, Dillon, Bolyen, Knight, Huttley and Caporaso2018) classify-sklearn naïve Bayes taxonomy classifier against the Greengenes 13_8 99% OTUs reference sequences (McDonald et al., Reference McDonald, Price, Goodrich, Nawrocki, DeSantis, Probst, Andersen, Knight and Hugenholtz2012). The sequences were classified to the phylum and genus level. At the phylum level, the top 10 phyla with the highest relative frequency were selected. At the genus level, the top 17 genera with the highest relative frequency were selected. The different levels of taxonomic classification were displayed using R software.
Predicted metagenomes
To explore the functional profiles of different samples, PICRUSt2 was used to determine the predictive metagenomes of the microbial populations from each sample. The predicted metagenomes were collapsed into different hierarchical categories (KEGG-Level-2 and 3). Variance was calculated using a two-sided Welch's t-test, which doesn't assume equal variance (Welch, Reference Welch1938), along with the Benjamini–Hochberg false discovery rate (FDR) (Benjamini & Hochberg, Reference Benjamini and Hochberg1995) statistic for multiple test corrections (Parks et al., Reference Parks, Tyson, Hugenholtz and Beiko2014). The confidence intervals were set to 95%. P value less than 0.05 was considered to be significantly different.
Results
Bacteria sequences
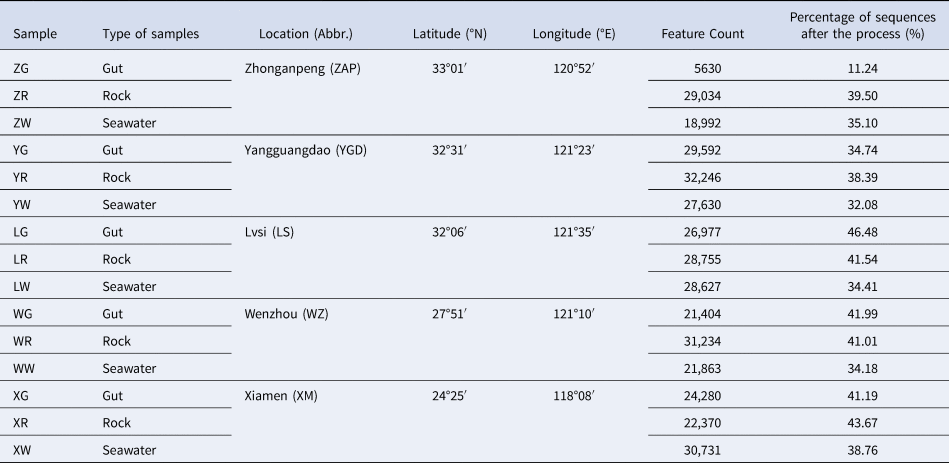
A total of 1,024,013 raw sequences was obtained from the samples in the five sites. After quality filtering and denoising, the number of sequences obtained per sample ranged from 5630 to 32,276 reads (Table 1). The total number of ASVs was 5411 after the process.
Table 1. Detailed information of locations and sequences in different samples
Microbial diversity
Alpha diversity was calculated to measure the species richness in the community and relative abundance among species (Figure 2A, B). The Shannon diversity of the gut microbial community (4.7 ± 0.7, mean ± SEM) was significantly lower than that of the rock samples (7.1 ± 0.2) (P < 0.01) (Figure 2A). Beta diversity was calculated to compare with the structure of microbial communities. Principal coordinate analysis (PCoA) results showed that the same types of samples clustered together, based on the Bray–Curtis distance (Figure 3). According to Bray–Curtis PCoA results, the gut microbial communities were significantly different from the rock (Adonis test, P = 0.008) and seawater samples (P = 0.009) (Figure 3).

Fig. 2. The alpha of different microbial communities. The Shannon diversity (A), observed OTUs (B). In panel (A) and (B), different letters represent significant differences.

Fig. 3. The beta diversity of different microbial communities. Principal coordinate analysis (PCoA) of microbial communities housed in three different types of samples.
Taxonomic classification among different samples
The composition of each sample was first visualized at the phylum level (Figure 4). At the phylum level, the gut microbiota across all sites were dominated by Tenericutes, followed by Bacteroidetes and Proteobacteria, with mean relative abundances of 48.1 ± 10.1, 11.0 ± 3.0 and 10.6 ± 2.1%, respectively. The rock microbiota was dominated by Cyanobacteria (40.0 ± 1.0%) and Bacteroidetes (31.9 ± 2.5%), followed by Proteobacteria (19.2 ± 1.9%) and Planctomycetes (3.5 ± 1.0%). The water microbiota mainly consisted of Proteobacteria (57.9 ± 1.3%), Actinobacteria (16.4 ± 4.1%) and Cyanobacteria (10.1 ± 3.0%) across all sites.

Fig. 4. Bacterial distribution based on the phylum taxonomic level. Only the top 10 phyla are shown in histogram and the other taxonomies are combined to ‘others; unassigned’.
At the genus level, Mycoplasma was the dominant genus in the gut microbial communities (48.0 ± 10.2%). Although this genus was ubiquitously distributed in all samples, its relative abundance was negligible in the rock (0.29 ± 0.07%) and water microbial communities (0.25 ± 0.07%). At the species level, only one species in the genus mycoplasma was annotated. The average number of sequences of this species is 10,885, 83 and 62 in gut, rock and water samples, respectively. The rock bacteriomes were dominated by Chroococcidiopsis (11.2 ± 1.4%) and Rubricoccus (6.2 ± 1.6%). The water bacteriomes were dominated by Pelagibacter (18.8 ± 5.1%) across all sites (Figure 5).

Fig. 5. Bacterial distribution based on the genus taxonomic level. Only the top 17 genera are shown in the histogram and the other taxonomies are combined to ‘others; unassigned’.
Predicted metagenomes
16S rRNA gene sequence data were subjected to Phylogenetic Investigation of Communities by Reconstruction of Unobserved States (PICRUSt2) analysis to predict the metabolic profile of the gut bacterial communities (Ng et al., Reference Ng, Stat, Bunce and Simmons2018). Using the Kyoto Encyclopedia of Genes and Genomes (KEGG) database, the functions of gut microbial communities were enriched in the pathways of biosynthesis of ansamycins, biosynthesis of vancomycin group antibiotics and fatty acid biosynthesis (Figure 6). Meanwhile, the enrichment of the pathway was positively correlated with the relative abundance of the genus Mycoplasma (Pearson correlation coefficient, r = 0.929).

Fig. 6. Heatmap showing the relative abundance of the pathways of gut microbiota based on PIURUSt2 (KEGG level-2). Only top 20 pathways were presented. The colour code indicates relative abundance (100%).
Discussion
Different compositions of microbial communities between gut, water and rock
Environmental factors can influence the composition and diversity of the gut bacterial community (Wong & Rawls, Reference Wong and Rawls2012). As an intertidal grazing gastropod, the snail N. yoldii obtains its food from both the rock biofilm and seawater (Hawkins et al., Reference Hawkins, Watson, Hill, Harding, Kyriakides, Hutchinson and Norton1989; Norton et al., Reference Norton, Hawkins, Manley, Williams and Watson1990; Ding et al., Reference Ding, Wang and Dong2018). The phytoplankton and the biofilm on the shore are regarded as the main food sources for intertidal grazers. In the present study, the most abundant phylum in the gut microbiota of N. yoldii was Tenericutes, while the most dominant phyla were Cyanobacteria and Bacteroidetes in the rock microbial community, and Proteobacteria in the seawater, indicating obvious differences of bacterial community composition in the gut from the rock and water. Our result is consistent with the results of the oyster, clam and sea urchin as previous studies have described (Hakim et al., Reference Hakim, Koo, Kumar, Lefkowitz, Morrow, Powell, Watts and Bej2016; Offret et al., Reference Offret, Paulino, Gauthier, Château, Bidault, Corporeau, Miner, Petton, Pernet, Fabioux, Paillard and Blay2020). These results imply that intertidal grazers can select microbial taxa from environmental microbiota.
The selection of specific microbial taxa is important for the formation of the gut microbiota (Vellend, Reference Vellend2010; Costello et al., Reference Costello, Stagaman, Dethlefsen, Bohannan and Relman2012). Diet and host factors influence the transmission and colonization by environmental microbes. The skin or gut acts as a biological filter, and selects for certain members from free-living microbes in the environment (Li et al., Reference Li, Li, Yao, Li, Zhang, Wirth, Cao, Lin and Li2016). Niche-selection in the digestive tract filters out species from the native pool that could not tolerate conditions in the gut environment. From the theory of meta-community dynamics, the assembly and maintenance of gut bacteriome may be a consequence of natural selection and neutral assembly process. Snails from different populations have similar composition of gut microbiota, suggesting that selection plays a primary role in determining the composition of gut microbiota. However, the mechanisms of how the snails select specific microorganisms are still unclear, and need to be investigated in further studies.
Gut microbiota can potentially help the snail in surviving in the intertidal zone
The composition and function of gut microbiota have a close relationship with species distribution (Li et al., Reference Li, Li, Yao, Li, Zhang, Wirth, Cao, Lin and Li2016; Zhang et al., Reference Zhang, Li, Tang, Liu and Zhao2018). The snail N. yoldii has been shifting its distribution northward along China's coastline over recent decades and has established new populations at its north distribution edge, i.e. ZAP (33°01′N) (Wang et al., Reference Wang, Yan, Cheng, Huang, Wang, Ding and Dong2018). Our previous study showed that the minimum temperature in winter is a limiting factor affecting the northward distribution of the snail, and animals at its northernmost distribution edge encounter severe cold stress (Wang et al., Reference Wang, Wang, Choi, Ding, Li, Han, Ding, Guo, Huang, Duan, Cheng, Chen, Hawkins, Jiang, Helmuth and Dong2020). Meanwhile, studies have shown that cold stress influences gut microbiota in some vertebrates. Intestinal microorganisms transplanted from a cold exposed environment can increase sensitivity to insulin and increase intestinal size and absorption capacity in mice (Chevalier et al., Reference Chevalier, Stojanović, Colin, Suarez-Zamorano, Tarallo, Veyrat-Durebex, Rigo, Fabbiano, Stevanović, Hagemann, Montet, Seimbille, Zamboni, Hapfelmeier and Trajkovski2015). In the present study, our results show that different populations in latitudes of the snails N. yoldii have divergent compositions of gut microbiota. The genera Mycoplasma, which has rare abundance in the environmental microbial communities, is enriched at a high abundance in the gut of the snail. The high relative abundance of Mycoplasma may imply an adaptation to environmental stress or diet-induced damage in the gut (Zhang et al., Reference Zhang, Liang, He, Chen, Wang, Li, Zhu, Zhang, Li and Alam2020). The difference in abundance of mycoplasma among different geographic populations needs to be further studied by well-designed common garden experiments in future.
From the perspective of gut microbial function, the biosynthesis of ansamycins is clearly enriched in the snail N. yoldii. The biosynthetic pathways of ansamycins are complex, involving the formation of 3-amino-5-hydroxybenzoic acid (AHBA) followed by backbone assembly by a hybrid non-ribosomal peptide synthetase/polyketide synthase. Ansamycins include the antibiotic rifamycin and the anti-tumour compounds geldanamycin and ansamitocin P-3 (Rude & Khosla, Reference Rude and Khosla2006). Ansamycin's synthetic and semisynthetic analogues are originally identified as potent inhibitors of certain kinases and are later shown to act by stimulating kinase degradation, specifically by targeting ‘molecular chaperones’, i.e. heat shock proteins (Ma et al., Reference Ma, Zhang, Yang, Zhu, Zhang, Wang, Liu, Zhang, Zhang, Liu and Begley2020). Other studies have shown that the benzoquinonoid ansamycin antibiotics had strong anti-tumour activity in vivo and in vitro by specifically binding geldanamycin (GA) and Hsp90 (Whitesell et al., Reference Whitesell, Shifrin, Schwab and Neckers1992). Therefore, ansamycins from gut microbiota are likely to play an important role in snails living in the local environment involving multiple mechanisms which need to be clarified in future.
Conclusions
In the face of climate change and seascape transformation, the intertidal species N. yoldii is experiencing a northward distribution shift, and it is expanding its northern boundary. The snail can possibly select rare microbial taxa from the environment, and enrich the genus Mycoplasma in the gut. Meanwhile, the pathway of biosynthesis of ansamycins is highly enriched. These results indicate that the composition and function of gut microbiota potentially assist the snail in coping with environmental stress and its survival on the shore.
Acknowledgements
The authors thank Dr Hongxia Zhang from the Institute of Oceanology, Chinese Academy of Science for her constructive comments on data analyses.
Author contributions
Ya-jie Zhu: Conceptualization, Methodology, Formal analysis, Investigation, Writing – original draft, Writing – review & editing, Visualization. Ming-ling Liao: Conceptualization, Methodology, Supervision, Writing – original draft. Meng-wen Ding: Conceptualization, Methodology, Investigation. Zhao-kai Wang: Conceptualization, Methodology, Resources. Yun-wei Dong: Conceptualization, Methodology, Writing – review & editing, Supervision, Funding acquisition.
Financial support
The study was supported by National Natural Science Foundation of China (41976142, 42025604), Chinese Postdoctoral Science Foundation (2020M672140), Young Elite Scientists Sponsorship Program by China Association for Science and Technology (CAST) (2019QNRC001) and the Fundamental Research Funds for the Central Universities.
Conflict of interest
The authors declare that they have no known competing financial interests or personal relationships that could have appeared to influence the work reported in this paper.


