INTRODUCTION
The continental margins form the interface between shelf seas and the deep ocean. They are characterized by steep depth gradients, varied seabed topography and hydrography, and in many areas are ‘hotspots’ of biogeochemical cycling, benthic biomass and biodiversity (Wefer et al., Reference Wefer, Billett, Hebbeln, Jørgensen, Schlüter and van Weering2003; Carney, Reference Carney2005; Levin & Dayton, Reference Levin and Dayton2009). Continental margins are also increasingly subjected to disturbance from human activities such as deep-water trawling, hydrocarbon extraction and waste disposal. Of the four deep-sea habitats recently assessed as being at highest risk of anthropogenic impact (Ramirez-Llodra et al., Reference Ramirez-Llodra, Tyler, Baker, Bergstad, Clark, Escobar, Levin, Menot, Rowden, Smith and Van Dover2011), two (canyons and sedimented upper slopes) are margin-specific, while a third (cold-water coral ecosystems) occurs frequently in margin settings (Roberts et al., Reference Roberts, Wheeler and Freiwald2006). Recognition of the importance of continental margins and a growing movement towards establishment of offshore marine protected areas (Davies et al., Reference Davies, Roberts and Hall-Spencer2007) has led to increased efforts to characterize the seabed environments and communities of these areas. Seabed imaging using still photography and/or video is an effective (and non-destructive) method of mapping the distribution of epibenthic megafauna, and has been widely used in continental margin studies worldwide (e.g. Mayer & Piepenburg, Reference Mayer and Piepenburg1996; Jones et al., Reference Jones, Bett and Tyler2007; Schlacher et al., Reference Schlacher, Williams, Althaus and Schlacher-Hoenlinger2010; Hunter et al., Reference Hunter, Oguri, Kitazato, Ansari and Witte2011).
In UK waters, the submarine banks, ridges and seamounts of the northern Rockall Trough were targeted by photographic surveys in 2005 and 2006 under the Department of Trade and Industry's Strategic Environmental Assessment (SEA) programme (Narayanaswamy et al., Reference Narayanaswamy, Howell, Hughes, Davies, Roberts and Black2006; Howell et al., Reference Howell, Davies, Hughes and Narayanaswamy2007). The extended continental slope which forms the eastern rim of the Rockall Trough has not been surveyed visually in comparable detail, although specific localities were intensively sampled using trawls throughout the 1970s and 1980s (Gage, Reference Gage1986). A sizeable resource of seabed images from this area was generated by research cruises mounted by the UK Natural Environment Research Council (NERC) in 1988 and 1995–1996. Additional material was collected on commercial surveys carried out by the Scottish Association for Marine Science (SAMS) in 1998. Selected images have appeared in publications dealing with bedforms and bottom-current activity (Howe & Humphery, Reference Howe and Humphery1995; Armishaw et al., Reference Armishaw, Holmes, Stow, Stoker, Evans and Cramp1998), environmental assessment and trawling impacts (Roberts et al., Reference Roberts, Harvey, Lamont, Gage and Humphery2000; Gage, Reference Gage2001, Reference Gage, Wefer, Billett, Hebbeln, Jørgensen, Schlüter and van Weering2002; Gage et al., Reference Gage, Roberts, Hartley and Humphery2005), and specific components of the benthos (Lamont & Gage, Reference Lamont, Gage, Mooi and Telford1998; Gage et al., Reference Gage, Lamont, Kroeger, Paterson and Gonzalez Vecino2000; Hughes, Reference Hughes2001), but until now the complete collection of >1400 seabed photographs has not been analysed in its entirety.
In this paper the complete image archive is used to describe and categorize depth-related zonation of seabed habitats and epibenthic megafauna from the outer shelf to the base of the Hebridean Slope. Where possible, regional variation at comparable depths is described to assess the spatial extent of habitats and communities along this extended continental margin. Observations are related to Howell's (Reference Howell2010) classification of north-east Atlantic deep-water biotopes. Seabed images are also used to quantify the extent of anthropogenic disturbance at the times and places surveyed. The survey stations are located in, or very close to, sites currently under consideration as potential offshore Marine Protected Areas (MPAs) (Scottish Government, 2012). A better understanding of habitat and community zonation will inform MPA selection and contribute to the future management of the Rockall Trough, an area that can justly be termed the ‘cradle of deep-sea biological oceanography’ (Gage, Reference Gage2001; Gordon, Reference Gordon2003).
MATERIALS AND METHODS
Survey areas
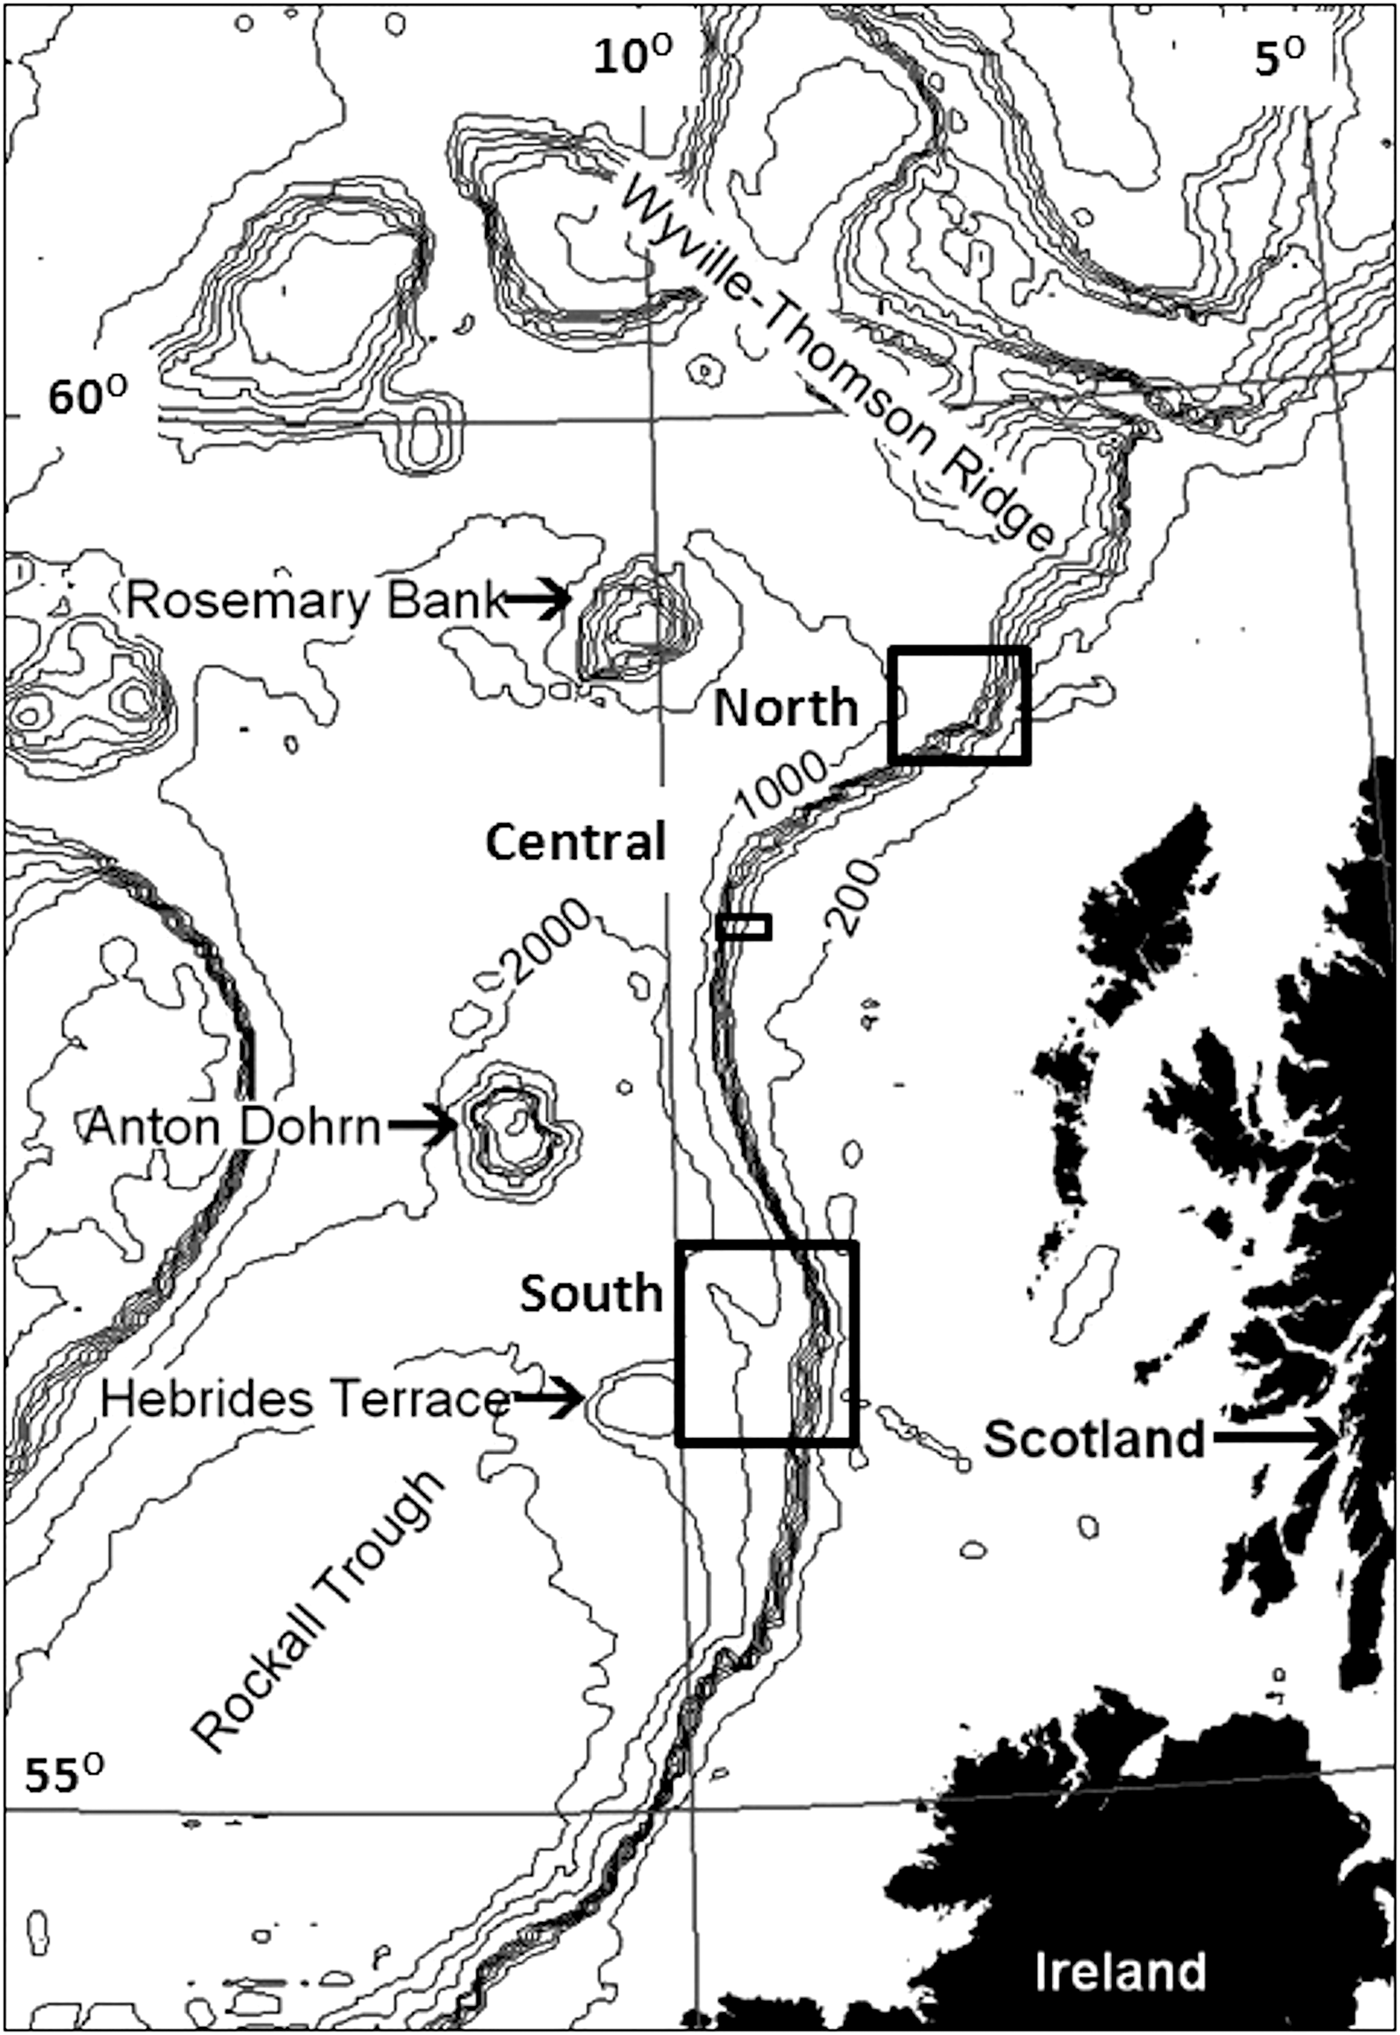
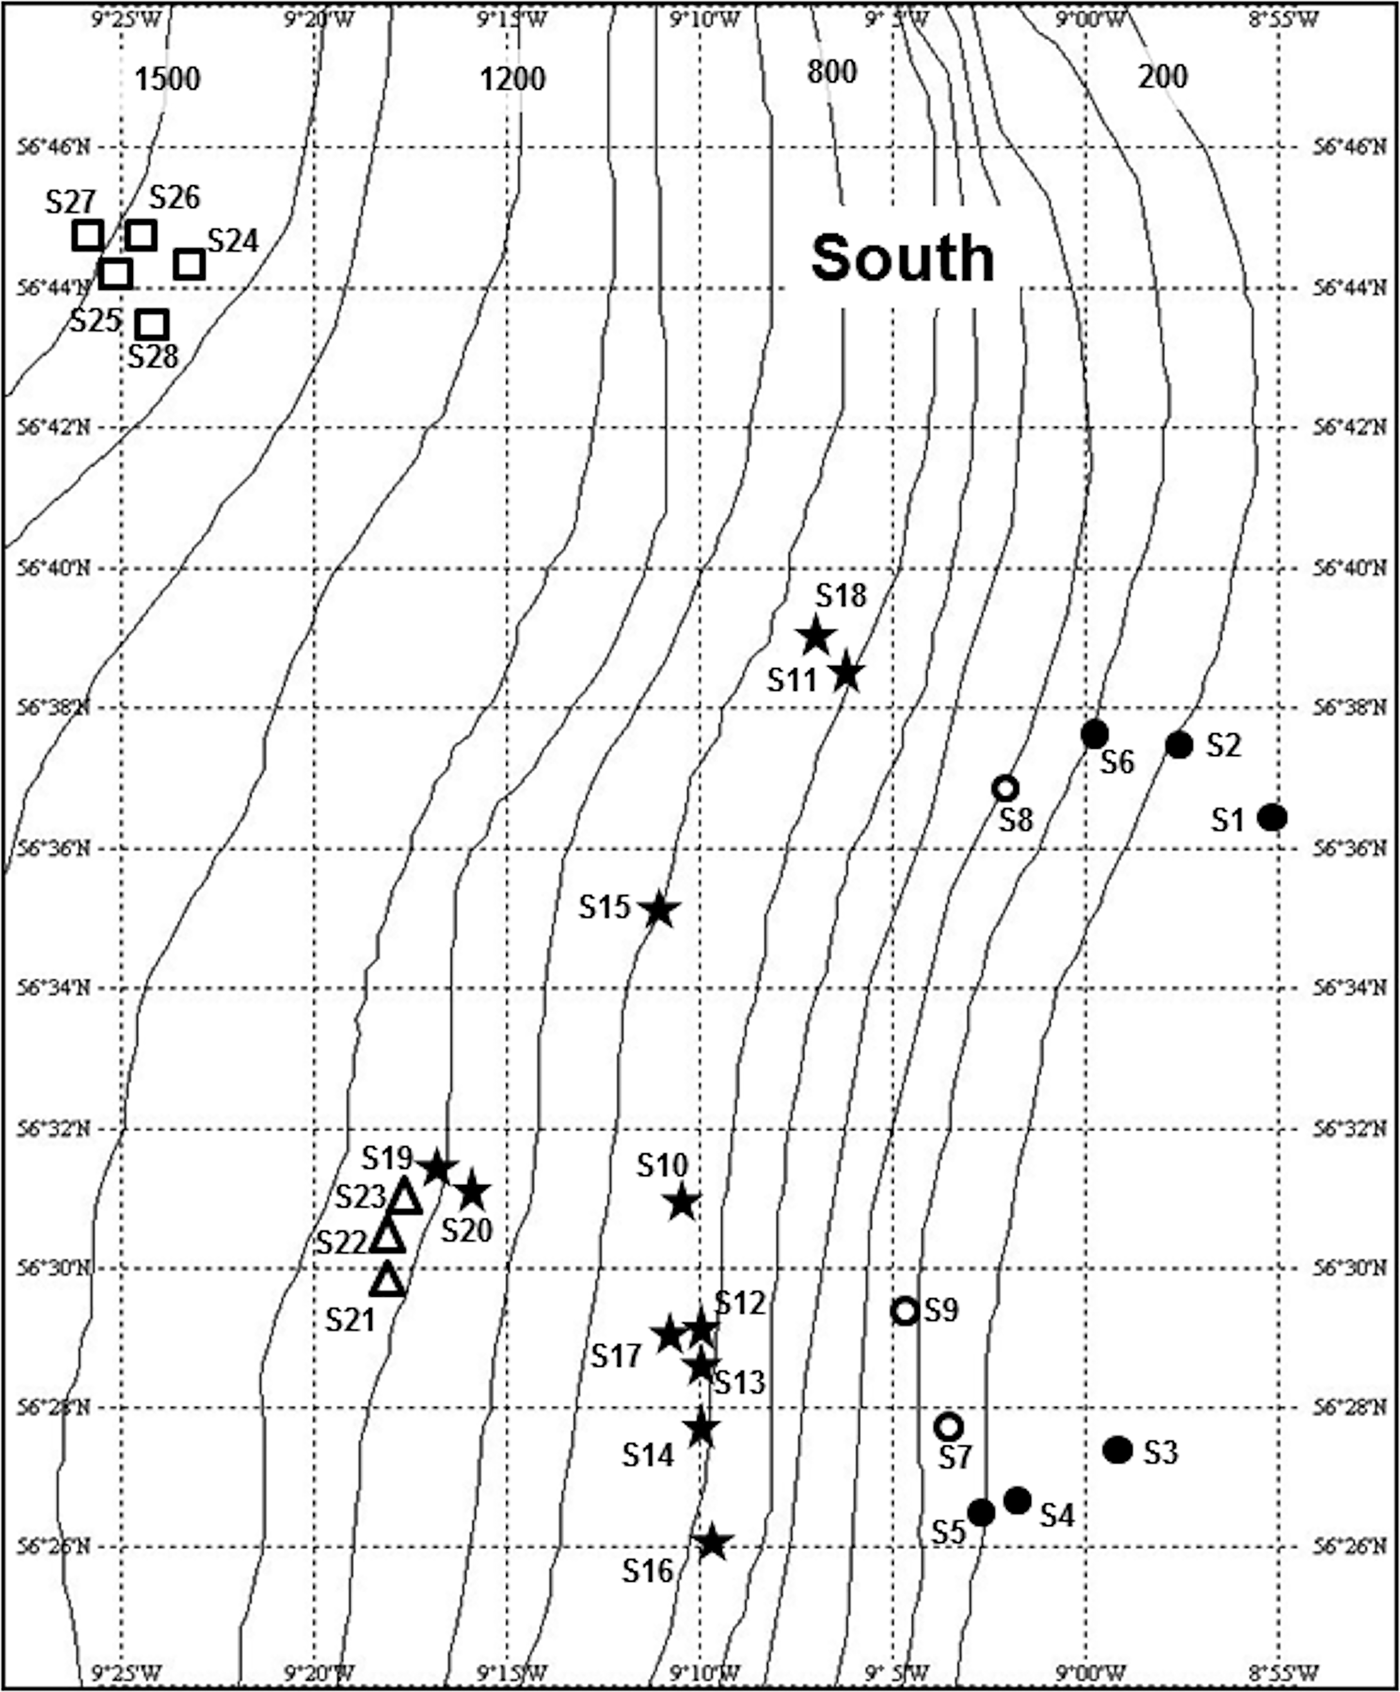
Seabed photographs were analysed from three areas along the continental slope west of the Hebrides (Figure 1). The South survey area was located on the Barra Fan (Armishaw et al., Reference Armishaw, Holmes and Stow2000), north-east of the Hebrides Terrace Seamount. This area was visited on seven research cruises of RRS ‘Challenger’ and RRS ‘Charles Darwin’ between March 1995 and August 1996, mounted as part of the NERC Land–Ocean Interaction Study—Shelf Edge Study (LOIS-SES) programme (Mitchell et al., Reference Mitchell, Harvey, Gage and Fallick1997; Carrie et al., Reference Carrie, Mitchell and Black1998). Photographic stations extended from the outer shelf (~140 m water depth) to a maximum depth of ~2050 m (Figure 2). Some photographic stations were visited only once, while repeat camera deployments were made at others (Appendix 1 in Supplementary Material), giving a total of 668 seabed images.

Fig. 1. Bathymetric chart of the northern Rockall Trough. Boxes indicate the three survey areas on the Hebridean Slope.
Fig. 2. Location and zonal assignment of photographic stations in the South survey area shown in Figure 1. Approximate depth contours (m) from the General Bathymetric Chart of the Oceans (GEBCO). Stations S29 and S30 were located outside the area shown, at ~57o N, 10o W. See legend to Figure 10 for key to station symbols.
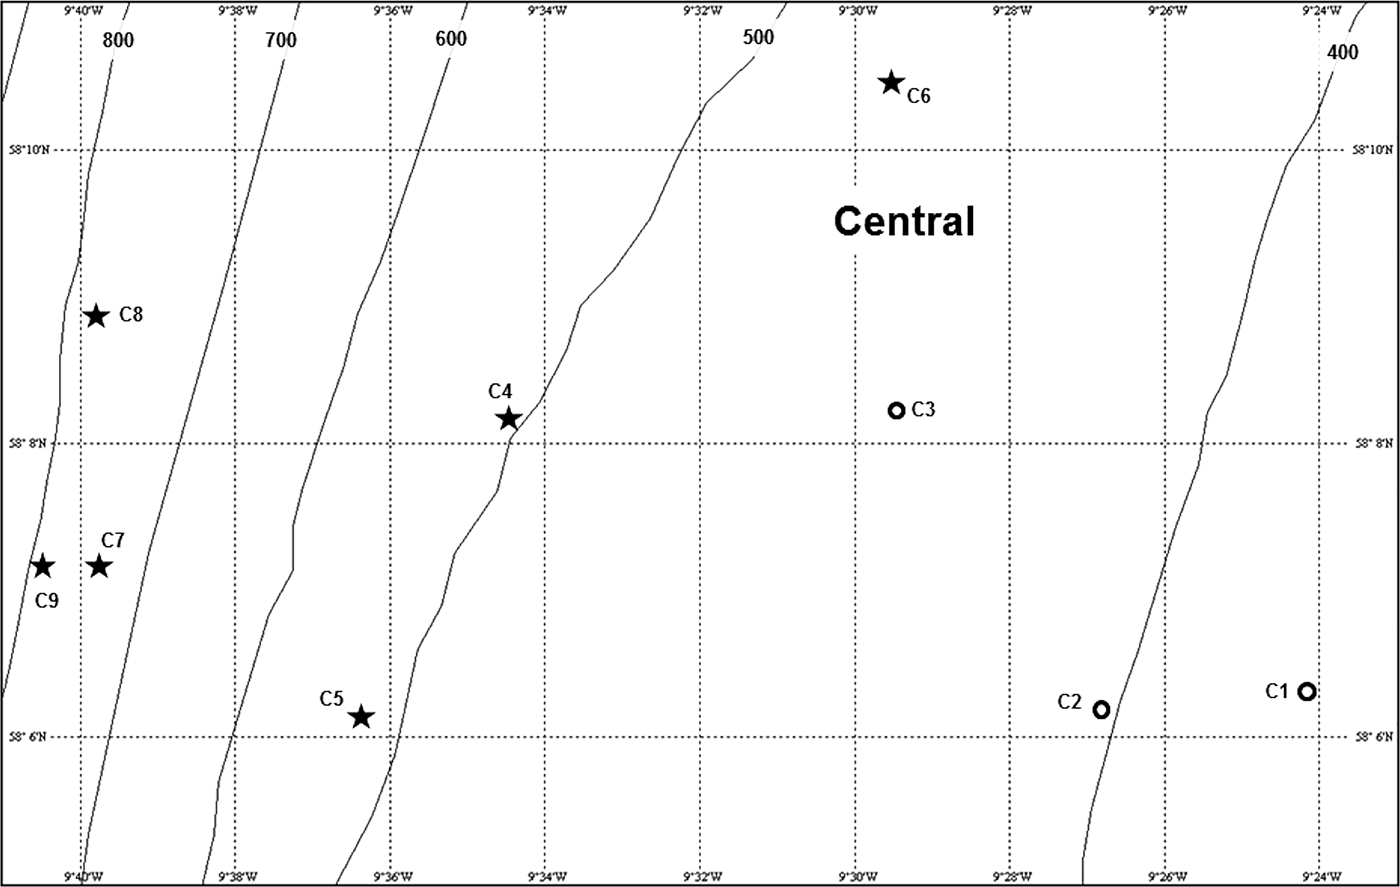
The Central survey area was located on the westernmost extension of the Scottish continental margin to the north-west of the St Kilda island group (Figure 1). This area was visited on RRS ‘Challenger’ cruise 26/88 in March 1988. Nine photographic stations covered a depth range of 350–885 m (Figure 3, Appendix 1 in Supplementary Material) and produced a total of 151 seabed images.
Fig. 3. Location and zonal assignment of photographic stations in the Central survey area shown in Figure 1. Approximate depth contours (m) from the General Bathymetric Chart of the Oceans (GEBCO). See legend to Figure 10 for key to station symbols.
The North survey area (Figure 1) was visited in 1998 on two baseline environmental surveys of areas licenced for hydrocarbon exploration. A February 1998 survey for Enterprise Oil plc (RRS ‘Discovery’ cruise 230C) included 11 photographic stations (prefixed A, B, C, D) in the depth range 721–1316 m (Appendix 1 in Supplementary Material). A May 1998 cruise on RV ‘Pelagia’, commissioned by Statoil UK, covered 12 stations (prefixed X, Y, Z, Appendix 1 in Supplementary Material) in the depth range 1293–1492 m. The shallowest May 1998 station was close to the deepest of those visited in February 1998, effectively linking both series into a single bathymetric transect (Figure 4). Seven additional stations (prefixed AG, Appendix 1 in Supplementary Material) were located further to the north-east in the depth range 707–992 m (Figure 4). The two cruises yielded a total of 624 images.

Fig. 4. Location and zonal assignment of photographic stations in the North survey area shown in Figure 1. Approximate depth contours (m) from the General Bathymetric Chart of the Oceans (GEBCO). See legend to Figure 10 for key to station symbols.
Appendix 1 (Supplementary Material) includes the station labels assigned on each survey, allowing reference back to the original cruise reports if required. The original labels used several different prefixes and numbering systems with no consistency across the study areas, so for greater clarity they are here re-labelled with a 1-letter prefix indicating the broad survey area (South, Central, North) and a number based on depth ranking in each area. The revised station labels will be used from here onwards.
Seabed photography
All seabed images were taken with a ‘bed-hop’ camera system. A 35 mm stills camera (125 ISO black-and-white print film) in a pressure housing was mounted in a steel frame, facing downwards at a 45o angle. A flashgun in a pressure housing was mounted below the camera. Camera and flash were fired by a bottom-switch activated by contact of a suspended weight with the seabed. A downwards-pointing acoustic pinger connected to the bottom-switch signalled at 1 s intervals when the steel cable was under tension. A doubling of the ping rate informed the operator (listening on the ship's acoustic system) that seabed contact had been made and a picture taken. A magnetic compass was mounted on an arm at the lower right corner of the camera's field of view in order to show the orientation of any current-shaped bedforms.
The system was deployed on the hydrographic wire and height above the seabed monitored on the ship's echosounder. After first seabed contact the system was raised about 5 m on the winch and allowed to hang for ~1 min, giving time for the film to wind-on and the flash to recharge. In calm conditions the vessel was allowed to drift passively between seabed contacts. In a surface swell the vessel steamed into the wind at low speed (0.5–1.0 knots) to maintain position on station while giving a short distance between successive contacts. The camera was loaded with 36-exposure film cassettes but contacts were limited to a maximum of 25 per deployment. Some deployments yielded fewer usable images as a result of flashgun misfires or water turbidity. Calculated straight-line distances between ship's position at beginning and end of a photographic sequence ranged from 11–1093 m (mean ±SD 270 ±288 m, with 26 out of 42 measurements <250 m). In many cases the camera track will have been meandering rather than linear, but deployments typically recorded seabed environments over a distance of much less than 1 km.
Photographic analysis
The original 35 mm negative strips were scanned and images saved in JPEG format. The oblique field of view is the same in all images, measuring ~2 m front to back, and 1.2 m across the lower edge. Digital images were examined on a computer screen, generally using Corel Paint Shop Pro X2TM with sharpening applied to improve resolution where required. Visible organisms were identified by comparison with physical specimens collected by SAMS and with reference to the known bathymetric ranges of epibenthic megafauna in the Rockall Trough (Gage, Reference Gage1986). All visible organisms were counted, unless not resolvable as individuals (e.g. encrusting epifauna). For counts of small organisms (principally the brittlestar Ophiocten gracilis) images with an overlaid perspective grid (Wakefield & Genin, Reference Wakefield and Genin1987) were enlarged by a consistent factor (165%) and subjected to a uniform degree of on-screen sharpening to ensure that counts were not biased by image magnification or resolution. Owing to the gradient in visibility created by the oblique field of view (Lamont & Gage, Reference Lamont, Gage, Mooi and Telford1998), small organisms were counted only in the lower half of the perspective grid (area 0.4 m2) and results scaled-up to density m−2.
Bathymetric zone definition
Stations were grouped into broad zones on the basis of water depth, visible substratum features and faunal composition. The zonation scheme was tested quantitatively by hierarchical cluster analysis using PrimerTM v.6 (Clarke & Warwick, Reference Clarke and Warwick2001). Analysis was performed on presence/absence data for 43 benthic invertebrate taxa, including two biogenic features (decapod burrows and echiuran worm feeding traces) used as proxies for the organisms responsible. Ideally, cluster analysis would be performed on abundance data (ind. m−2) but presence/absence was considered more appropriate where the small number of images station−1 meant that very few taxa were recorded often enough to allow reliable estimates of density. Fish species and invertebrate taxa of uncertain identity were excluded. Taxon presence/absence was recorded on 15 images station−1, a standardized number allowing 54 out of 69 stations to be included in the analysis (stations with <15 usable images were excluded).
RESULTS
Bathymetric zonation
Six bathymetric zones distinguished on the basis of substratum type and visible biota are described in order of increasing water depth. The depth ranges listed are those of the stations assigned to each category. Appendices 2–4 (Supplementary Material) list the presence at each station of the 63 nominal taxa recorded.
SHELF EDGE ZONE (136–227 m)
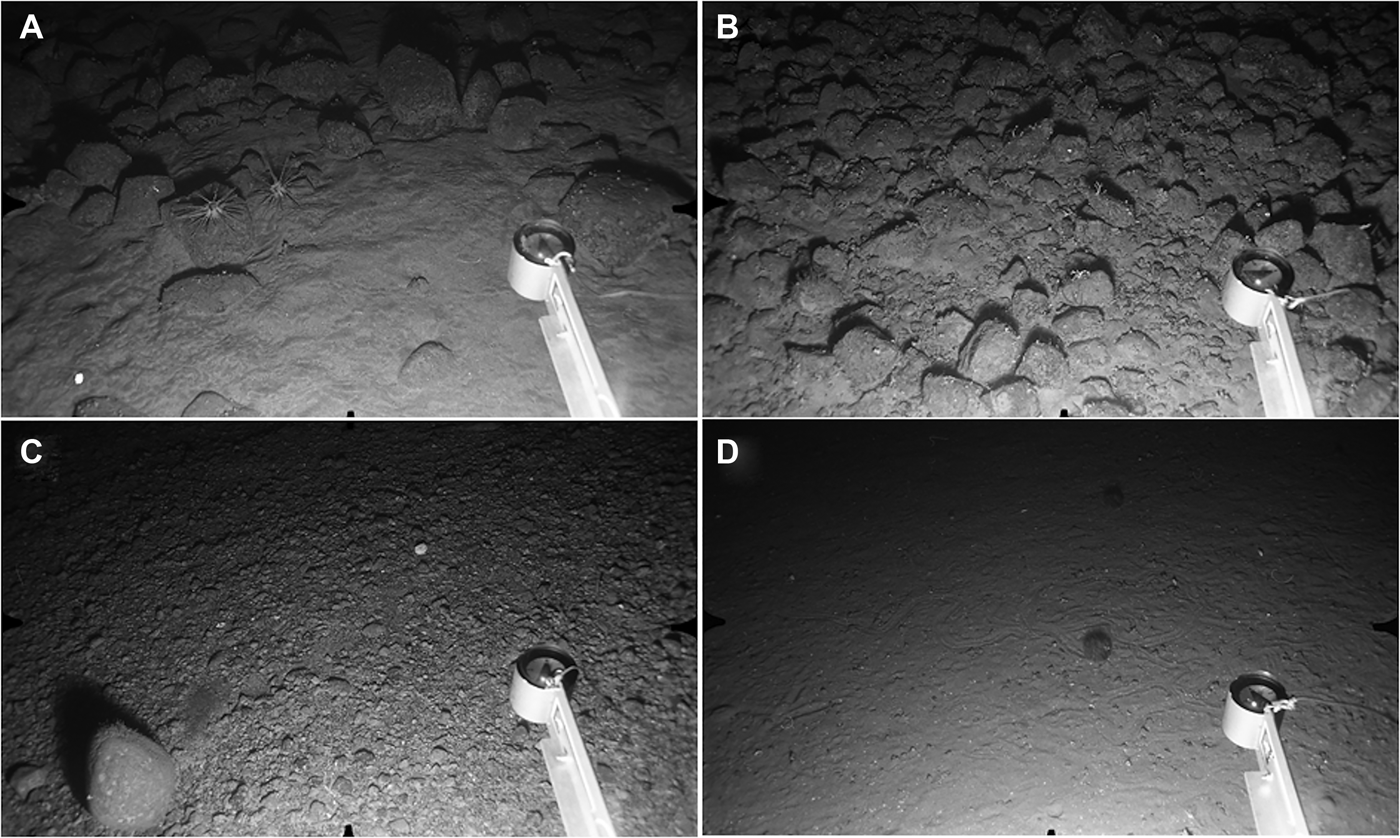
This depth range was only observed at stations S1–S6 in the South (Figure 2). Seabed habitats characterized by coarse substrata, often showing evidence of strong bottom currents, ranged from strongly-rippled sand with or without embedded cobbles (43% of photographs, Figure 5A), to flat pebble gravel with scattered cobbles or small boulders (33% of photographs, Figure 5B), linear ridges of sand overlying coarse gravel (9% of photographs) and dense fields of 10–15 cm diameter cobbles (16% of photographs, Figure 5C). Stations S1 and S6 were homogeneous, characterized by rippled sand and flat gravel respectively, whereas S3, S4 and S5 were more patchy, showing the full range of substratum types. At S3 and S4, this heterogeneity may reflect the large linear distance covered, ~1 km in both cases. The single photograph from S2 showed a field of cobbles embedded in sand. Scour and sediment deposition patterns around embedded cobbles at S1 and S2, and the north-south orientation of sand ridges at S4 indicate predominantly northwards near-bed current flow.
Fig. 5. Shelf Edge and Upper Slope Zones. Distance across lower field of view ~120 cm. (A) Station S1, 136 m: cobbles and small boulders embedded in rippled sand. Two urchins (Cidaris cidaris) at centre-left; (B) Station S3, 147 m: cobble field with sparse sessile epifauna; (C) Station S6, 227 m: pebble gravel plain, small boulder with sparse sessile epifauna at lower left; (D) Station C1, 350 m: sand with sparse pebble gravel and conspicuous epifaunal trails. Two urchins (Spatangus raschi) to right of vertical midline.
Cobbles and small boulders at all stations carried some sessile epifauna in the form of a sparse turf of small nodules, diffuse encrusting sheets and twig-like erect colonies. Precise identification is not possible but bryozoans are likely contributors to all three morphotypes, possibly accompanied by encrusting sponges and erect hydroids. No sessile megafauna (e.g. large sponges or anthozoans) were seen at any station. The sparse mobile megafauna consisted mostly of echinoderms. The long-spined urchin Cidaris cidaris was present at S1 (Figure 5A) but was not seen at the other stations. Single individuals were seen of the urchin Echinus esculentus, the sea stars Luidia ciliaris and L. sarsi (all at S3), the holothurian Parastichopus tremulus (S4) and a decapod crustacean Munida sp. (S6). Very small, unidentifiable sea stars were visible in small numbers in the cobble fields at several stations. Two fish were seen, a ling (Molva molva) at S5, and a small scorpaenid, possibly Helicolenus dactylopterus, at S4.
UPPER SLOPE ZONE (282–470 m)
The upper slope was observed in the South (Stations S7–S9) and Central (C1–C3) survey areas. The three southern stations (depth range 282–348 m) shared a relatively uniform benthic environment of pebble gravel overlain by coarse sand. Scattered larger cobbles were present, but there were no continuous cobble fields, as seen near the shelf edge. The rare cobbles appeared to be devoid of sessile epifauna. Mobile megafauna were uncommon, with many photographs lacking any visible animals. Very small, unidentifiable sea stars were present on 11 out of 56 photographs. A large brittlestar, probably Ophiura ophiura, was seen at S7 and S9 (four individuals total) and eight individuals of a small pectinid bivalve were recorded at S9. A single small octopus, probably Eledone cirrhosa, was seen at S7.
In the Central survey area, stations at slightly greater depths (350–470 m) showed a benthic environment rather different from that recorded in the south. Sediments were finer, possibly muddy sand, with a much lower content of small gravel particles and white shell fragments. Some depth gradation was apparent, with the substratum at C1 (350 m) being stonier than at C2 (390 m) or C3 (470 m). There was no obvious evidence of bottom-current activity, but the sediment surface at all three stations was marked by conspicuous epifaunal trails and small pits, holes and mounds made by burrowing infauna (Figure 5D). One photograph at each station showed a 50–60 cm diameter cluster of large (15–20 cm) oblique burrow openings, each with a rim of expelled sediment. No associated animals were visible, but burrow form matches the features made by many large decapod crustaceans in coastal sediments (Atkinson, Reference Atkinson1974, Reference Atkinson1986). The most common trail-maker was the spatangoid urchin Spatangus raschi, which was seen at C1 (19 individuals counted in 18 photographs, Figure 5D) and C3. Other trail-making epifauna included a regular urchin, either Gracilechinus acutus or G. elegans (five individuals), the holothurian Parastichopus tremulus (four individuals) and a large neogastropod, possibly Troschelia berniciensis (one individual). A single small octopus, probably Eledone cirrhosa, was seen at C2, and an unidentified flatfish at C1.
OPHIOCTEN GRACILIS ZONE (600–1000 m)
Stations characterized by high densities of the small brittlestar Ophiocten gracilis were recorded in all three survey areas. Fine-grained sediments, possibly fine sand or muddy sand, occurred at all stations, but there was some apparent variation in bottom-current activity. In the South, at the cluster of stations in the 671–714 m depth range (S10–S18, Figure 6A) sediments appeared very fine and had few or no surface pebbles. Slight rippling indicative of weak oscillatory flow was visible at S10, S12 and S15, but the other stations showed no signs of current activity. Sediment surfaces were marked by conspicuous epifaunal trails and sea star resting traces (Figure 6A). In the Central survey area the seabed at C4 (600 m) had a dense scatter of gravel and small pebbles with clear scour-and-tail features indicating significant current flow. Density of surface stones was much lower at Stations C5–C9 (Figure 6B) and there was little or no evidence of bottom currents. North stations in the depth range 794–918 m all showed visible signs of current activity, either in the form of scour-and-tail features around surface pebbles (N3, N7, N8), or clearly rippled sediment at stations with a low stone density (N4, N5, N6, N9, Figure 6C).
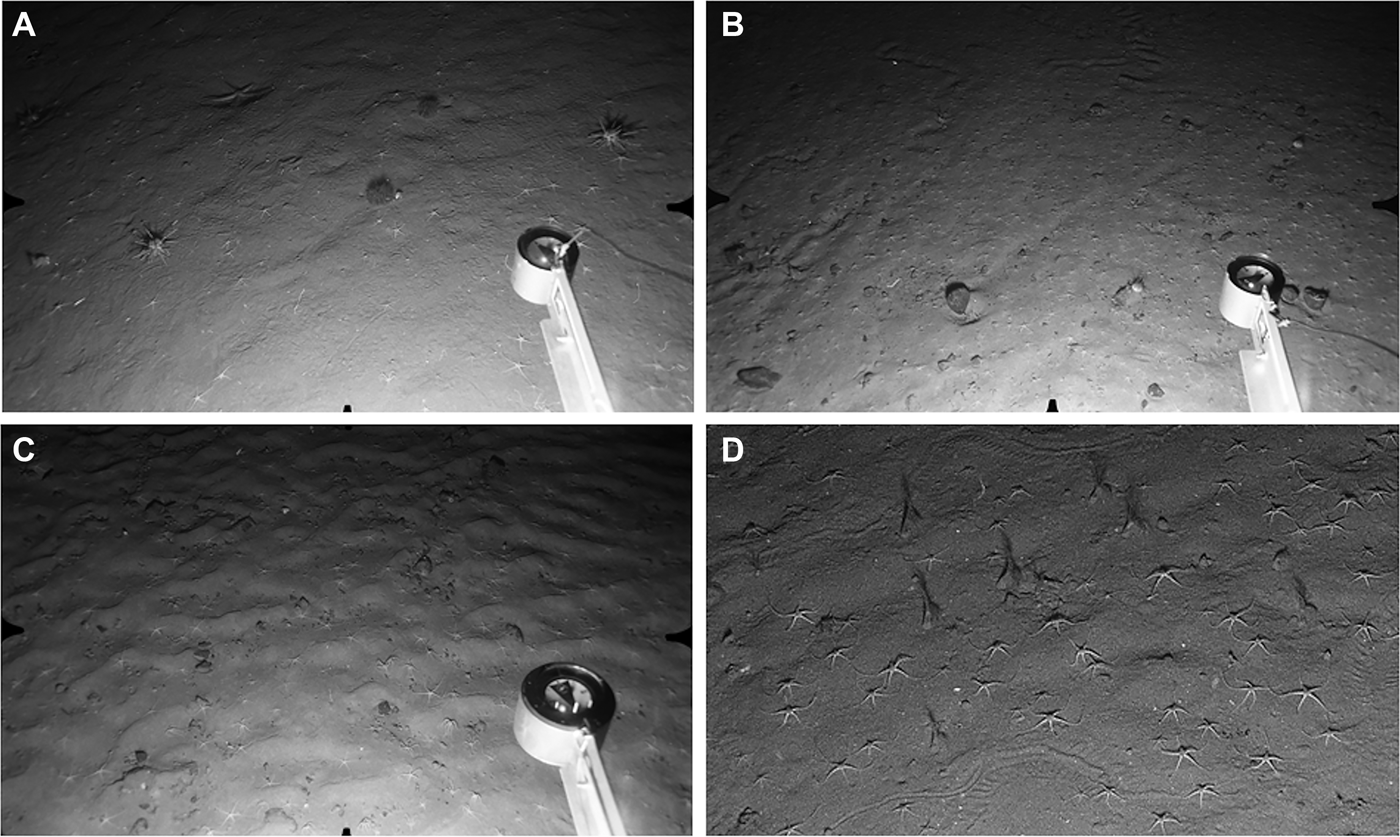
Fig. 6. Ophiocten gracilis Zone. Distance across lower field of view (A, B, C) ~120 cm. (A) Station S11, 686 m: fine sand with little evidence of current flow. Ophiocten gracilis with two individuals each of Cidaris cidaris and Spatangus raschi. Sea star (Luidia sarsi) at upper left; (B) Station C8, 863 m: sand with scattered surface pebbles. Ophiocten gracilis at higher density than in previous image. Urchin (Gracilechinus sp.) to left of compass head, with a second individual at upper right; (C) Station N6, 854 m: rippled sand with scattered surface pebbles and O. gracilis; (D) Station S17, 707 m: close-up image showing epifaunal trails, numerous O. gracilis and several cerianthid anemones with expanded tentacle crowns.
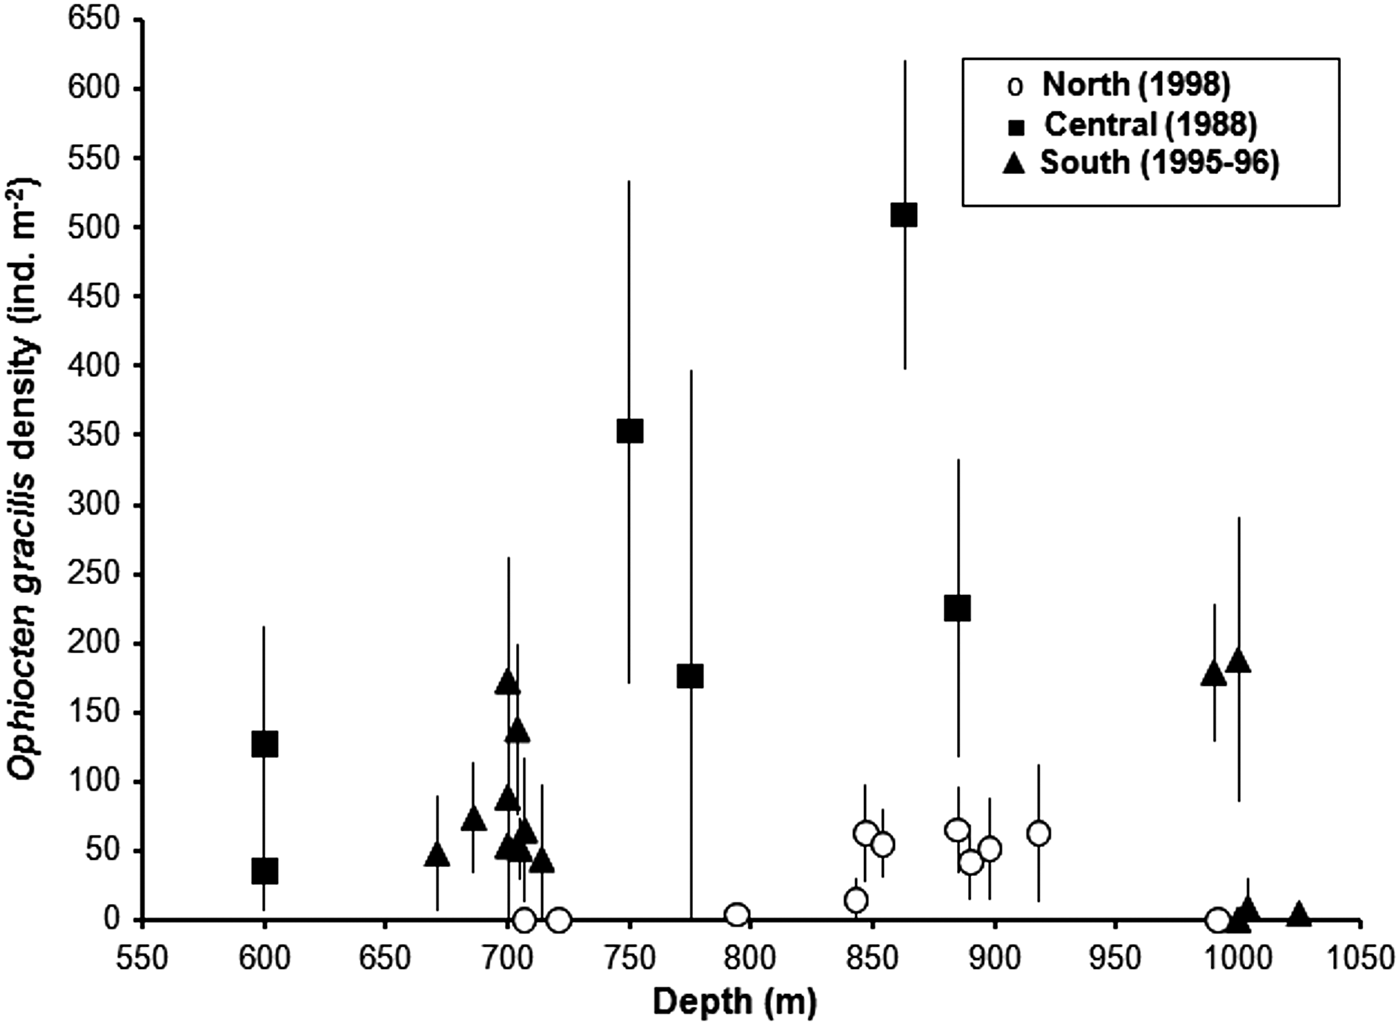
Highest O. gracilis densities were recorded in the Central survey area in the depth range 750–885 m (Figure 7). Mean density at Station C8 was >500 ind. m−2, with individual images showing up to 688 ind. m−2. The wide error bars for station means indicate a high level of patchiness in brittlestar distibution. Densities of O. gracilis at the ~700 m (S10–S18) South stations fit the bathymetric pattern of the Central area (Figure 7), but the large gap between the ~700 m stations and the next observations at ~1000 m makes it impossible to determine whether brittlestar abundance peaked at the same intermediate depth. In the North, O. gracilis occurred at moderate density (mean values <100 ind. m−2) at stations in the depth range 843–918 m, but was rare (station N3, 4 ± 5 ind. m−2) or absent at shallower depths (Figure 7). Stations N1 (707 m) and N2 (721 m) shared a substratum of gravelly mud with surface cobbles and occasional small boulders, with a sparse mobile epifauna of urchins (Spatangus raschi and Gracilechinus sp.), small hermit crabs and Munida sp. Ophiocten gracilis was not recorded. Sessile epifauna, including small brachiopods, were visible on the larger stones at both stations.
Fig. 7. Mean (± SD) density of Ophiocten gracilis at stations from 600–1025 m depth in the three regional surveys.
In the South, small cerianthid anemones occurred at high density (up to 31 ± 12 ind. m−2) at S10 and S15–S18, but were not recorded at S11–S14. They were invariably seen in a uniform orientation, with tentacle crowns expanded and facing in a northerly or north-westerly direction (Figure 6B). Cerianthids were not seen in the Central area, but were present in small numbers on a few photographs from North Stations N5 and N6. Besides O. gracilis, urchins were the most common and conspicuous mobile epifauna. Spatangus raschi and Gracilechinus acutus (and/or G. elegans) were recorded in roughly equal numbers in the South (total of 92 S. raschi, 85 Gracilechinus sp.). Further north, Gracilechinus was more common than S. raschi (Central survey area seven Gracilechinus sp., one S. raschi; North area 31 Gracilechinus sp., eight S. raschi). Cidaris cidaris was present at station S11 (11 individuals on 25 photos, Figure 6A) but was not recorded elsewhere. Rare species, seen on one or a few images per station included the holothurian Parastichopus tremulus, the sea stars Luidia sarsi and Pontaster tenuispinus, unidentified small hermit crabs (most stations), and a neogastropod, probably Troschelia berniciensis. The eel Synaphobranchus kaupii was present thoughout the depth zone in all three survey areas, often with several individuals visible per photograph. Single individuals of a few other fish species were recorded: small halibut (Hippoglossus hippoglossus) at S11 and C5, the morid Lepidion eques at C6, an alfonsino (Beryx decadactylus) at N7 and unidentified small grenadiers (Macrouridae) at S11, S14 and C5.
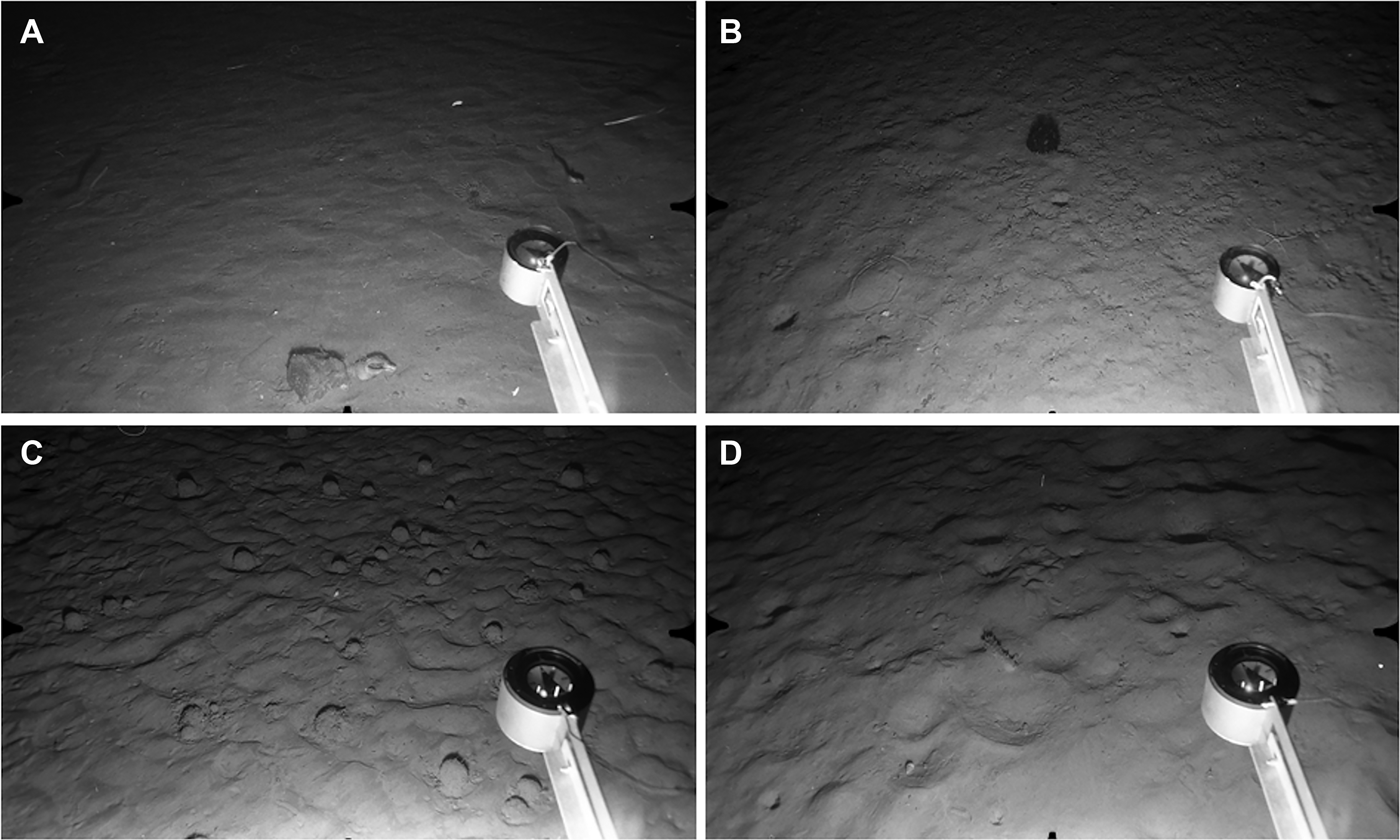
In the South, five stations (S19–S23, Figure 2) in the depth range 990–1025 m provided information on the lower limits of the O. gracilis zone. Stations S19 and S20 were both characterized by strongly-rippled fine sediment with rare surface pebbles and abundant O. gracilis (S19, 179 ± 49 ind. m−2; S20, 188 ± 102 m−2). In contrast, O. gracilis densities were very low at Stations S21–S23, slightly further to the south-west (S21, 0.5 ± 1.1 ind. m−2; S22, 9 ± 20 ind. m−2; S23, 5 ± 7 ind. m−2). These stations therefore appear to mark the approximate lower limit of the O. gracilis zone in this region of the slope. Visible bedforms indicate a difference in sediment type and/or hydrodynamic conditions between Stations S19–S20, S21 and S22–S23. The substratum at S21 consisted of fine sediment with occasional surface cobbles. The conspicuous rippling evident at S19 and S20 was absent but the largely featureless surface appeared to have been smoothed by near-bed current flow (Figure 8A). Stations S22 and S23 showed no visible evidence of bottom currents but had a high frequency of epifaunal trails and fine-scale biogenic relief (Figure 8B). Epifauna other than O. gracilis included a few individuals of Gracilechinus sp. (S19, S20, S21) and single specimens of an echinothuriid urchin, possibly Phormosoma placenta, at S20 and S22. At least two species of burrowing anemone, one an arachnactid, the other possibly a halcampoid, occurred sporadically at S19, S21 and S22. Synaphobranchus kaupii was seen at all five stations.
Fig. 8. Stations at 1000–1100 m depth. Distance across lower field of view ca 120 cm. (A) Station S21, 1000 m: current-smoothed fine sediment with large angular cobble near lower edge of field. Arachnactid anemone just above compass head, empty gastropod shell next to cobble. Three eels (Synaphobranchus kaupii) and small grenadier swimming close to seabed; (B) Station S22, 1004 m: fine sediment lacking evidence of current flow but showing burrow openings and epifaunal trails. Echinothuriid urchin (Phormosoma placenta) at upper centre, with large brittlestar (possibly Ophiopleura inermis) next to compass head; (C) Station N15, 1108 m: current-rippled fine sediment with numerous xenophyophores (Syringammina fragilissima); (D) Station N14, 1105 m: fine sediment with current-induced ripples and some biogenic traces. Holothurian (Laetmogone violacea) near centre of field.
XENOPHYOPHORE ZONE (992–1108 m)
Giant protists (xenophyophores) were present in very small numbers at the South Stations S19 (990 m) and S22 (1093 m) but were seen in much greater abundance at comparable depths in the North. Xenophyophores recorded from the Rockall Trough have been assigned to the species Syringammina fragilissima (Hughes & Gooday, Reference Hughes and Gooday2004), and this provisional identification is adopted here. Xenophyophores were the most abundant visible epifauna at Stations N11, N12, N13 and N15 (depth range 992–1108 m). The substratum at all these stations consisted of fine, conspicuously rippled sediment. There were no surface stones and little or no evidence of infaunal burrowing. Mean xenophyophore densities of 1–3 ind. m−2 were recorded at N11–N13, with higher abundance at N15 (mean 8.3 ± 5.8 ind. m−2, locally up to 23 ind. m−2, Figure 8C). Individuals were typically ~5 cm diameter, with occasional specimens up to 15 cm diameter. Other epifauna were rare, with unidentified small hermit crabs the most frequently recorded. Single individuals of the holothurian Laetmogone violacea were seen at N12, N13 and N14, and an echinothuriid urchin, probably Calveriosoma hystrix, at N12 and N15. Synaphobranchus kaupii was again the most common fish species. Single individuals of the rabbitfish Chimaera monstrosa were seen at N11 and N13.
Station N14 at similar depth (1105 m) and in close proximity to N12, N13 and N15, showed a rather different benthic environment. Bottom sediments appeared to be finer, lacked current-shaped bedforms, and were extensively burrowed by infauna (Figure 8D). Sea star traces and linear epifaunal trails were also common. Xenophyophores were not observed here. The sparse visible epifauna included Laetmogone violacea (Figure 7D) and Troschelia berniciensis (one individual each), and two specimens of an echinothuriid urchin (probably Phormosoma placenta). Synaphobranchus kaupii and an unidentified small ray were the only fish species observed.
DECAPOD BURROW ZONE (1293–1583 m)
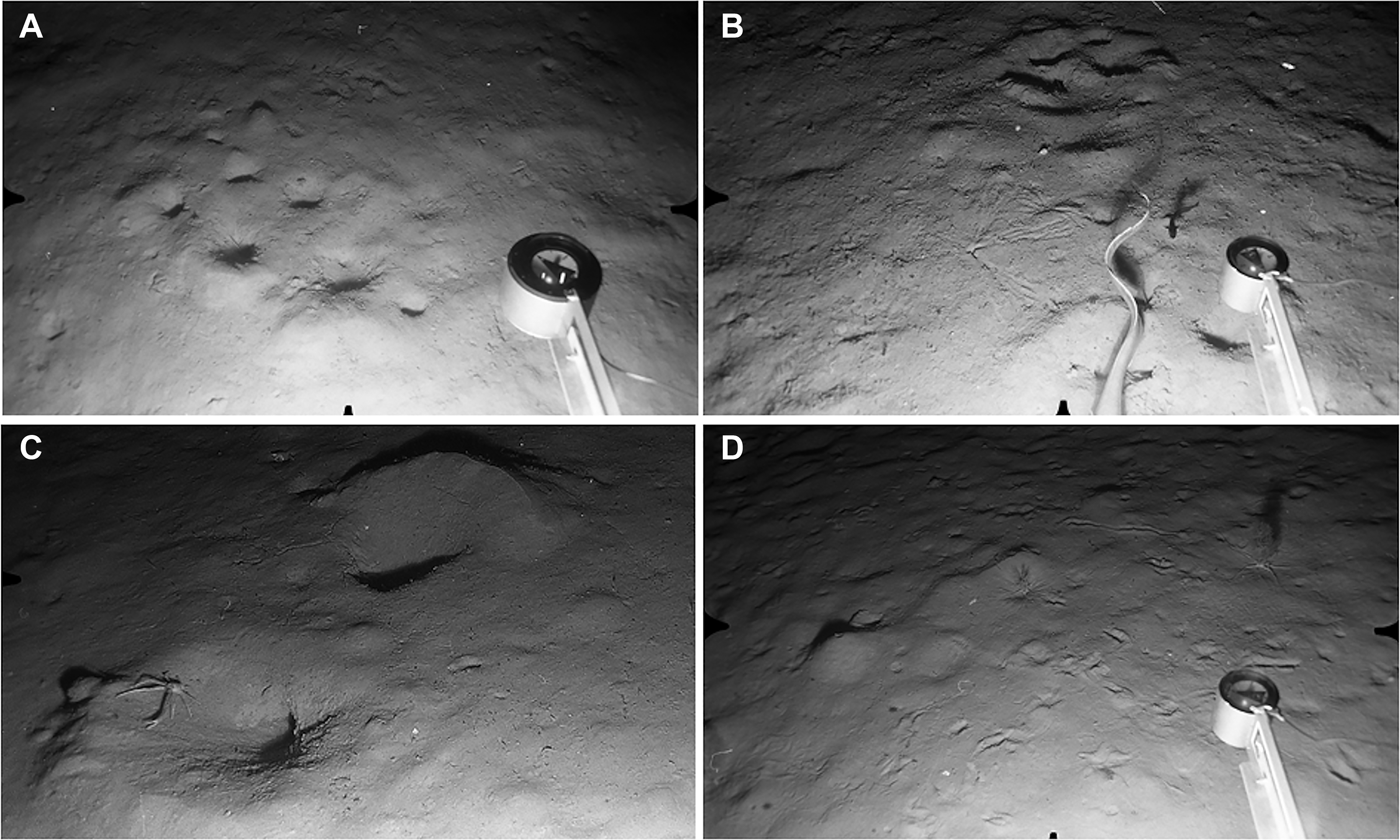
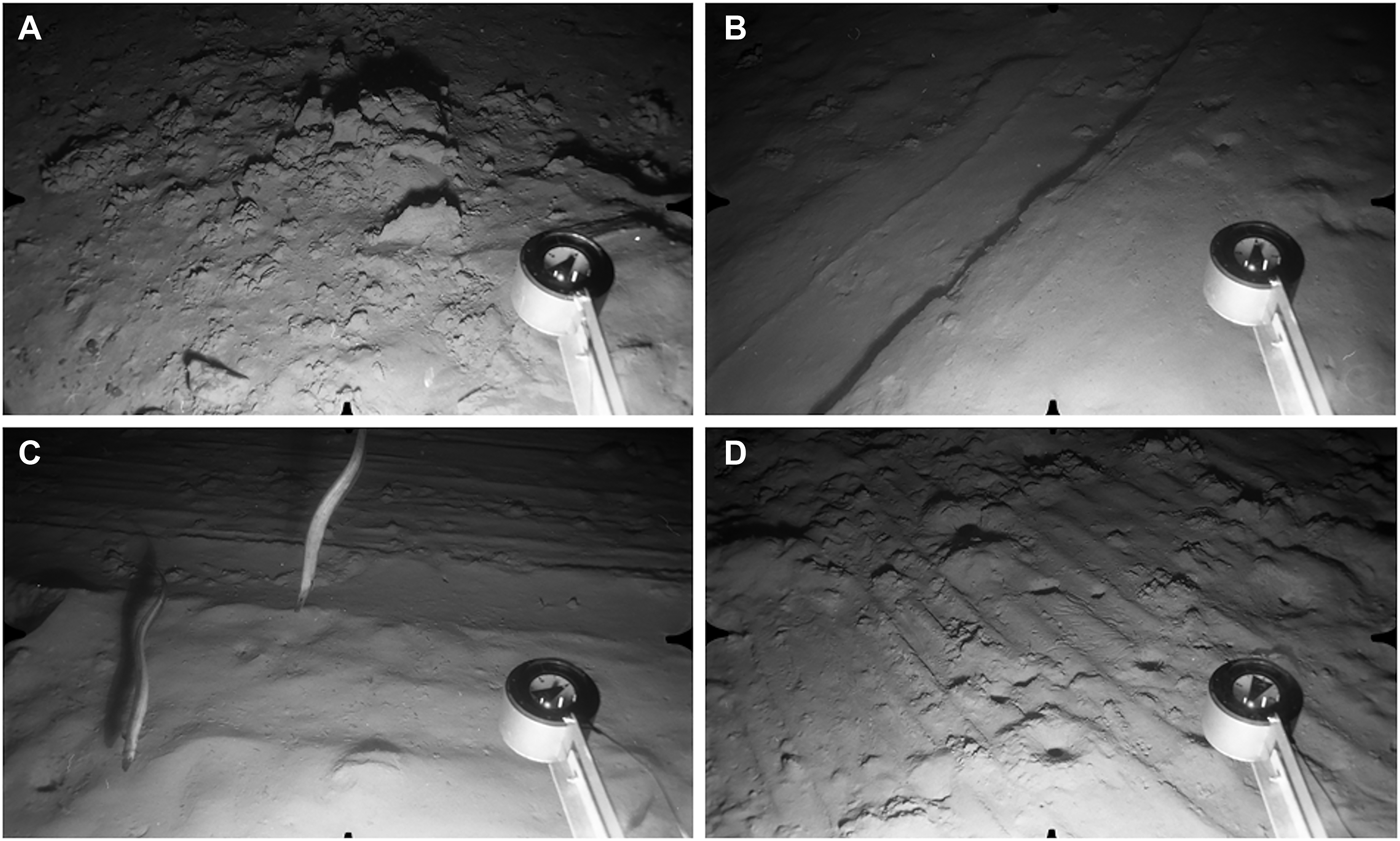
Stations S24–S28 and N16–N30 were all characterized by heavily-bioturbated fine sediments with no evidence of bottom-current activity. The same set of burrow types was identifiable in both North and South survey areas. The most conspicuous features were clusters of large holes opening at an oblique angle to the surface, usually accompanied by an elevated rim or pile of expelled sediment (Figure 9A, B). Clusters could include up to ten individual holes spread over a horizontal distance of up to 80 cm, but four or five holes over ~50 cm was more typical. These large burrows were present throughout the depth range, occurring on 33–83% of photographs per station (Table 1). They are here provisionally attributed to the squat lobster Munida tenuimana on the basis of their similarity to coastal decapod burrows (Atkinson, Reference Atkinson1974, Reference Atkinson1986), and to instances where individuals of M. tenuimana were seen in clear association with surface openings (Figure 9C). No other potential candidate burrowers were observed.
Fig. 9. Decapod Burrow and Deep Trough Zones. Distance across lower field of view (A, B, D) ~120 cm. (A) Station N30, 1492 m: large decapod burrow openings, several with rim of expelled sediment. Smaller biogenic traces also visible; (B) Station S27, 1503 m: fine sediment with more granular surface texture than in previous image. Cluster of decapod openings at upper centre, two ‘spoke burrows’ close to centre of field. Tail of large grenadier (Coryphaenoides sp.) and small dark fish, possibly Gaidropsarus macrophthalmus, to left of compass arm; (C) Station N19, 1304 m: close-up showing decapod crustacean Munida tenuimana in close association with large, oblique burrow openings and expelled sediment; (D) Station S29, 2056 m: seafloor with conspicuous epifaunal traces. Large conical mound to left of centre. Two Acanella arbuscula colonies with associated Ophiomusium lymani.
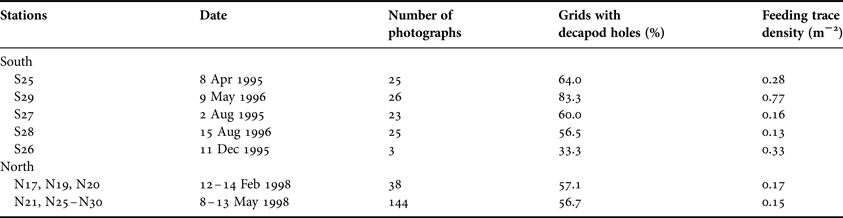
Table 1. Frequency of occurrence of surface features made by burrowing megafauna in the Decapod Burrow Zone (1293–1583 m) in relation to time of year. The two right-hand columns record observations from a 1 m2 perspective grid superimposed on each photograph, expressed as the number of grids containing decapod crustacean burrow openings, and the density m−2 of echiuran worm feeding traces.
Stellate feeding traces made by echiuran worms were the second biogenic feature characteristic of this depth zone and were observed at most stations (Figure 9B). They had the typical form of elongate proboscis marks radiating from a central small burrow opening (Ohta, Reference Ohta1984). Individual ‘spokes’ were up to 40 cm long, but were more usually 20–25 cm. A third biogenic trace observed in both survey areas consisted of 4–11 (most often six) small circular holes arranged in a straight or meandering line over a linear distance of up to 70 cm. This feature was rare, and/or difficult to distinguish on a heavily-bioturbated seafloor, and was identified on only 11 out of 281 photographs.
At Stations S24, S25 and S26 (observed in May 1996, April 1995 and December 1995, respectively) the background sediment surface was relatively smooth with limited fine-scale relief. However, S27 (August 1995) and S28 (August 1996) showed a distinctly granular surface with numerous fine, projecting filaments (Figure 9B). This textural change is consistent with a seasonal proliferation of surface-dwelling foraminiferans following the settlement of spring bloom phytodetritus (Gooday & Hughes, Reference Gooday and Hughes2002). No textural differences were apparent at the North stations photographed in February and May 1998. In the South, both decapod burrows and echiuran feeding traces were observed at higher density in May than in photographs taken in April, August and December (Table 1). However, in the North there was no observed change in burrow frequencies from February to May 1998.
Linear trails and sea star traces were visible at most stations in this depth zone, but were far less prominent than the megafaunal burrows described above. Consistent with this pattern, mobile epifauna appeared to be very sparse in both survey areas. One holothurian (Molpadiodemas villosus, S25) and one small unidentified sea star (S24) were recorded from South stations. Six specimens of the large sea star Zoroaster fulgens were observed at N27, but no other mobile invertebrates besides Munida tenuimana were seen in the North. The North stations recorded several sessile epifaunal species not seen in the South. Xenophyophores were fairly common at N17 (1.5 ± 2.4 ind. m−2), N19 (2.5 ± 3.1 ind. m−2) and N20 (1.8 ± 2.6 ind. m−2) and were also present at N16 and N18. Image quality at N16 was very poor and N18 was heavily-impacted by trawling (see below), preventing any density estimates at these stations. The North stations with xenophyophores fell in the depth range 1293–1316 m, and none were seen at greater depths (N21–N30, 1376–1492 m). Stalked hexactinellid sponges (Hyalonema sp.) occurred sporadically at six North stations between 1293 and 1453 m, either as intact organisms or as relict stalks damaged by trawling (see below). The colonial octocoral Acanella arbuscula was seen in small numbers (eight colonies total) at N17 only.
Synaphobranchus kaupii was present throughout the depth zone in both North and South (Figure 11C). The fish were seen in much smaller numbers than at stations higher up the slope, but individuals were conspicuously larger, with mean (± SD) total length of 54 ± 22 cm at ~1300 m (N = 4 individuals measured) compared with 18 ± 5 cm at 700–800 m (N = 37 individuals). The only other fish observed were rare grenadiers (Coryphaenoides rupestris and C. guentheri, Figure 9B) in both survey areas, a notacanthid eel at N30 and a possible big-eye rockling (Gaidropsarus macrophthalmus) at S27 (Figure 9B).
DEEP TROUGH ZONE (~2060 m)
This depth zone was represented only by two South stations, S29 and S30. Sediments were fine-grained with a smooth surface texture and showed no evidence of near-bed currents. As in the preceding depth zone, there was much evidence of megafaunal bioturbation but the mix of surface features may indicate a change in the burrowing community. The large decapod burrows that dominated the benthic landscape at ca 1300–1500 m appeared to be rare or absent here. Large (5–10 cm diameter) holes or deep pits, sometimes grouped, were present (on 23% of photographs from S29, 32% from S30), but most were not obviously associated with a rim or pile of expelled sediment. No decapod crustaceans were seen at S29 or S30 and the origin of these large burrow openings is unknown. Conical, volcano-shaped mounds were conspicuous at both stations (density 0.35 mounds m−2 at S29, 0.28 m−2 at S30), and were a feature not recorded at ca 1300–1500 m (Figure 9D). Echiuran worms and/or molpadiid holothurians are likely candidate mound-builders (Smith et al., Reference Smith, Jumars and DeMaster1986; Amaro et al., Reference Amaro, Bianchelli, Billett, Cunha, Pusceddu and Danovaro2010). Echiuran feeding traces were present (0.12 traces m−2 at S29, 0.16 traces m−2 at S30) and there were also many small holes and pits of indeterminate origin.
In contrast to the ~1300–1500 m depth zone, epibenthic megafauna were relatively common. The characteristic species at both stations were the large brittlestar Ophiomusium lymani (0.91 ind. m−2 at S29, 0.71 ind. m−2 at S30), the colonial octocoral Acanella arbuscula (0.30 colonies m−2 at S29, 0.20 colonies m−2 at S30) and the urchin Gracilechinus affinis (0.30 ind. m−2 at S29, 0.24 ind. m−2 at S30). Ophiomusium lymani was usually observed either in close association with an A. arbuscula colony (Figure 9D) or else in a shallow depression on the sediment surface. Sea star traces were common and conspicuous but their makers were not observed. Single specimens of a small unidentified anemone (S30) and a pennatulacean (Umbellula sp., S29) were seen. Two grenadiers, probably Coryphaenoides guentheri, were the only fish recorded.
Cluster analysis of epifaunal composition
The station dendrogram based on presence/absence of 43 epifaunal taxa (Figure 10) shows a good overall agreement with the visually-defined zonation scheme outlined above. The primary division is between Shelf Edge stations (plus Upper Slope Stations S7 and S9) and deeper stations characterized by taxa associated with finer sediments. A large cluster corresponding to the Ophiocten gracilis Zone is well-defined. Stations at ~1000 m depth also group together, although those with and without xenophyophores are not clearly distinct. Bioturbated mud stations form a cluster, with a division between the two Deep Trough localities (S29, S30) and the Decapod Burrow Zone. The only bathymetric zone not apparent in the dendrogram is the Upper Slope. The two South stations (S7, S9) in this depth range group (at a very low similarity level) with Shelf Edge stations in the same geographic area, widely separated from Central Stations C1 and C3 which are nested within the O. gracilis cluster.
Fig. 10. Dendrogram of 54 Hebridean Slope stations showing Bray–Curtis similarities based on presence/absence of 43 taxa in 15 photographic images station−1.
Anthropogenic disturbance
A beer can at Station C6 was the only item of litter observed. However, disturbance to the seafloor clearly caused by bottom-trawling was recorded in all three survey areas. In the South, trawl marks were seen at a cluster of stations around 1000 m depth, visited between April 1995 and August 1996. Faint, relict linear tracks were observed at S19 (on 1/24 photos), S21 (2/25) and S22 (5/26), with deeply-incised, presumably more recent furrows at higher frequency (9/25 photographs) at S20. In the March 1988 Central survey area, relict trawl marks were recorded at C3 (470 m, 1/18 photos) and C4 (600 m, 8/25 photographs). The highest frequency of trawl marks was seen at C9 (885 m, 14/25 photographs), including both old, eroded features and more recent well-defined furrows associated with clods of disturbed sediment (shown in Roberts et al., Reference Roberts, Harvey, Lamont, Gage and Humphery2000: figure 5).
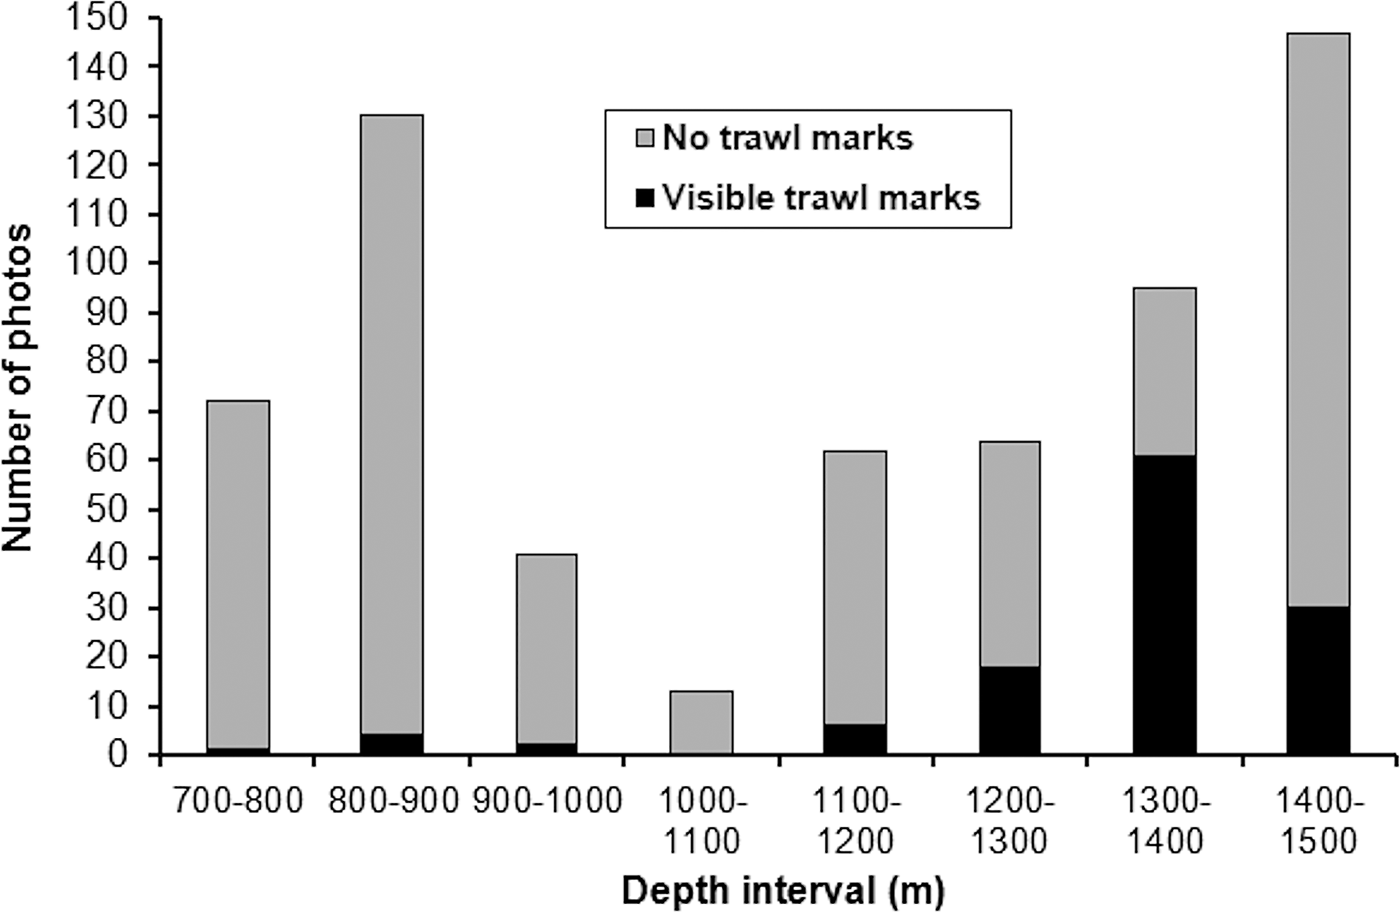
The North stations visited in February and May 1998 showed the most extensive trawl disturbance. Photographs recorded areas of seabed covered with masses of disturbed sediment (Figure 11A), or incised with broad linear furrows (Figure 11B) or multiple parallel striations (Figure 11C, D). Trawl marks were visible over the entire depth range surveyed, with peak abundance in the 1300–1400 m interval (Figure 12). At three stations surveyed in May 1998 (N22–N24, 1379–1429 m), disturbance was visible on every image, in many cases involving the complete erasure of the megafaunal burrow openings characterizing the depth zone (Figure 11B, C). Other photographs showed burrow openings punctuating areas of disturbed seabed (Figure 11D), indicating either re-opening of burrows following passage of the trawl or inward movement of burrowing fauna from nearby undisturbed areas.
Fig. 11. Evidence of bottom-trawling, North survey area. Distance across lower field of view ~120 cm. (A) Station N4, 843 m: seafloor covered with large masses of disturbed sediment; (B) Station N18, 1300 m: seafloor smoothed by passage of trawl, with a broad linear track running across the field; (C) Station N18, 1300 m: two Synaphobranchus kaupii swimming over a seafloor scored with parallel linear striations; (D) Station N24, 1429 m: trawl marks punctuated by infaunal burrows which have opened up through the disturbed seafloor.
Fig. 12. Frequency of visible trawl marks in the North survey area in 1998, from seabed photographs grouped into 100 m depth intervals.
DISCUSSION
The image archive captures the state of the sampling stations at different points during a 10 yr period. Owing to the differing objectives of the original studies, stations in each geographical area are not closely depth-matched as would be the case in a single survey design. Under these constraints, synthesis of bathymetric zonation across the three areas requires caution, particularly when defining zones by megafaunal community composition. Regional abundance comparisons using data collected in different years (Figure 7) must also be tentative in view of the evidence for temporal variability of some deep-sea megafaunal populations (Glover et al., Reference Glover, Gooday, Bailey, Billett, Chevaldonné, Colaço, Copley, Cuvelier, Desbruyères, Kalogeropoulou, Klages, Lampadariou, Lejeusne, Mestre, Paterson, Perez, Ruhl, Sarrazin, Soltwedel, Soto, Thatje, Tselepides, Van Gaever and Vanreusel2010). However, downslope trends in benthic environment are associated with large-scale patterns of substratum type and hydrodynamics which are highly persistent over time. Aspects of benthic community zonation which reflect habitat type will, therefore, persist even if the abundance of some constituent species fluctuates.
Bathymetric zonation and alongslope comparisons
Bathymetric zones based on visual assessment of substratum type and epifaunal composition were largely supported by the hierarchical cluster analysis, with the exception of the putative Upper Slope Zone which did not fall out as a distinct category. Contrasts in substratum type and associated fauna between the South and Central stations in this depth range were noted earlier and account for the wide separation of their respective stations in the dendrogram. A more detailed survey will be necessary to determine whether the Upper Slope can be identified as a distinct zone or whether it simply marks the transition (varying in depth according to locality) from a Shelf Edge characterized by heterogeneous coarse substrata, strong currents and a sparse fauna (Gage Reference Gage1986; Gage et al., Reference Gage, Lamont, Kroeger, Paterson and Gonzalez Vecino2000) to deeper fine sediments, lower-energy conditions and a richer epifauna dominated by echinoderms. A dense brittlestar population along the bathymetric contours from ~600–1000 m was noted by Lamont & Gage (Reference Lamont, Gage, Mooi and Telford1998) using photographs from the South and Central areas as defined here. The present study shows that the Ophiocten gracilis Zone extends considerably further north along the Hebridean Slope. Records spanning a 10 yr period suggest that it is a temporally persistent feature. South stations indicate a rather abrupt lower boundary for this zone at ca 1000 m depth. High local densities of cerianthid anemones were observed only at some of the South stations but their absence from Central and North areas cannot be assumed given the semi-infaunal, tube-dwelling habit of these anthozoans.
Upper Slope and Ophiocten gracilis Zone stations fall within the ambit of the Hebridean Slope Current which follows the bathymetric contours northwards below the shelf edge to depths >700 m (Booth & Ellett, Reference Booth and Ellett1983; Huthnance, Reference Huthnance1986; Howe & Humphery, Reference Howe and Humphery1995; Burrows & Thorpe, Reference Burrows and Thorpe1999). Along the LOIS-SES transect, maximum current velocities were recorded in the upper 200 m (Souza et al., Reference Souza, Simpson, Harikrishnan and Malarkey2001). Seabed photographs indicate low epibenthic biomass on the Upper Slope with a marked increase in the O. gracilis zone below ~600 m. In the Porcupine Seabight, the hexactinellid sponge Pheronema carpenteri occurs at high abundance in a narrow depth band adjacent to, but not within, the region of most energetic near-bed flow (White, Reference White2003). The sponges are intolerant of direct exposure to strong currents but are thought to benefit from an enhanced supply of resuspended food particles. A similar mechanism may operate in the O. gracilis zone, with brittlestars, cerianthids and other organisms exploiting organic material settling from nepheloid layers or advected downslope in the Ekman boundary layer (Lamont & Gage, Reference Lamont, Gage, Mooi and Telford1998; Souza et al., Reference Souza, Simpson, Harikrishnan and Malarkey2001).
Below the lower boundary of the Ophiocten gracilis Zone at ~1000 m xenophyophores were present in the South but were more common at North stations, particularly where the seabed showed evidence of bottom-current activity. They also occurred in the North at ~1300 m but were not seen at comparable depths in the South. Syringammina fragilissima is abundant on the sediment ‘tails’ of the coral-topped Darwin Mounds at ~1000 m depth just south of the Wyville Thomson Ridge (Bett, Reference Bett2001; Hughes & Gooday, Reference Hughes and Gooday2004), suggesting that high densities of these giant protists may be a regional feature of the northern end of the Rockall Trough. Additional photographic surveys will be necessary to determine whether their apparent scarcity in the Barra Fan area is genuine or an artefact of limited sampling and local patchiness.
Sediment grade on the Barra Fan shows a marked decrease between 1000 and 1500 m depth, from fine sand (median grain size 170 µm) to silt/very fine sand (12–40 µm) (Mitchell et al., Reference Mitchell, Harvey, Gage and Fallick1997). The transition is reflected in a shift from a rippled or current-smoothed seabed with conspicuous epifauna to one dominated by the activities of burrowing infauna. The occurrence of the same biogenic surface features (Lebensspuren) in both North and South survey areas indicates along-slope continuity of the habitat and community at these depths. Hartnoll et al.'s. (Reference Hartnoll, Rice and Attrill1992) suggestion that Munida tenuimana burrows in soft sediment is supported by photographic evidence presented here. The echiuran ‘spoke burrows’ common in this zone are often photographed on bathyal and abyssal seabeds, although their creators are seldom collected and little is known of their ecology (Ohta, Reference Ohta1984; Bett et al., Reference Bett, Rice and Thurston1995). The apparent restriction of sessile epifauna in this depth zone (xenophyophores, Hyalonema sp., Acanella arbuscula) to the North may be a regional difference but will require testing against a larger dataset. The available image sample showed too few mobile epifauna to allow comparison of North and South stations.
The small sample of images available from the deepest stations (~2000 m) was sufficient to show a change in community from the ~1300–1600 m depth range. The fine sediments were still heavily-bioturbated but the identity of the dominant large burrowers is unclear, a common problem in studies of deep-sea Lebensspuren (Przeslawski et al., Reference Przeslawski, Dundas, Radke and Anderson2012). Epifauna were much more frequent than in the Decapod Burrow Zone, particularly Acanella arbuscula, Ophiomusium lymani and Gracilechinus affinis. The first two species were also conspicuous in seabed photographs taken at 1920 m depth on the Feni Ridge on the western side of the Rockall Trough (Hughes & Gage, Reference Hughes and Gage2004). A change in the Rockall Trough megafaunal community below ~1800 m was noted by Gage (Reference Gage1986) from the results of trawl sampling. Gage linked this change to an apparent increase in current speed at the base of the Rockall Trough Slope (Lonsdale & Hollister, Reference Lonsdale and Hollister1979) and to the approximate depth of the 4oC isotherm marking the upper limit of abyssal fauna.
Demersal fish sightings were sporadic at all depths, the exception being the eel Synaphobranchus kaupii, which was observed frequently in all three survey areas across a broad depth range (600–1500 m). This is consistent with the abundance of S. kaupii in trawl catches from the Hebridean Slope (Gordon & Mauchline, Reference Gordon and Mauchline1996). Trawl data show an increase in mean body length at greater depths, a trend also discernible in the seabed photographs.
Biotope identification and conservation importance
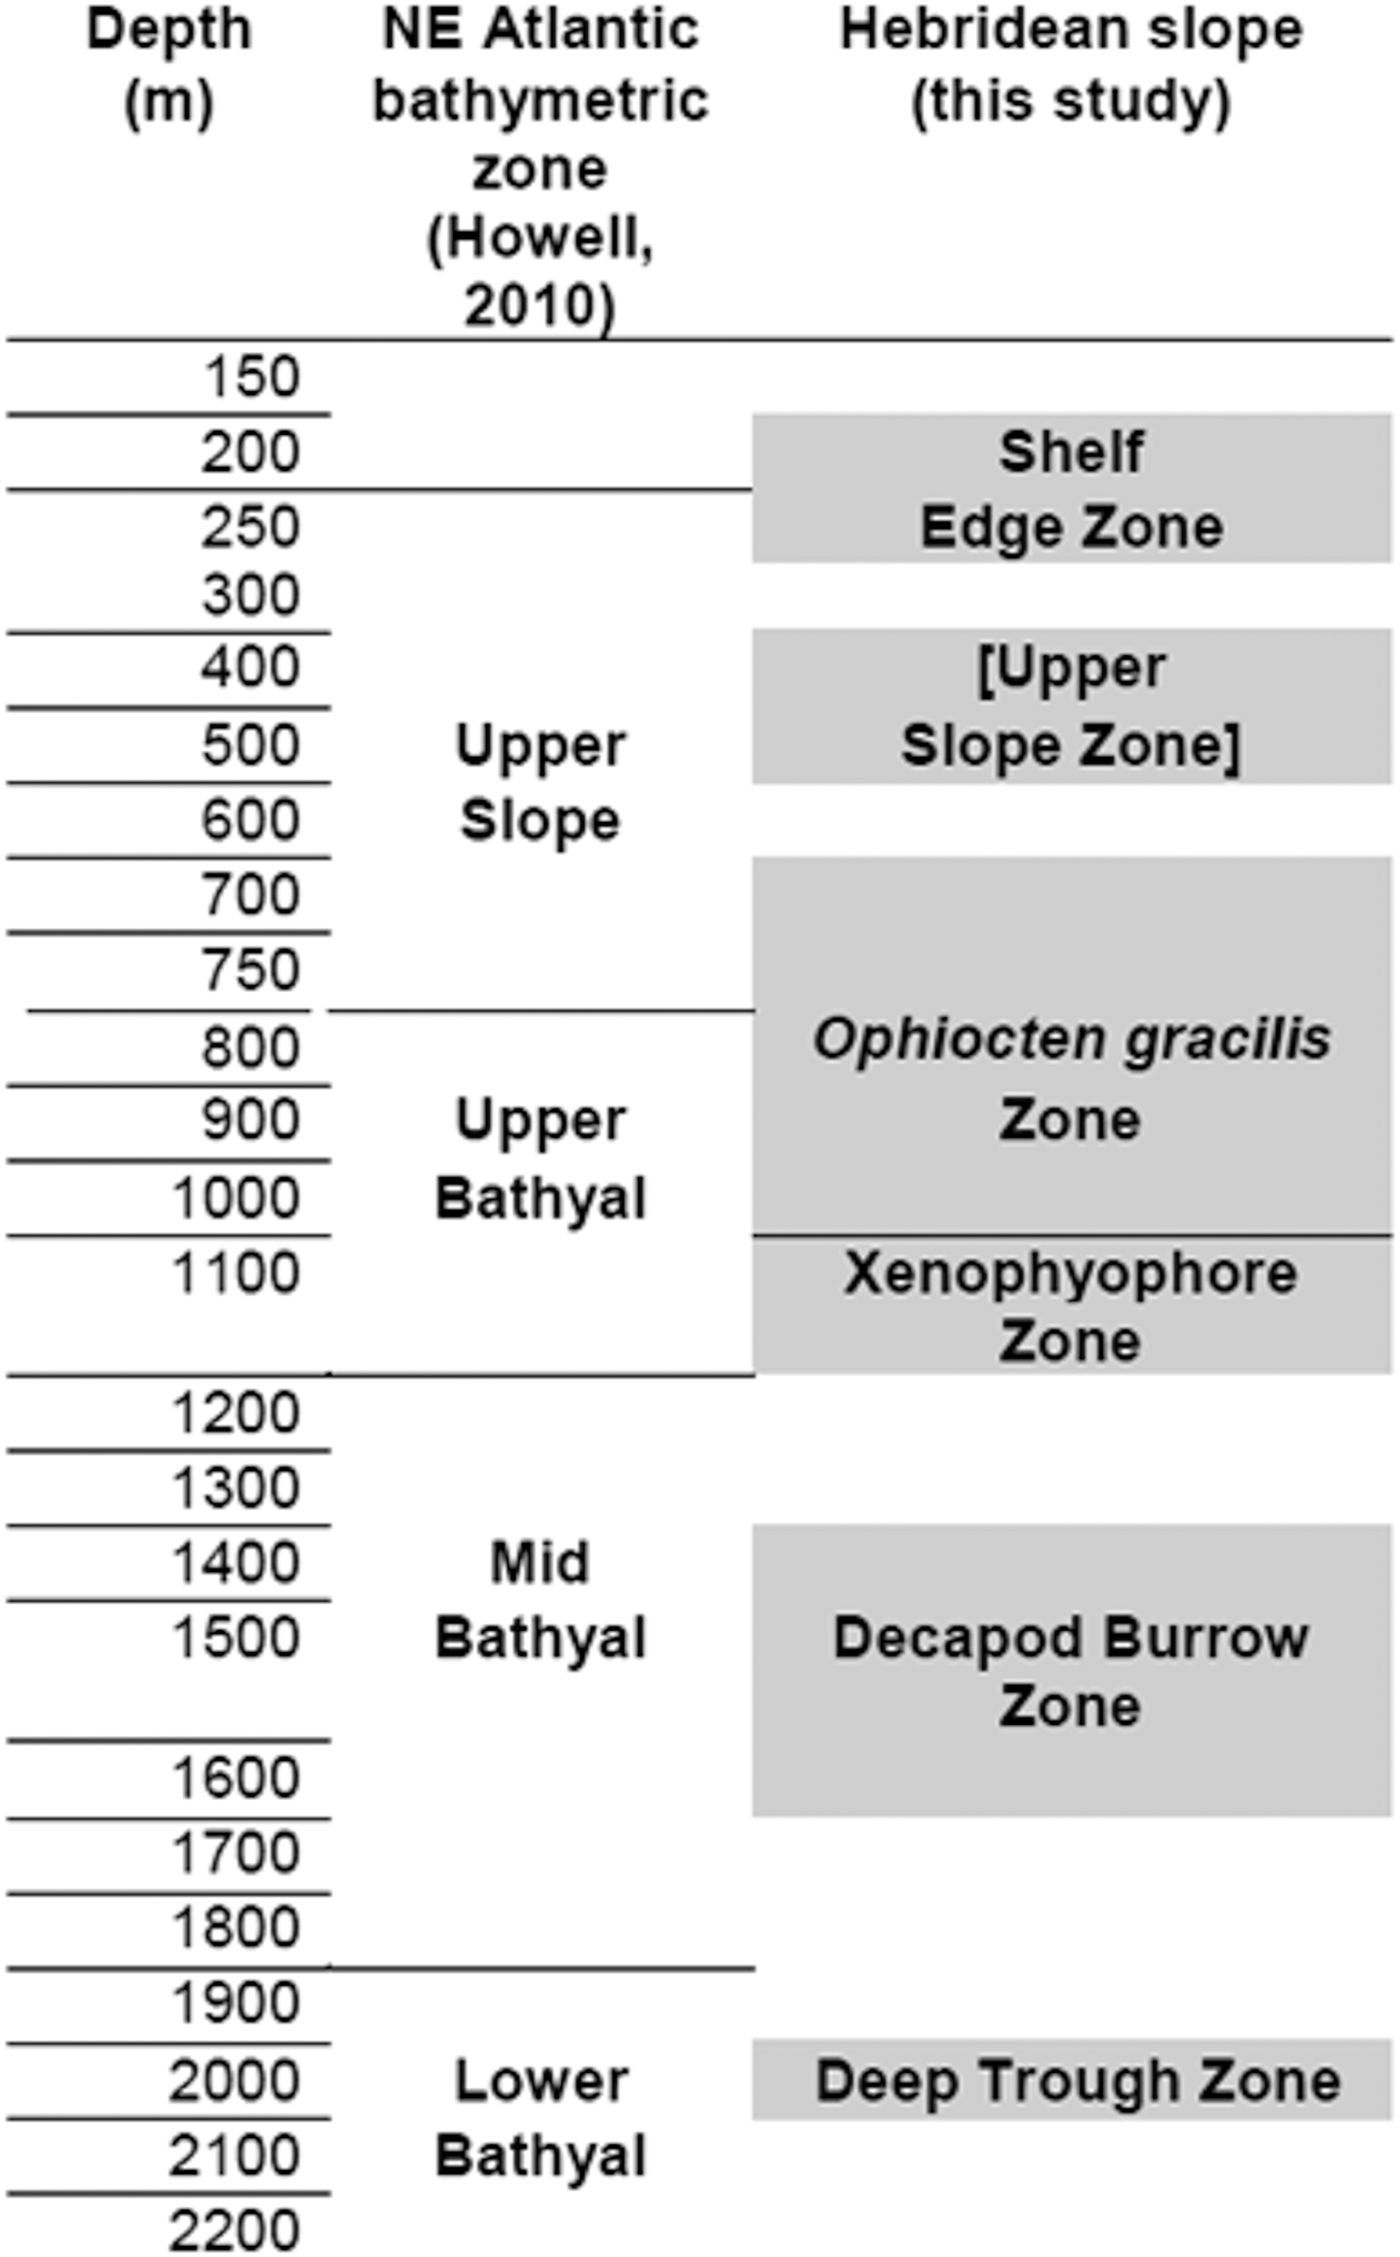
A report on progress towards identification of a network of MPAs in Scottish waters was published in 2012 (Scottish Government, 2012). Proposed deep-water MPAs include two areas of the Hebridean Slope which encompass the North and South stations described here, while the Central survey area lies just to the south of a third potential MPA. Identification and mapping of benthic habitats and communities are essential steps towards establishment of an effective MPA network (Howell et al., Reference Howell, Davies and Narayanaswamy2010; Foster et al., Reference Foster, Foggo and Howell2013; Rengstorf et al., Reference Rengstorf, Yesson, Brown and Grehan2013; Ross & Howell, Reference Ross and Howell2013). To this end, Howell (Reference Howell2010) proposed a hierarchical classification system for the deep north-east Atlantic comprising 40 biotopes based on epibenthic megafaunal assemblages identified on Rockall Trough seamounts and banks (Narayanaswamy et al., Reference Narayanaswamy, Howell, Hughes, Davies, Roberts and Black2006; Howell et al., Reference Howell, Davies, Hughes and Narayanaswamy2007), supplemented by data from the published literature. Comparing the Hebridean Slope observations with Howell's bathymetric zonation and biotope definitions allows a partial test of the utility of Howell's system. Hebridean Shelf Edge and Upper Slope images showing coarse or hard substrata show too few details of encrusting epifauna to permit assigment to any of Howell's assemblages (defined from high-resolution colour digital photographs) from corresponding depths and substrata. Hebridean Central area stations at 350–470 m can be equated with Howell's Upper Slope ‘Cidaris cidaris–Stichopus (now Parastichopus) tremulus assemblage’, sharing a sandy substratum with some gravel content and an epifauna dominated by large echinoderms. Howell's proposed Upper Slope/Upper Bathyal boundary at 750 m was not apparent on the Hebridean Slope, where the Ophiocten gracilis Zone spanned the 600–1000 m depth interval (Figure 13). Howell lists ‘Ophiuroids on rippled sediment’ from a broad depth range (205–1021 m) on Rockall Trough seamounts and banks. However, the detailed taxon list (Howell et al., Reference Howell, Davies and Narayanaswamy2010) does not specify O. gracilis and includes many sessile epifauna not seen on the Hebridean Slope photographs. The O. gracilis zone described here may be a better match to Howell's (Reference Howell2010) Upper Bathyal ‘Echinus acutus norvegicus assemblage’, a community (including O. gracilis) reported to be ‘present in a ribbon-like distribution around the continental margin of Europe down to about 1400 m’. Howell defined this biotope partly on the basis of Gage's (Reference Gage1986) trawl samples, in which small brittlestars are likely to be under-represented relative to the much larger Echinus (now Gracilechinus) acutus.
Fig. 13. Provisional habitat and community zonation on the Hebridean Slope compared with the scheme proposed for the north-east Atlantic by Howell (Reference Howell2010). Shaded blocks show the approximate depth intervals represented in the Hebridean Slope image archive, with the designated zones representing a synthesis of observations from all three survey areas. The label for the Hebridean Upper Slope Zone is shown in square brackets as cluster analysis did not recover this zone as a discrete category.
The North Hebridean Slope Xenophyophore Zone matches Howell's (Reference Howell2010) ‘Xenophyophore fields’ biotope at ~1000 m depth. Observations reported here also support Howell's proposed distinction between Mid- and Lower Bathyal fine sediments (Figure 13), although they cannot confirm the zonal boundary depth. The Hebridean Slope Decapod Burrow Zone may correspond to Howell's ‘Echinus alexandri–Psilaster–Plinthaster assemblage’ although these defining taxa were not observed on the seabed images. The Deep Trough community is a clear example of Howell's ‘Acanella arbuscula and Ophiomusium lymani assemblage’.
Given the limited number of identifiable taxa on the Hebridean Slope photographs, the correspondence with Howell's (Reference Howell2010) proposed biotopes is reasonably good. However, the apparent zonation on the Hebridean Slope differs somewhat from Howell's system at depths above ~1100 m, leaving open the question of whether a single pattern can be applied to the Rockall Trough continental margin and the offshore seamounts and banks.
Protection of cold-water coral reefs (Roberts et al., Reference Roberts, Wheeler and Freiwald2006), sponge aggregations (OSPAR Commission, 2010) and other fragile biogenic habitats has been one of the main drivers of the process to establish offshore MPAs in the north-east Atlantic (Davies et al., Reference Davies, Roberts and Hall-Spencer2007; Rengstorf et al., Reference Rengstorf, Yesson, Brown and Grehan2013). Locally rich communities of corals and other sessile suspension-feeders occur on several of the Rockall Trough banks and seamounts (Narayanaswamy et al., Reference Narayanaswamy, Howell, Hughes, Davies, Roberts and Black2006, Reference Narayanaswamy, Hughes, Howell, Davies and Jacobs2013; Howell et al., Reference Howell, Davies, Hughes and Narayanaswamy2007; Roberts et al., Reference Roberts, Henry, Long and Hartley2008; Stewart et al., Reference Stewart, Davies, Long, Strömberg and Hitchen2009), but none were seen at any of the Hebridean Slope stations. Gage (Reference Gage1986) noted that corals and other sessile megafauna were more common in trawl samples from western Rockall Trough localities than at stations to the east and related this to higher bottom-water turbidity and better conditions for suspension-feeding created by the Wyville Thomson Ridge overflow (Johnson et al., Reference Johnson, Sherwin, Smythe-Wright, Shimmield and Turrell2010). As potential MPAs, the three Hebridean Slope areas do not appear on present evidence to be important sites for cold-water corals or sponge aggregations. However the need for site-based protection to include habitats such as burrowed muds and xenophyophore fields is now also recognized (SNH & JNCC, 2012; Ross & Howell, Reference Ross and Howell2013), and both are well-represented in the areas described here.
Extent of bottom-trawling
Bottom-trawling along continental margins can severely deplete populations of both target and non-target fish species (Bailey et al., Reference Bailey, Collins, Gordon, Zuur and Priede2009), with collateral impacts on the wider benthic ecosystem (Gage et al., Reference Gage, Roberts, Hartley and Humphery2005) and even on the geomorphology of the seafloor (Puig et al., Reference Puig, Canals, Company, Martin, Amblas, Lastras, Palanques and Calafat2012). In the deep north-east Atlantic, the spatial ‘footprint’ of bottom-trawling is at least an order of magnitude greater than the total extent of all other human activities on the seafloor (Benn et al., Reference Benn, Weaver, Billett, van den Hove, Murdock, Doneghan and Le Bas2010). Deep-water trawling in the Rockall Trough area began as early as the 1970s, with a major expansion of the commercial fishery from 1989 onwards (Gordon, Reference Gordon2003). It is, therefore, important to assess (and, if possible, quantify) the extent of trawl disturbance in potential Hebridean Slope MPAs. The observations reported here extend the analysis of Roberts et al. (Reference Roberts, Harvey, Lamont, Gage and Humphery2000), which used a subset of the North stations (those visited in February 1998) together with images from the 1988 Central stations. The Hebridean Slope was clearly subject to local trawling impacts at least as far back as 1988. Visible trawl disturbance seems to have been light on the Barra Fan in 1995–1996 but more intense at the North stations in 1998, particularly below 1100 m depth. As ‘snapshots’ of the times and places surveyed, 15–25 yr before the present, these data cannot show the cumulative total intensity of trawling in each area. Nevertheless, they demonstrate that none can be regarded as pristine continental slope environments.
ACKNOWLEDGEMENTS
At sea the camera system was maintained and operated by Richard Holmes (British Geological Survey), John Humphery (Proudman Oceanographic Laboratory), Murray Roberts, Martyn Harvey and Jane Foster (all of the Scottish Association for Marine Science). I am also grateful to Steve Gontarek (SAMS) for help with scanning of negatives and to Oliver Crawford-Avis (JNCC) and two referees for their comments on the original manuscript. I thank Dr Bhavani Narayanaswamy (SAMS) for useful discussions at all stages of this work.
FINANCIAL SUPPORT
The original cruises were funded by the Natural Environment Research Council (1988 and 1995–96), Enterprise Oil plc (February 1998) and Statoil UK (May 1998). Analysis of the photographic archive was made possible by financial support from the Joint Nature Conservation Committee (contract number C10-0199-0383).
Supplementary materials and methods
The supplementary material referred to in this article can be found online at journals.cambridge.org/mbi.