


INTRODUCTION
Trenches present one of the last frontiers of deep-sea exploration (Rex & Etter, Reference Rex and Etter2010). A trench is a narrow, elongated depression of the deep-sea floor associated with a subduction zone (Jackson, Reference Jackson1997). The world's trenches are distributed from boreal to subtropical regions, with a combined length of 40,000 km; therefore, information from trenches is necessary to fully understand marine biodiversity, spatial patterns of community structures, and the processes that regulate them.
Trenches are seafloor features that are isolated from each other (Angel, Reference Angel1982), the upper boundary of which typically begins at a water depth of 6000 m. There is a paucity of information about meiofaunal abundances or compositions at higher taxonomic levels (e.g. George & Higgins, Reference George and Higgins1979; Tietjen et al., Reference Tietjen, Deming, Rowe, Macko and Wilke1989; Shirayama & Kojima, Reference Shirayama and Kojima1994; Richardson et al., Reference Richardson, Briggs, Bowles and Tietjen1995; Danovaro et al., Reference Danovaro, Gambi and Della Croce2002; Tselepides & Lampadariou, Reference Tselepides and Lampadariou2004; Itoh et al., Reference Itoh, Kawamura, Kitahashi, Kojima, Katagiri and Shimanaga2011). However, although meiofauna exceed megafauna and macrofauna in density and biomass in the deep-sea (e.g. Rex et al., Reference Rex, Etter, Morris, Crouse, McClain, Johnson, Stuart, Deming, Thies and Avery2006) and play an important role in the deep-sea ecosystem, there have been few previous studies of meiofaunal assemblages from trenches.
Todo et al. (Reference Todo, Kitazato, Hashimoto and Gooday2005) investigated the Challenger Deep and found that organic-walled foraminifera, which are rare in most deep-sea environments, dominated the assemblage of meiofaunal foraminifera. Low affinities between trench stations and adjacent slope stations have been reported for nematodes (Tietjen, Reference Tietjen1989; Gambi et al., Reference Gambi, Vanreusel and Danovaro2003; Vanhove et al., Reference Vanhove, Vermeeren and Vanreusel2004). These studies, however, could not address whether trench communities are different from those in other environments, because they did not compare the trench stations with abyssal plain stations. Furthermore, a comparison between more than one trench regions has not been conducted to date.
Harpacticoids (Crustacea: Copepoda) are usually the second most abundant meiobenthic taxon in marine samples after nematodes (Giere, Reference Giere2009). Jumars & Hessler (Reference Jumars and Hessler1976) reported that the diversity of harpacticoids in the Aleutian Trench was lower than that in the central North Pacific. However, the structure of assemblage was not mentioned.
The present study, in which the specific features of trench assemblages are examined, is the first step in investigating spatial changes in the assemblages of harpacticoids around trenches. We describe the harpacticoid assemblages at the family level in two trench regions around Japan: the Ryukyu Trench, which underlies an oligotrophic subtropical ocean, and the Kuril Trench, which is located below a highly productive boreal region (cf. Berger, Reference Berger, Berger, Smetacek and Wefer1989; NASA SeaWiFS Project: http://oceancolor.gsfc.nasa.gov/SeaWiFS/). In addition, we investigated the relationship between harpacticoid assemblages and environmental factors. Sajan et al. (Reference Sajan, Joydas and Damodaran2010) showed that the assemblage structure of nematodes at the family level had a similar pattern to that at the species level, and that analysis at the family level is sufficient to explain the depth gradient in the western Indian continental shelf. Although this consistency should not be assumed to exist in other regions (Narayanaswamy et al., Reference Narayanaswamy, Bett and Hughes2010), information at the family level is still useful for the analysis of assemblage structures. In the present study, we particularly focused on the following three questions associated with harpacticoid assemblages:
(1) Are trench assemblages different from those on the surrounding trench slope and abyssal plain? If the trench assemblage is different, the average dissimilarities between the adjacent slope and the trench and between the trench and the abyssal plain should be higher than that between the slope and the abyssal plain.
(2) Do the same factors influence the distribution pattern of the harpacticoid families in these two trench regions?
(3) Are the assemblages on the two different trenches isolated from each other? If trench assemblages are isolated from each other, the dissimilarity between trench stations should be much higher than that between the slopes and the abyssal plains.
MATERIALS AND METHODS
Sampling and sample processing
Meiofauna samples were collected from regions around the Kuril Trench (hereafter the Kuril region) and the Ryukyu Trench (hereafter the Ryukyu region) during two cruises of the research vessel ‘Hakuho Maru’, KH-01-2 in 2001 and KH-05-1 in 2005. We used a multiple corer (Barnett et al., Reference Barnett, Watson and Connelly1984), which can simultaneously collect up to eight sediment cores of 52.8 cm2. Sampling stations were located along transects from the continental margins to the abyssal plains, traversing both trenches (Figure 1). We classified sampling stations into three topographic categories: trench (depth >6000 m); trench slope (adjacent slope landward from the trench); and abyssal plain (flat topography seaward from the trench). Sampling locations, depths and topographic categories of stations are listed in Table 1. One multiple corer deployment was conducted at each station, and three cores per deployment were used for meiofaunal analysis, because of limited ship time and demand for cores.
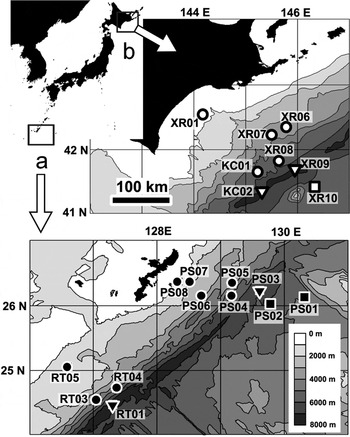
Fig. 1. Location of sampling stations (a) around the Ryukyu Trench (the Ryukyu region) and (b) around the Kuril Trench (the Kuril region), Japan. Solid and open points indicate the Ryukyu and Kuril region stations, respectively. Circles, triangles, and squares indicate trench slope, trench, and abyssal plain stations, respectively. Labels near to these symbols are the codes of the sampling stations listed in Table 1.
Table 1. Locations and topographic categories of the sampling stations.

Shipboard, core samples were sliced horizontally into 0–1, 1–3 and 3–5 cm layers. The samples were fixed and preserved individually in 5% buffered seawater–formalin and stained with Rose Bengal (final concentration 0.05 g/l) within several hours. Only the 0–1 cm layer was analysed in the present study because most harpacticoids were distributed in this layer (Itoh et al., Reference Itoh, Kawamura, Kitahashi, Kojima, Katagiri and Shimanaga2011).
In the Ryukyu region, the entire sediment samples from each core were used for meiofaunal analysis. In the Kuril region, the sediment samples were quantitatively divided due to the high abundances of adult harpacticoids in this region (Table 2). First, a 9.0 cm2 subcore was obtained for meiofaunal analysis. In Stations KC01, XR01, XR06, XR07, XR09 and XR10 (Figure 1), the harpacticoid abundances were low. Therefore, a quarter of the residual sediments around the subcores divided with a sediment divider were also used at these stations.
Table 2. Environmental variables, densities of adult harpacticoids, and the number of obtained specimens and families at each station. MD and SC values are cited from Itoh et al. (Reference Itoh, Kawamura, Kitahashi, Kojima, Katagiri and Shimanaga2011). CPE, chloroplastic pigment equivalents; MD, median diameter; SC, sorting coefficient of sediment grain size.

In the laboratory, samples were serially sieved onto 0.5, 0.25, 0.125 and 0.063 mm mesh nets. The retained harpacticoid specimens were transferred to flat-bottomed Petri dishes and examined to determine their developmental stages under a binocular stereoscopic microscope.
According to Huys et al. (Reference Huys, Gee, Moore and Hamond1996), Boxshall & Halsey (Reference Boxshall and Halsey2004) and Wells (Reference Wells2007), adult specimens were identified to the family level under a differential interference contrast microscope. Very few adult harpacticoids passed through the 0.063 mm mesh (0–6.3%), and damaged adults were omitted from the analysis due to identification problems. Harpacticoid density and family composition at each station were corrected with considering the differences in a fraction of the sediments and calculated based on the total number of adult harpacticoids from three cores.
Food supply (Soltwedel, Reference Soltwedel2000; Baguley et al., Reference Baguley, Montagna, Lee, Hyde and Rowe2006) and grain size (Montagna, Reference Montagna1982) have been suggested to affect the distribution patterns of meiofauna in the deep sea. Therefore, we examined chloroplastic pigment equivalents (CPE) as an indicator of the amount of organic matter supplied to the sea floor and the median diameter (MD) and sorting coefficient (SC) of sediments as parameters for grain size-distribution. The SC indicates the spread of the grain size, with small SC indicating ‘well-sorted’ homogeneous sediment (Giere, Reference Giere2009). These data are summarized in Table 2. The CPE samples were treated in the laboratory according to the method of Greiser & Faubel (Reference Greiser, Faubel, Higgins and Thiel1988). The total amount of CPE in the top 0–1 cm layer of the sediment was measured for each core, and the mean value of three cores was regarded as the representative value for each station. MD and SC data were cited from Itoh et al. (Reference Itoh, Kawamura, Kitahashi, Kojima, Katagiri and Shimanaga2011). A small amount of sediment (<1 ml for the Kuril and Ryukyu samples) was taken from the top sediment layer of one core per station to determine the MD and SC. The sediments were dispersed into boiled water in a glass beaker and left for 24 hours. Trench sediments were further dispersed using an ultrasonic vibrator for 30–60 seconds immediately before measurement with a laser diffraction particle analyser (CIRAS Co. Ltd. 1064).
Statistical analyses
We used the following four multivariate analyses to decipher harpacticoid assemblages in the Ryukyu and Kuril regions: non-metric multi-dimensional scaling (nMDS), analysis of similarity (ANOSIM), similarity percentages (SIMPER) and BIO-ENV analyses. Prior to all analyses, abundance data were log10(x + 1) transformed to reduce the contribution of abundant families and to focus on the whole assemblage pattern (Clarke & Warwick, Reference Clarke and Warwick2001). In this study, the numbers of observed individuals varied from station to station (Table 2). Therefore, similarity or dissimilarity indices that were not influenced by different sample sizes were selected for the multivariate analyses. We adopted the Morisita–Horn dissimilarity index (Horn, Reference Horn1966) because the use of this index has been recommended in such situations (Wolda, Reference Wolda1981). The nMDS is a method to visualize similarities in the assemblage structures across different stations. The nMDS attempts to plot the stations so that the rank order of distances between stations on the plot exactly agrees with the rank order of the matching dissimilarities (Clarke & Warwick, Reference Clarke and Warwick2001). The ANOSIM is used to examine the statistical significance of differences in assemblage structures between different topographic categories within the same region or between different regions. First, the R statistic was computed based on the rank similarity matrix of the samples. Second, R was recalculated a large number of times under random permutations of the stations. Finally, the observed value of R was compared to its permutation distribution (Clarke & Warwick, Reference Clarke and Warwick2001). The SIMPER analysis is used to determine the average of dissimilarities between different topographic categories and between different regions. In this analysis, dissimilarities were computed between every pair of stations in two different categories, and then their average was calculated (cf. Clarke & Warwick, Reference Clarke and Warwick2001). When comparing the two different regions, we omitted Station XR01, which was the shallowest station in this study in order to compare the two regions based on the stations from the same depth-range. The BIO-ENV analysis is used to detect environmental factors that have the highest correlation with the changing pattern in an assemblage (Clarke & Warwick, Reference Clarke and Warwick2001). This analysis can compare the rank dissimilarity matrices from biotic data against those from abiotic data (Clarke & Warwick, Reference Clarke and Warwick2001). The Spearman coefficient (ρ s) can evaluate the extent to which two matrices match (cf. Clarke & Warwick, Reference Clarke and Warwick2001). The combination yielding the highest ρ s was considered as the factor, or group of factors, that best explained the changing patterns in harpacticoid assemblages. The dissimilarity ranks are not mutually independent variables because they are based on a large number of strongly interdependent dissimilarity calculations. It is invalid, therefore, to statistically assess whether the obtained Spearman coefficient (ρ s) is significant (cf. Clarke & Warwick, Reference Clarke and Warwick2001). Therefore, we only evaluated the extent to which the two patterns match in the present study. For biotic data, the Morisita–Horn dissimilarity index was used, while for abiotic data, environmental variables were normalized, and the Euclidean distance was calculated in this analysis (cf. Clarke & Warwick, Reference Clarke and Warwick2001). Environmental variables included water depth, CPE, MD and SC; stations for which MD and SC values were not obtained were excluded from this analysis. All multivariate analyses were performed with R (R Development Core Team, 2008), using the package vegan (Oksanen et al., Reference Oksanen, Kindt, Legendre, O'Hara, Simpson, Solymos, Stevens and Wagner2008).
Nematode data sets
To date, information about harpacticoid assemblages around trenches remains scarce. In contrast, the assemblage structures of nematodes around the Puerto Rico and Atacama Trenches have been reported by Tietjen (Reference Tietjen1989) and Gambi et al. (Reference Gambi, Vanreusel and Danovaro2003). Therefore, we compared the nematode family data from the Ryukyu and Kuril regions with the data from these existing studies. These data were treated using the same methods that were used for harpacticoid copepods and were analysed using the SIMPER analysis to obtain the average dissimilarity values between the trench and adjacent slope stations.
RESULTS
The density of adult harpacticoids, the number of specimens obtained and the number of observed families at each station are shown in Table 2. In total, 246 adult harpacticoids were identified in the Ryukyu region and 283 in the Kuril region (Table 3). Fourteen of twenty families were found in both regions, with four of the families that ranked in the top six abundant families being common between the two regions (Table 4). In the Ryukyu region, eighteen families were encountered, and Ectinosomatidae (15.8%), Pseudotachidiidae (15.1%), Zosimeidae (14.2%), Ameiridae (12.5%), Argestidae (12.1%) and Neobradyidae (9.3%) were dominant. In the Kuril region, sixteen families were encountered, and the most abundant families were Ectinosomatidae (23.9%), Ameiridae (17.3%), Pseudotachidiidae (14.3%), Idyanthidae (13.3%), Argestidae (9.8%) and Cletodidae (6.1%).
Table 3. The number of individuals of each family in the investigated sediments (see Materials and Methods) in the Ryukyu and Kuril regions.

Table 4. List of harpacticoid families collected in the Ryukyu and Kuril regions. Classification after Wells (Reference Wells2007).

Comparison within the same regions
The observed families and their relative abundances in the topographic categories of each region are shown in Tables 5 and 6. Most of the families that appeared in one category were also found in other categories in both regions. The result of the nMDS based on the combined data from the Ryukyu and Kuril regions is shown in Figure 2. In the Ryukyu region, the stations in the same categories were not close to each other (Figure 2, solid plots), and no significant differences were detected among the different topographic categories (ANOSIM, R = 0.17, P > 0.05). In contrast, in the Kuril region, the stations in the same categories tended to be plotted near each other (Figure 2, open plots), with a significant difference being detected across the different topographic categories (ANOSIM, R = 0.76, P < 0.01).

Fig. 2. The non-metric multidimensional scaling ordination based on combined data from the Ryukyu (solid plots) and Kuril regions (open plots). Circles, triangles, and squares indicate trench slope, trench, and abyssal plain stations, respectively. Labels near these symbols denote the code of the sampling stations (see Figure 1).
Table 5. List of harpacticoid families collected at each topographic category in the Ryukyu region. Classification after Wells (Reference Wells2007).

Table 6. List of harpacticoid families collected at each topographic category in the Kuril region. Classification after Wells (Reference Wells2007).

SIMPER analyses showed that all dissimilarity values in harpacticoid assemblages across the different topographic categories were equally high (38.4–44.2%) in the Ryukyu region (Figure 3a). In contrast, in the Kuril region, the dissimilarity values between the trench slope and the trench (31.2%) and between the trench and the abyssal plain (28.3%) were lower than those between the slope and the abyssal plain (40.4%; Figure 3b). In contrast, for the nematode assemblages in the Puerto Rico and Atacama Trenches, the average dissimilarity values at the family level between the slope and trench stations were 28.2% and 25.4%, respectively.
According to the BIO-ENV analysis, the biotic and abiotic data in the Ryukyu region matched at the highest level (ρ s =–0.28) when considering only the CPE. In contrast, the MD and SC showed the highest match against biotic data in the Kuril region (ρ s = 0.76).
Comparison between the different regions
A tendency for separation between the two regions was observed, except for Station PS01 (Figure 2). However, no significant differences were noted between the two regions (ANOSIM, R = 0.04, P > 0.05) or across the topographic categories (ANOSIM, R = 0.18, P > 0.05). Assemblages were also compared between the same topographic categories in the two regions using SIMPER analysis (Figure 4). The average dissimilarity value between the Ryukyu and Kuril regions was 36.1%. Specifically, the average dissimilarity values between the different slopes, between the different trenches and between the different abyssal plains were 32.9%, 47.5% and 46.1%, respectively.
Global-scale comparison
To investigate spatial changes in assemblages at the family level on a global scale, we conducted a similarity analysis using the available data of harpacticoids from deep-sea sediments (water depth >1000 m) around the world and visualized the results using nMDS. Specifically, these data were obtained from the DEA site (south-east Pacific Ocean; Ahnert & Schriever, Reference Ahnert and Schriever2001), the Great Meteor Seamount (east Atlantic Ocean; George & Schminke, Reference George and Schminke2002), the Patagonian continental slope (Antarctic Ocean; George, Reference George2005), the Angola Basin (South Atlantic Ocean; Rose et al., Reference Rose, Seifried, Willen, George, Veit-Köhler, Bröhldick, Drewes, Moura, Martínez Arbizu and Schminke2005), the Northern Gulf of Mexico deep-sea (Baguley et al., Reference Baguley, Montagna, Lee, Hyde and Rowe2006) and the Porcupine Seabight (north-east Atlantic Ocean; Gheerardyn et al., Reference Gheerardyn, De Troch, Vincx and Vanreusel2010). In the present study, the data from the Ryukyu and Kuril regions were combined, and all the data were recalculated to provide the relative abundance; the Morisita–Horn index was used as a dissimilarity index. These studies used different systematic schemes; therefore family assignment was adjusted to that of Boxshall & Halsey (Reference Boxshall and Halsey2004). The relative abundance of abundant families is shown in Table 7. Most of the abundant families were common among sites, despite differences in relative abundances. The result of the nMDS based on these data is shown in Figure 5. Similarity levels of >85% were observed between two stations in the Angola Basin (Rose et al., Reference Rose, Seifried, Willen, George, Veit-Köhler, Bröhldick, Drewes, Moura, Martínez Arbizu and Schminke2005) and among three regions in the Pacific Ocean, namely, the Ryukyu region, the Kuril region (this study) and the DEA site (Ahnert & Schriever, Reference Ahnert and Schriever2001). All sites clustered at a similarity level of 55%.
Table 7. Abundant families of harpacticoid copepods at deep-sea sites around the world. Classification after Boxshall & Halsey (Reference Boxshall and Halsey2004).

DISCUSSION
Harpacticoid assemblages in trenches: are trench assemblages different from those on the surrounding trench slope and abyssal plain?
Previous studies of meiofaunal assemblages, especially harpacticoids, from trenches remain limited. In the case of nematode assemblages, low percentages of similarity at the genus and species levels have been reported in comparative analyses of the trench and the adjacent slope stations in the Puerto Rico Trench (Tietjen, Reference Tietjen1989), Atacama Trench (Gambi et al., Reference Gambi, Vanreusel and Danovaro2003) and South Sandwich Trench (Vanhove et al., Reference Vanhove, Vermeeren and Vanreusel2004).
In the present study, the average dissimilarity in harpacticoid assemblages at the family level between the trench stations and the slope stations was 40.6% in the Ryukyu region and 31.2% in the Kuril region (Figure 3). For nematodes, the average dissimilarity at the family level was 28.2% in the Puerto Rico Trench and 25.4% in the Atacama Trench. Although we should consider the difference in taxa, these data could suggest that there is much more divergence in the assemblages of the Ryukyu Trench and its slope than that reported for nematode assemblages in the Puerto Rico and Atacama Trenches. In contrast, the dissimilarity of harpacticoid assemblages in the Kuril Trench and its slope were comparable with that of the nematodes from the Puerto Rico and Atacama Trenches. The abundant families in each topographic category, however, were quite similar in the Ryukyu and Kuril regions (Tables 5 & 6). Consequently, the differences in harpacticoid assemblages between these trenches and their adjacent slopes were primarily due to the relative abundances of families in the two regions. This finding is consistent with the results obtained from studying the nematode assemblage in the Puerto Rico Trench (Tietjen, Reference Tietjen1989) but contrasts with the results obtained from the analysis of nematodes in the Atacama Trench, where a different composition of families was observed (Gambi et al., Reference Gambi, Vanreusel and Danovaro2003).

Fig. 3. Average dissimilarities between the trench slope, trench, and abyssal plain stations in (A) the Ryukyu region and (B) Kuril region.
For a better understanding of the specific features of trench assemblages, comparisons were made not only with their adjacent slopes, but also with adjacent abyssal plains. This study presents the first systematic analysis of samples ranging from continental margins to abyssal plains, crossing trenches in two trench regions. In the Ryukyu region, the average dissimilarity values between the three topographic categories were all high (Figure 3A), suggesting that at the family level, the assemblage of the trench is equally different from that of the slope and abyssal plain. In contrast, in the Kuril region, the dissimilarity values between the slope and the trench and between the trench and the abyssal plain were lower than that between the slope and the abyssal plain (Figure 3B). This finding leads to the hypothesis that the hadal assemblage is a transition zone between the slope and the abyssal plain in this region. However, the differences in the relative abundances of families in the two habitats would affect the differences in harpacticoid assemblages between the trench and the abyssal plain for both regions, like between the trench and the trench slope. This corresponds with a previous study on large benthic fauna, which showed that hadal fauna are characterized by a relative abundance that is different to the neighboring abyssal zone (Wolff, Reference Wolff1970).
In the present study, we confirmed that differences in the harpacticoid assemblages among the trench slope, trench and abyssal plain were significant in the Kuril region but not the Ryukyu region. This led us to question why a significant difference arises in the assemblage structures between different topographic categories only in the Kuril region. One possible explanation is that the distances among sampling stations influenced the results, but we cannot exclude that also the geological history of each trench may have affected the results.
Slight differences in assemblage structures are expected to occur when comparing different stations within the same topographic setting (Danovaro et al., Reference Danovaro, Bianchelli, Gambi, Mea and Zeppilli2009). In this study, stations of the same topography were located farther away from each other in the Ryukyu region than in the Kuril region (Figure 1). This may have resulted in the appearance of larger differences in assemblage structures between stations of the same topography in the Ryukyu region, thus masking differences between topographies. In contrast, the significant difference recorded in the Kuril region may have appeared as a result of stations with the same topography being located closer to each other (Figure 1), leading to smaller differences between stations of the same topographic settings. Alternatively, according to Hall (Reference Hall2002), the Kuril Trench is older than the Ryukyu Trench. Thus, considerable differences in the harpacticoid assemblages may have developed in each topographic setting around the Kuril region over a longer period, whereas no significant differences may exist around the Ryukyu region due to its shorter geological history.
Environmental factors that influence harpacticoid assemblages: do the same factors influence the distribution pattern of the harpacticoid families in the two trench regions?
The sorting coefficient (SC) has been suggested to influence the distribution of macrofaunal diversity (Etter & Grassle, Reference Etter and Grassle1992). For harpacticoids, several environmental factors have been suggested to influence them. Baguley et al. (Reference Baguley, Montagna, Lee, Hyde and Rowe2006) suggested that POM flux is strongly related to harpacticoid diversity in the deep-sea sediments of the Gulf of Mexico. Montagna (Reference Montagna1982) found that four species of Cerviniidae appeared at different depths and attributed this phenomenon to species adaptations to the different sedimentary environments. Shimanaga et al. (Reference Shimanaga, Nomaki and Iijima2008) reported that bathymetric changes in the composition of Cerviniidae species are regulated by certain factors associated with water depth.
The BIO-ENV analysis showed that the distribution pattern of harpacticoid families in the Ryukyu region was most correlated with CPE concentrations (ρ s = –0.28), suggesting that the amount of organic matter supplied to the sea floor may influence the harpacticoids in this region. In contrast, the MD and SC were most closely associated with the distribution pattern of harpacticoid families in the Kuril region (ρ s = 0.76), suggesting that sediment properties influence harpacticoid assemblages in this region.
Harpacticoid assemblages in the Ryukyu and Kuril regions appeared to be affected by different environmental factors. This observation led us to question why different factors affect harpacticoid assemblages in the Ryukyu and Kuril regions. One possible explanation is the differences in the supply of organic matter. In the Ryukyu region, organic fluxes were much lower than in the Kuril region (Itoh et al., Reference Itoh, Kawamura, Kitahashi, Kojima, Katagiri and Shimanaga2011). Consequently, competition for food in the Ryukyu region should be more severe, with food availability possibly influencing the harpacticoid assemblages. In the Kuril region, competition for food may be less severe, allowing other factors to affect the harpacticoid assemblage. Another possible explanation is associated with the topographical features of the Kuril region. The Kushiro Submarine Canyon, which is one of the largest submarine canyons around the Japanese islands (Ogawa et al., Reference Ogawa, Kobayashi, Tamaki, Thu, Hanamura and Kobayashi1993), is located near the sampling stations in this region. As a result, frequent turbidities disturb the sea floor (Noda et al., Reference Noda, TuZino, Furukawa, Joshima and Uchida2008), and these factors may influence harpacticoid assemblages in this region.
It is possible that the method of determining MD and SC values affected our analysis. The sediment samples obtained from the trenches were treated using an ultrasonic vibrator. This treatment may disintegrate larger particles, such as faecal pellets in the sediment, possibly influencing the results.
Independence of trench assemblages: are the assemblages on the two different trenches isolated from each other?
Trenches are spatially isolated environments that are separated by shallower areas (Jamieson et al., Reference Jamieson, Fujii, Mayor, Solan and Priede2009) and are therefore expected to contain distinct assemblages. When the same topographies were compared between the Kuril and Ryukyu regions, the average dissimilarities between the trenches and between the abyssal plains were higher than that between the trench slopes (Figure 4). This finding indicates that between these two regions, the habitats in the trenches and the abyssal plains are more isolated from each other than those in the trench slopes. This observation is contrary to the findings of Gheerardyn & Veit-Köhler (Reference Gheerardyn and Veit-Köhler2009) and Menzel et al. (Reference Menzel, George and Martínez Arbizu2011), which show that the distribution-ranges of benthic harpacticoid species can span thousands of kilometres and cross abyssal plains, ridge structures and complete oceans. Our results may be different because of the Izu-Ogasawara arc and trench, which are located between the two regions, and may prevent the expansion of harpacticoid distribution ranges. Interchange among regions may be difficult for deep-sea benthic animals, including harpacticoid copepods, likely due to the presence of physical barriers around trenches. Therefore, more detailed studies on the depth range of species are required to determine factors that may limit their dispersal.

Fig. 4. Average dissimilarities between the Ryukyu and Kuril regions.
Distribution of harpacticoid families around the world
Dominant families of harpacticoids do not drastically differ on a global scale (Table 7). In addition, two stations in the Angola Basin and three regions in the Pacific Ocean (the Ryukyu region, the Kuril region and the DEA site) formed clusters with 85% similarity (Figure 5). This finding suggests that harpacticoid assemblages in nearby regions are similar with respect to the relative abundance of families.

Fig. 5. The non-metric multidimensional scaling ordination based on data of the present study and data from previous studies. Existing studies comprise the DEA site, south-east Pacific Ocean (Ahnert & Schriever, Reference Ahnert and Schriever2001); Great Meteor Seamount (GMS), east Atlantic Ocean (George & Schminke, Reference George and Schminke2002); Patagonian continental slope (PCS), Southern Ocean (George, Reference George2005), Angola Basin (Angola M325 (AB 325) and M346 (AB 346)), South Atlantic Ocean (Rose et al., Reference Rose, Seifried, Willen, George, Veit-Köhler, Bröhldick, Drewes, Moura, Martínez Arbizu and Schminke2005); Northern Gulf of Mexico deep sea (NGM; Baguley et al., Reference Baguley, Montagna, Lee, Hyde and Rowe2006); and Porcupine Seabight (PS), north-east Atlantic Ocean (Gheerardyn et al., Reference Gheerardyn, De Troch, Vincx and Vanreusel2010). Contour lines indicate 85% similarity.
In the present study, we analysed the harpacticoid assemblages at the family level. However, it should be noted that further studies at the genus or species level are needed. Analysis at the genus or species level may reveal more detailed patterns of the harpacticoid assemblages than those shown in this study and may provide further information on trench assemblages. Unfortunately, species-level analyses present a major challenge as more than 95% of deep-sea harpacticoid specimens are new to science (cf. Seifried, Reference Seifried2004). In addition, identifications based on morphological characteristics should be performed with caution. For example, molecular studies on shallow-water harpacticoids have revealed that presumably cosmopolitan harpacticoid species are actually ‘species complexes’ (i.e. composed of several sibling species: Schizas et al., Reference Schizas, Street, Coull, Chandler and Quattro1999; Rocha-Olivares et al., Reference Rocha-Olivares, Fleeger and Foltz2001). Therefore, molecular analyses of deep-sea harpacticoids are required in association with the classical taxonomic approach to provide a clear picture of the deep-sea biodiversity patterns.
ACKNOWLEDGEMENTS
The authors are grateful to the officers and crew of the research vessel ‘Hakuho Maru’ and to the Japan Agency for Marine–Earth Science and Technology (JAMSTEC). R.D. was financially supported by the project HERMIONE—Hotspot Ecosystem Research and Man's Impact on European Seas (contract number 226354)—funded by the European Commission's Framework Seven Programme. We would like to thank two anonymous referees for helpful comments on the manuscript. The map contours (Figure 1) were drawn using ‘DC view ver. 1’ from the Marine Information Research Center, Japan Hydrographic Association and data from Basic Maps of Sea (Continental Shelf) No. 6311 and No. 6315 (published by Japan Coast Guard).


