


INTRODUCTION
The allometric or relative growth of an organism is a process that usually involves changes in the proportions of its body parts as well as in size (Rabaoui et al., Reference Rabaoui, Zouari, Katsanevakis and Hassine2007). According to Gould (Reference Gould1966), the genetic control of allometric relationships is responsible for the morphological variation between populations or lineages of a species. Most studies have analysed this phenomenon by means of the classical allometric linear model (y = axb), in which the proportion of growth between the parameters, i.e. the allometric exponent b, is always a constant (Rabaoui et al., Reference Rabaoui, Zouari, Katsanevakis and Hassine2007). However, the seasonal influence of factors such as water temperature (Moran et al., Reference Moran, Fairweather and Underwood1984; Chow, Reference Chow1987), food availability (Takada, Reference Takada1995), and reproductive period (Moran et al., Reference Moran, Fairweather and Underwood1984; Katsanevakis et al., Reference Katsanevakis, Thessalou-Legaki, Karlou-Riga, Lefkaditou, Dimitriou and Verriopoulos2007) on growth is not considered by the linear model. Errors from the adoption of this methodology can occur if the relationship between the parameters is non-linear, or is due to a discontinuity in the allometric exponent (Katsanevakis et al., Reference Katsanevakis, Thessalou-Legaki, Karlou-Riga, Lefkaditou, Dimitriou and Verriopoulos2007). Recently, efforts have been made to avoid such problems by means of an alternative analysis based on Kullback–Leibler (K-L) information theory and multi-model inference (MMI) (described by Burnham & Anderson, Reference Burnham and Anderson2002). Assuming that the allometric exponent can change over time, Katsanevakis et al. (Reference Katsanevakis, Thessalou-Legaki, Karlou-Riga, Lefkaditou, Dimitriou and Verriopoulos2007) used this alternative methodology to evaluate the best model for the allometric growth of some marine invertebrates. The authors observed that for several relationships, the linear model was not always the most appropriate to explain the data.
Usually, only the shell length is employed to evaluate growth for coiled gastropods, and is measured from the apex to the farthest point of the body whorl along the axis of coiling (Ekaratne & Crisp, Reference Ekaratne and Crisp1984). For the family Nassariidae, commonly found on sand–mud beaches (Britton & Morton, Reference Britton and Morton1994), the growth of some Nassarius species has been analysed. Shell length distribution frequencies were applied to describe the growth pattern of Nassarius reticulatus (Linnaeus, 1758) by Tallmark (Reference Tallmark1980) and Lambeck (Reference Lambeck1984). Barroso et al. (Reference Barroso, Moreira and Richardson2005a), studying the same species, worked with the shell length distribution frequencies and internal and external growth rings. Mark–recapture experiments were used for N. reticulatus by Tallmark (Reference Tallmark1980), Nassarius dorsatus (Roeding, 1798) by McKillup & McKillup (Reference McKillup and McKillup1997), and Ilyanassa obsoleta (Say, 1822) by Curtis (Reference Curtis1995). Recently, statolith growth rings were used successfully to evaluate the growth of N. reticulatus (Barroso et al., Reference Barroso, Nunes, Richardson and Moreira2005b; Chatzinikolaou & Richardson, Reference Chatzinikolaou and Richardson2007). However, there are no allometric growth analyses for the family.
The allometric growth of Nassarius vibex (Say, 1822), a common intertidal scavenger, was studied on two beaches in south-east Brazil. The species lives on sandy and muddy beaches and is sometimes associated with mussel beds, over a wide area along the east coast of South America. In this study, the allometric growth of N. vibex was analysed using the methodology described by Katsanevakis et al. (Reference Katsanevakis, Thessalou-Legaki, Karlou-Riga, Lefkaditou, Dimitriou and Verriopoulos2007). Assuming that growth pressures might act differently over a spatial range, the two groups of N. vibex were also compared.
MATERIALS AND METHODS
Study areas
Specimens of Nassarius vibex were collected on two beds of Mytella charruana (d'Orbigny, 1842), one on Camaroeiro Beach (23°37′28″S 45°23′56″W) and the other on Cidade Beach (23°37′35″S 45°23′51″W), both located in northern Caraguatatuba Bay, State of São Paulo, Brazil (Figure 1). Camaroeiro Beach, with an intertidal zone 50 m wide during low tide periods, is composed of fine, poorly to moderately sorted sand (Yokoyama, Reference Yokoyama2010). The mussel bed was located parallel to the water line, and had an ellipsoid shape (40 m long and 20 m wide in its central portion) with elevated edges formed by the dense aggregations of bivalves.
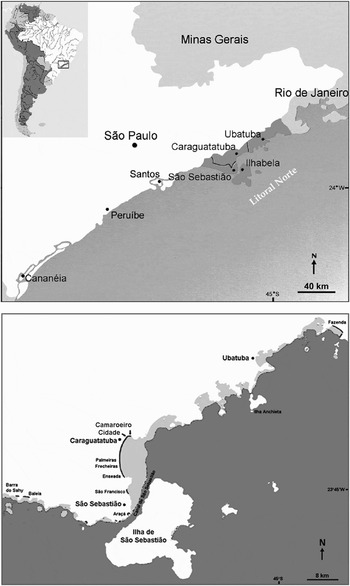
Fig. 1. Study area showing location of the Caraguatatuba Bay and the Camaroeiro and Cidade beaches on the north coast of the State of São Paulo, Brazil (maps modified from Lamparelli, Reference Lamparelli1998).
Cidade Beach is composed of fine and very fine sand, with a high percentage of silt and clay and low proportions of organic matter and calcium carbonate (Arruda & Domaneschi, Reference Arruda and Domaneschi2005). The width of the intertidal zone was around 60 m. The mussel bed, parallel to the water line, had an ellipsoid shape (28 m long and 18 m wide). In contrast to the Camaroeiro bed, no mussels were observed buried in the substrate.
Sampling and laboratory procedures
Individuals of N. vibex were collected monthly on Camaroeiro Beach from September 2006 to February 2007, and on Cidade Beach from March 2007 to June 2007. All samples were taken randomly over the full width of the beds, and individuals were hand-collected and stored in plastic bags. In the laboratory, six morphometric characters (Figure 2) were measured with a digital caliper to the nearest 0.01 mm: shell length (L), width (W), and height (H), and shell aperture length (Al) and width (Aw). The shell apical angle (Aa) was calculated based on Preston & Roberts (Reference Preston and Roberts2007), by the equation: Aa = 2tan(0.5 W/L), where W is the shell width and L is the shell length.

Fig. 2. Morphometric parameters measured for Nassarius vibex. Pictures and diagram of the shell apical angle (Aa) calculus. Al, aperture length; Aw, aperture width; H, shell height; L, shell length; W, shell width.
Data analysis
The normality of the data was assessed with a Shapiro–Wilk test, and the existence of differences in the mean size of the individuals between the areas was assessed for the six parameters with a Student's t-test. The morphometric data were submitted to a principal components analysis (PCA) to observe possible patterns in the two groups (Camaroeiro and Cidade). The data for N. vibex were subjected to a PCA in an attempt to find intra- and inter-group patterns because of size relationships and differences in growth. The components are usually characterized as composites of the shell parameters with the highest factor loadings, and, as suggested by Frey & Pimental (Reference Frey, Pimental and Colgan1978), were defined as larger than + or –0.6. Subsequently, the Chi-square test (χ2) was used to evaluate the existence of differences between the eigenvalues of each principal component.
The allometric growth of W, H, Al, and Aw in relation to L, and the relationship between W/H and Al/Aw were investigated. The data were log-transformed, and for each comparison three different allometric models were used (linear, quadratic and cubic). The corresponding formulae applied to the data were the linear (Ln), log y = a1 + b1log x, quadratic (Qd), log y = a1 + b1log x + b2(log x)2, and cubic (Cb), log y = a1 + b1log x + b2(log x)2 + b3(log x)3. Other models suggested by Katsanevakis et al. (Reference Katsanevakis, Thessalou-Legaki, Karlou-Riga, Lefkaditou, Dimitriou and Verriopoulos2007), such as the broken-stick and two-segments, were discarded, since visually they did not fit the relationships.
According to Katsanevakis et al. (Reference Katsanevakis, Thessalou-Legaki, Karlou-Riga, Lefkaditou, Dimitriou and Verriopoulos2007), the linear model assumes that allometry does not change as body size increases. The quadratic and cubic models assume that b changes continuously with increasing body size. The small-sample, bias-corrected form Akaike information criterion (AICc) (Hurvich & Tsai, Reference Hurvich and Tsai1989) of the AIC (Burnham & Anderson, Reference Burnham and Anderson2002) was used for model selection according to the equation:
in which AIC is given by:
where RSS is the residual sum of squares of the regression, n is the number of observations, and k is the number of parameters of the regression plus 1. In this case, it was necessary to assume normally distributed deviations with homogeneous variances for the data. The model with the smallest AICc value (AICc,min) was selected as the ‘best’ among the models tested. The AICc differences, Δi = AICc,i – AICc,min were computed for all candidate models.
According to Burnham & Anderson (Reference Burnham and Anderson2002), models with Δi > 10 have essentially no support and can be omitted from further consideration, and models with Δi < 2 have substantial support, while there is considerably less support for models with 4 < Δi < 7. However, they did not discuss results such as 2 < Δi < 4 or 7 < Δi < 10. In the present study, we considered that all values of Δi < 2 showed substantial support for the model. To quantify the plausibility of each model, given the data and the set of three models, the ‘Akaike weight’ (wi) of each model was calculated, given by:

The ‘Akaike weight’ is considered as the weight of evidence in favour of model i being the ‘best’ model of the available set of models (Akaike, Reference Akaike1983; Buckland et al., Reference Buckland, Burnham and Augustin1997; Burnham & Anderson, Reference Burnham and Anderson2002). ‘Average’ models were estimated by averaging the predicted response variable across models, using the corresponding wi as weights (Burnham & Anderson, Reference Burnham and Anderson2002). To aid in the visualization of the differences between the linear and the average models, a residual plot fitted with a loess function (as Katsanevakis et al., Reference Katsanevakis, Thessalou-Legaki, Karlou-Riga, Lefkaditou, Dimitriou and Verriopoulos2007) was applied for each relation.
RESULTS
Morphometry
Comparisons between the mean values for the six morphometric parameters measured for Nassarius vibex showed significant differences between the areas for shell length and width, aperture length, and apical angle. Individuals from Camaroeiro had shells with greater length and width than those from Cidade (Table 1).

Fig. 3. Principal component analysis (PCA) for the two groups of Nassarius vibex. Scatter plot of the log-normalized raw data of the five measured parameters for the Camaroeiro (open triangles) and Cidade (grey quadrats) beaches.
Table 1. Mean values and standard deviation (SD) of the morphometric parameters measured for the individuals of Nassarius vibex on the Camaroeiro and Cidade beaches. The Student's t-test (t) was applied to each comparison of parameters between beaches with a significance level (α) of 0.05. Values in bold typeface indicate significant differences.

Aa, apical angle; Al, aperture length; Aw, aperture width; H, shell height; L, shell length; N, number of individuals; N.S., non-significant; W, shell width.
The PCA presented differences between the two areas with respect to the shell size (Figure 3), especially for the small individuals; as confirmed by the differences between the PCs (Table 2). In the Cidade, the very small individuals, represented by the low values of PC1, are almost restricted to the lower left quadrant of the graph (Figure 3). For the Camaroeiro, small individuals are almost equally distributed in the left quadrants of the plot. At larger sizes, represented by the positive values of PC1, most of the Camaroeiro individuals have negative PC2 values, whereas most Cidade individuals had positive values of PC2 (Figure 3).
Table 2. Principal component analysis (PCA) results. Component loadings of each morphometric parameter of Nassarius vibex and percentages of explained variance. High loadings are indicated in bold.
Aa, apical angle; Al, aperture length; Aw, aperture width; H, shell height; L, shell length; W, shell width.
PC1 explained 73.01% of the observed variance in the data, and was influenced by all the morphometric parameters. The apical angle was the most notable influence in PC2, and together with PC1 corresponded to 91% of the cumulative variance in the data. The third component, in addition to its low loading value, was characterized by shell aperture parameters (Al and Aw). This PC was responsible for 5.15% of the total variance in the data, and together with the other two PCs totalled 96.75% of the total variance. When comparing each PC between the areas, significant differences were apparent. Individuals from Camaroeiro were larger (t = 2.10, P < 0.05) than those from Cidade and also had a larger apical angle (t = 11.63, P < 0.05). However, individuals from Cidade had a larger shell aperture (t = –11.23, P < 0.05), represented by PC3.
Allometric growth
The relative growth of Camaroeiro specimens varied widely during development. The cubic model was the most frequent, with high values of wi for three of the six morphometric relationships (Table 3). The linear model was more plausible for the relationship L/H, whereas the relationships L/Al and L/Aw better fit the quadratic model, with the highest values of wi (Table 3). The cubic model was also the most common for four of the six morphometric relationships for the Cidade population (Table 4). The relationships L/Al and L/Aw were better explained by the linear and quadratic models, respectively.
Table 3. Values of Akaike information criterion (AIC c), AIC c differences (Δi), and Akaike weights (w i) for the linear (Ln), quadratic (Qd), and cubic (Cb) models applied to the six morphometric relations of Nassarius vibex on the Camaroeiro bed. Bold percentages correspond to the most plausible models.

Al, aperture length; Aw, aperture width; H, shell height; L, shell length; W, shell width.
Table 4. Values of Akaike information criterion (AIC c), AIC c differences (Δi), and Akaike weights (w i) for the linear (Ln), quadratic (Qd), and cubic (Cb) models applied to the six morphometric relations of Nassarius vibex on the Cidade bed. Bold percentages correspond to the most plausible models.

Al, aperture length; Aw, aperture width; H, shell height; L, shell length; W, shell width.
Both areas shared some similarities in the models tested for many of the relationships analysed (Tables 3 & 4), with the cubic and linear models being the most frequent and with the highest plausibility. Differences were observed in the relationship L/W, in which the linear model was the most plausible for Camaroeiro, whereas the cubic model had the highest value of wi for the Cidade individuals. For some relationships it was difficult to isolate a single plausible model, given their low and similar Δi values. This was the case of L/Aw for Camaroeiro, where it was not possible to discard the cubic model, even though the quadratic model had a higher wi. In these cases we opted to accept and plot, the average model, using the corresponding wi as weights (Figure 4). The residual plots of the average models, which showed a lower dispersion of the data when compared to the linear models residuals, also indicated a differential relative growth for all of the non-linear average models (Figure 4).

Fig. 4. Growth estimates and comparisons of the linear and average models for the six morphometric relations of Nassarius vibex evaluated in the Camaroeiro and Cidade beds. The curves were calculated based on the equations obtained for each average model. Al, aperture length; Aw, aperture width; H, shell height; L, shell length; W, shell width. Comparisons are based on a loess function fitted to the residuals of each morphometric relation.
The Camaroeiro individuals showed isometric growth between shell length and width (Figure 4), whereas the growth of L in relation to H, Al, and Aw varied, being described by quadratic and cubic relationships. The two relationships of shell length with aperture parameters were defined by quadratic models (Table 3; Figure 4). In the relationships L/H and Al/Aw, the cubic model showed a variation over time in the relative growth.
In the Cidade bed, the growth of shell length in relation to width and height was determined by cubic relationships, indicating variation in growth during the development of the individuals (Figure 4). Furthermore, both W/H and Al/Aw also showed variations in relative growth. The relationships L/Al and L/Aw best fit the linear and quadratic models, respectively.
The growth of shell width and height in proportion to shell length did not differ between the areas, even with different allometric models (Figure 4). The development of the shell aperture differed between the two beds: individuals from Camaroeiro had a smaller aperture than those from Cidade. There were no differences in the development patterns of allometric growth between shell width and height; however, the pattern was not the same for the relationship Al/Aw, where the large difference in relative growth was restricted to the small size-classes (Figure 4).
DISCUSSION
The shell size of Nassarius vibex was significantly different between the two areas during the period of study. Individuals from Camaroeiro had larger shell length, width, and apical angle and smaller shell aperture than those from Cidade. The data reduction by the PCA reinforced the morphometric differences between the groups. It was possible to identify patterns of size-distribution between the areas. Small individuals of Cidade are smaller than those of Camaroeiro, and there was a clear separation for the larger nassarids. The PC2 values for the larger individuals, with positive values for most of the individuals of the Cidade and negative for the Camaroeiro, indicates a morphometric variation between the two groups and reinforce our results with the non-reduced data. To the present results, PC1 represents a ‘size’ component, which is confirmed by the similar weights of L, W, H, Al, and Aw, while PC2 is considered as a ‘shape’ component, also confirmed by the bipolar weighting of the variables (Table 2).
Thus, the size differences among N. vibex between the areas are a consequence of a morphometric variation within the groups, with contributions of juvenile and adult individuals. There is an early morphometric separation of the two sub-groups, with the small individuals of Cidade being smaller than those of Camaroeiro. This is also confirmed by the model comparisons, in which, for some morphometric variables, there was a distinction between the growths of small nassariids. Thus, the differences in relative growth patterns between the two sub-populations are supported not only by the allometric growth analysis but also by the PCA graph.
PCs 1 and 2 explained approximately 91% of the total data variance and were strongly influenced by several shell form parameters (Table 2). These results are similar to the study of Preston & Roberts (Reference Preston and Roberts2007) on Calliostoma zyziphinum (Linnaeus, 1758), who found differences in size among shells from four areas of the British Isles. According to these authors, food availability was the major component that induced the morphometric differences in C. zyziphinum, where individuals that occurred at locations with better resources had better growth, avoided predation, and recovered quickly from unsuccessful predation attempts. For N. vibex, there was no record of high percentages of predation marks on the shells, and empty shells were rare in both areas. Predatory influence cannot yet be discarded, but these results point to another hypothesis. Being a scavenger species (Demaintenon, Reference Demaintenon2001), the mussel bed and its surroundings must represent a good food resource for N. vibex. Studies on the condition index of the two beds of Mytella charruana found no differences in the quality of this possible food resource. In an evaluation of the diet of N. vibex, Forroni et al. (Reference Forroni T. de, Yokoyama and Amaral2008) identified algae and fragments of polychaetes and crustaceans in the stomach contents. The authors did not evaluate the availability of these resources in the areas, and therefore it is not possible to establish a relationship for the morphometric differences observed between the two groups of nassariids. Similar observations have been reported for other species, including Nassarius pauperatus (Lamarck, 1822) (McKillup & Butler, Reference McKillup and Butler1983) and Nassarius dorsatus (McKillup & McKillup, Reference McKillup and McKillup1997), where small-sized individuals exposed to high food concentrations grew more rapidly than older and larger individuals.
Chilina parchappii (d'Orbigny, 1835) from the Napostá Grande stream in southern Argentina showed morphological contrasts in shell shape among four locations (Martín, Reference Martín2003). Nassarius festivus (Powys, 1838) had different mean shell lengths at three beaches in Hong Kong (Morton & Chan, Reference Morton and Chan2004). Comparing the two groups of N. vibex, a small degree of morphological overlap was recorded, but mean shell parameters (length, width and aperture length) were significantly different. As stated by Martín (Reference Martín2003) for C. parchapii, because of the spatial proximity between the areas (approximately 500 m), genetic isolation between the two groups of N. vibex is improbable, and the morphological differences must consequently result from other factors.
Adopting the classical allometric model to analyse the growth of an organism, instead of selecting a specific model based on K-L information theory and MMI as described by Burnham & Anderson (Reference Burnham and Anderson2002) and Katsanevakis et al. (Reference Katsanevakis, Thessalou-Legaki, Karlou-Riga, Lefkaditou, Dimitriou and Verriopoulos2007), may lead to false conclusions (Katsanevakis et al., Reference Katsanevakis, Thessalou-Legaki, Karlou-Riga, Lefkaditou, Dimitriou and Verriopoulos2007; Protopapas et al., Reference Protopapas, Katsanevakis, Thessalou-Legaki and Verriopoulos2007; Rabaoui et al., Reference Rabaoui, Zouari, Katsanevakis and Hassine2007). In this case there is a high possibility of concluding that positive allometry exists when it is actually negative, or vice versa (Katsanevakis et al., Reference Katsanevakis, Thessalou-Legaki, Karlou-Riga, Lefkaditou, Dimitriou and Verriopoulos2007; Protopapas et al., Reference Protopapas, Katsanevakis, Thessalou-Legaki and Verriopoulos2007). Such errors normally are not considered in analyses of allometric growth of many organisms. Unfortunately, apart from a few studies (Katsanevakis, Reference Katsanevakis2007; Katsanevakis et al., Reference Katsanevakis, Thessalou-Legaki, Karlou-Riga, Lefkaditou, Dimitriou and Verriopoulos2007; Rabaoui et al., Reference Rabaoui, Zouari, Katsanevakis and Hassine2007), information theory and multi-model inference have not been used in the study of relative growth of gastropods. Until now most studies have applied the classical approach (linear allometric model) for marine (McShane et al., Reference McShane, Smith and Beinssen1988; Tokeshi et al., Reference Tokeshi, Ota and Kawai2000; Tanaka & Maia, Reference Tanaka and Maia2006), freshwater (Kemp & Bertness, Reference Kemp and Bertness1984; Martín, Reference Martín2003; Elkarmi & Ismail, Reference Elkarmi and Ismail2007), and terrestrial gastropods (Shanmugan, Reference Shanmugam1997; Estebenet, Reference Estebenet1998).
The linear allometric model, used in several allometric growth studies, was not the most common for all relationships in N. vibex (Tables 3 & 4). Most of the relationships were better explained by the Cb model, and this suggests that the proportion of growth of one parameter to another is size-dependent. Normally, small individuals of N. vibex showed different growth rates from those of adults, which generated a curved line in the plots (Figure 4). In the present study, the proportion of growth of the shell height differed between beaches according to the respective shell length. Young individuals from the Cidade bed increased their shell height more than the gastropods of the same size from Camaroeiro, whereas the inverse was observed for individuals with large shell lengths. The growth pattern of Al and Aw differed between the areas, with Cidade snails developing larger apertures than individuals from Camaroeiro. It seems that this growth pattern derived from an initial difference in growth rate in the two areas, because large individuals had the same growth curves independently of the beach. This indicates a high growth rate for the individuals from Cidade. However, a study of population dynamics in the two mussel beds (Yokoyama, Reference Yokoyama2010) found rapid growth for individuals of Camaroeiro Beach, and could explain the differences between the two areas. The significant difference in the shell aperture between the groups of N. vibex may reflect a differential growth rate influenced by the age of the individuals, especially for the juveniles.
In the present case, it is obvious that adopting the linear approach could result in loss of information. For gastropods such as N. festivus (Morton & Chan, Reference Morton and Chan2004), there is a temporal variation in growth rates over the lifespan, with juveniles growing faster than adults. Such temporal modifications may be lost in the linear model (y = axb), where the allometric exponent b is always a constant. However, the allometric exponent may not always remain constant, since points of discontinuity in slope b were recognized by Huxley (Reference Huxley1932) and can change continuously following a smooth, curvilinear trend without exhibiting marked breakpoints (Hall et al., Reference Hall, Smith, Lestang and Potter2006; Rabaoui et al., Reference Rabaoui, Zouari, Katsanevakis and Hassine2007). This is a consequence of differential age-class growth because of pressures including competition (Grudemo & Bohlin, Reference Grudemo and Bohlin2000), food availability (Underwood, Reference Underwood1976; Edwards & Huebner, Reference Edwards and Huebner1977; McKillup & McKillup, Reference McKillup and McKillup1997), and temperature (Barroso et al., Reference Barroso, Moreira and Richardson2005a).
The allometric growth of N. vibex is irregular, changing over the development of the individual. Even with the spatial proximity, the two groups analysed showed different growth patterns. Marked differences in growth patterns have also been reported between individuals of the same population that are subject to different environmental conditions (García-March et al., Reference García-March, García-Carrascosa, Peña Cantero and Wang2007). The two areas (Camaroeiro and Cidade beaches) differ in the morphodynamic states and the degree of human influence. Camaroeiro is normally affected by cyclical currents that form sand beds (Farinaccio, Reference Farinaccio2000), which modifies the sediment composition and consequently reduces the population of N. vibex. Breakwaters present at Cidade provide better protection for this area, preventing changes in the sediment composition. However, human-caused effects are more intense than at Camaroeiro, because of the exploitation of the mussels by local fishermen. This mussel removal reduces the population of M. charruana and also alters the sediment composition. As stated by Katsanevakis et al. (Reference Katsanevakis, Thessalou-Legaki, Karlou-Riga, Lefkaditou, Dimitriou and Verriopoulos2007), the present study confirms the necessity to apply a set of allometric models that assume changes in the allometry and discontinuity of the allometric exponent. These changes in the growth trajectory are an important source of information about the biology of the species, and may reflect the direct influence of processes such as sexual maturation and recruitment.
ACKNOWLEDGEMENTS
We are grateful to Rachel F. Daolio, Carolina C. Taffarello, Camila F. Silva, Mônica P. Quast, Fábio S. MacCord and Jolnnye R. Abrahão who contributed to the sampling. Also we have to thank Stelios Katsanevakis for his assistance in the statistical analyses. We thank two anonymous referees for their comments and suggestions. We thank the Centro de Biologia Marinha da Universidade de São Paulo (CEBIMar–USP) for the logistic support. English was revised by Janet W. Reid. This work was supported by the Coordenação de Aperfeiçoamento de Pessoal de Nível Superior (CAPES); the Conselho Nacional de Desenvolvimento Científico e Tecnológico (CNPq); the Fundação de Apoio ao Ensino, à Pesquisa e à Extensão da Universidade Estadual de Campinas (FAEPEX/UNICAMP); and the Programa de Apoio à Pós-Graduação da Universidade de São Paulo (PROAP/USP).


