


INTRODUCTION
Anchovy is the most important migratory small pelagic species in the Black Sea and is mainly harvested during its winter migration along the coast of Turkey. Historically, anchovies spawned in the north-western Black Sea and migrated to the Turkish coast from early October through to late March (Slastenenko, 1955, Reference Slastenenko and Altan1956). More recently, a survey conducted in the Turkish exclusive economic zone also identified large spawning grounds in southern Black Sea waters (Niermann et al., Reference Niermann, Bingel, Ergün and Greve1998). Within the Black Sea, anchovies represent two subspecies: Engraulis encrasicolus ponticus and Engraulis encrasicolus maeticus. The former is known as the Black Sea anchovy; this sub-species may grow up to 18–20 cm and live to be 4 years old (Slastenenko, 1955, Reference Slastenenko and Altan1956). The other sub-species is the Azov anchovy, which may reach up to 15 cm in total length (Fischer, Reference Fischerl973). Bingel & Gücü (Reference Bingel and Gücü2010) posit that there is a hybrid in addition to these two sub-species.
The total catch of anchovy (229,023 t) comprises 35.07% of the total and 47.13% of the marine capture fish landings in Turkey (TUIK, 2011). The catch of anchovy has shown great variation since 1970 (Figure 1).

Fig. 1. Anchovy production by the Turkish fleet in the Black Sea.
The gradual increase in anchovy production through the late 1980s (Figure 1) may be due to the establishment of the new administration body, Fisheries DG, the implementation of the new Fisheries Law No. 1380 and subsidies given to fishermen for building new, longer steel vessels, importing new fishing gear and purchasing long range fish finders. Similar funds were also provided for the construction of new fish meal and oil processing plants. As a result of these support schemes, Turkish fish production peaked in the 1988–89 fishing season. After this time period, anchovy stocks collapsed due to the impact of invasive Mnemiopsis leidyi, which consume copepods (Clanus euxinus), the main food source for anchovy, and prey on anchovy eggs and larvae (Kideys, Reference Kideys1994). After 1999, the M. leidyi population started to decline due to the introduction of the predatory ctenophore Beroe ovata. Simultaneously, anchovy and other fish production started to increase. At present, the anchovy population is under pressure from over-fishing due to over-investment in the fishing fleet and the impact of global warming on the Black Sea (Rass, Reference Rass1992; Boran, Reference Boran1995).
To estimate the effects of the above-mentioned impacts on the anchovy population parameters, several surveys were conducted in the Black Sea by Erkoyuncu & Özdamar (Reference Erkoyuncu and Özdamar1989), Karacam & Duzgunes (Reference Karaçam and Düzgüneş1988), Ünsal (Reference Ünsal1989), Gozler & Ciloglu (Reference Gözler and Çiloğlu1998), Samsun et al. (Reference Samsun, Samsun, Kalayci and Bilgin2006) and Satılmıs et al. (Reference Satılmış, Erdem, Özdemir and Sümer2010). Management measures for anchovy fisheries were implemented by the Ministry of Food, Agriculture and Live Stock (MFALS) based on technical advice produced by universities and research institutes. These measures included establishing a minimum landing size (9 cm total length), implementing closed seasons (from 15 April to 1 October) and setting depth limitations for purse seine vessels (greater than 6 fathoms = 10 m depth) (MFALS, 2009). As a result of the measures taken by the Ministry, recoveries of anchovy populations were observed in some years (Figure 1). However, there is still no management plan for anchovy fisheries in Turkey. Rather, there is a substantial failure to record the true catch and landing data and a lack of national intention to implement regular stock assessments and monitoring programs. Most of the surveys are performed by the universities as MSc and PhD projects. Thus, the results of any study on population parameters may be helpful for the design of new management measures for anchovy fisheries. Anchovy is a short-lived species and the Black Sea is a fragile ecosystem. Any changes in the ecosystem and environmental conditions together with overfishing may cause a serious impact on anchovy population as possible reduction in the parent stock, loss of eggs and larvae and changes in schooling behaviour and in migration pattern (Erdogan et al., Reference Erdogan, Duzgunes and Ogut2009). For better understanding the possible changes in anchovy population, frequent monitoring surveys are very essential. The present study contains important results, which will allow for a better understanding of the anchovy population in the south-eastern Black Sea.
MATERIALS AND METHODS
Anchovy samples were collected randomly from purse seine vessels operated in the region between the Sinop and Trabzon provinces from September 2010 to March 2011 (Figure 2).

Fig. 2. Black Sea fishing grounds and sampling region.
In total, 3442 individual anchovy were sampled from different purse seine nets which had a mesh size of 6.5 mm and encircled an area 700–1400 m in length and 150–160 m in depth. The fish were transported to the laboratory at the Ordu University Faculty of Marine Science in iced styrofoam boxes. Fish length was measured as the total length to the nearest 0.1 mm. The fish were dried with paper tissue and weighed using a ‘Precisa’ (Switzerland) electronic balance with a precision of ±0.01 g. Sex determination was performed by direct observation of gonads. Fish with immature gonad structures were recorded as an unidentified.
Otoliths were removed, cleaned with 90% alcohol, and kept in 86 × 128 × 10 mm Nucleon TM 96 MicroWell TM Plates (Denmark) prior to age determinations with a stereo microscope (Nikon 8MZ800). Due to high similarity between left and right otoliths, both of them were used during the ageing of the anchovy (Brothers, Reference Brothers, Summerfolt and Hall1987). Moreover, age readings were corroborated by the Bhattacharya method using FISAT software (FAO, 2000), especially for the age groups containing insufficient samples within sex groups.
The length–weight relationship was calculated using Le Cren's equation: W = aL b (Le Cren, Reference Le Cren1951), where W is the total weight (g), L is the total length (cm), a is the y-intercept, and b is the regression coefficient. Parameters (a) and (b) were calculated by the least squares method using Microsoft Excel® (Ricker, Reference Ricker1975).
The Von Bertalanffy growth equations were used to determine the age–length and age–weight relationships of the population (Von Bertalanffy, Reference Von Bertalanffy1957; Ricker, Reference Ricker1975).
 $$L_{t}=L_{\infty} \lsqb 1 - e ^{\lcub-k \lpar {t} - {to} \rpar \rcub}\rsqb$$
and
 $$W_{t}=W_{\infty} \lsqb 1 - e ^{\lcub-k \lpar {t} -{to}\rpar \rcub} \rsqb ^b$$
where t is the age (yr), t 0 is the theoretical age when the fish length was assumed to be zero, L t is the length at age t (cm), W t is the weight at age t (g), k is the Broody coefficient, L ∞ is the asymptotic length (cm), W ∞ is the asymptotic weight (g), and b is the regression coefficient from the length–weight relationship (Sparre & Venema, Reference Sparre and Venema1992; King, Reference King1995).
The Fulton condition factor (CF) was calculated as CF = (W/L 3) × 100 (Ricker, Reference Ricker1975).
Phi prime (Ø′) is an index of growth performance and was calculated using the following equations:
 $$\emptyset^{\prime} = \hbox{Ln k} + \hbox{2 Ln L}_{\infty }$$
and
 $$\emptyset = \hbox{Ln k} + \hbox{2 Ln W}_{\infty }$$
where k and L∞ are Von Bertalanffy growth equation parameters (Sparre & Venema, Reference Sparre and Venema1992).
The total mortality rate (Z) was estimated using a length–converted catch curve:
 $$\hbox{Ln k} \lpar N/\Delta t\rpar =\hbox{a+b}\rm_t\comma \;$$
where N is the number of fish in each length group, a and b are the regression coefficients (Sparre & Venema, Reference Sparre and Venema1992), Δt is the time needed to grow from the lower (t 1) to the upper (t 2) limit of a given length-class and t is the relative age corresponding to the mean range of each length-class. Z is equivalent to ‘-b’ in the regression line. The natural mortality rate (M) was calculated using the equation given by Pauly (Reference Pauly1980):
 $${\rm Log}\lpar M\rpar =0.8\lcub \!-\! 0.0066 - 0.279{\rm log\lpar L_{\infty}\rpar } + 0.6543{\rm log\lpar k\rpar } + 0.4634log\lpar T\rpar \rcub \comma \;$$
where T is the mean annual water temperature (in this case, anchovy schools were migrating in water with a mean temperature of 12°C). The fishing mortality rate (F) was calculated as F = Z–M. Survival rates and mean annual mortality were calculated as S = e− Zt and A = 1–S, respectively. The exploitation rate (E) was estimated as E = F/Z (Gulland, Reference Gulland1971, Reference Gulland1983; Bingel, Reference Bingel1985).
Chi-square and Student's t-tests were used to test for significant differences between the rates listed above, observed length values and calculated relationships for both males and females. Microsoft Excel® was used to calculate all descriptive statistics and for the preparation of the graphs.
RESULTS
The mean length and weight of the samples were 11.63 ± 0.02 cm (5.80–14.80 cm) and 9.98 ± 0.04 g (0.99–19.47 g), respectively. Females were slightly larger in size, and the differences between males and females by month were statistically significant (P < 0.05) (Figure 1).
Taken together, the growth of both sexes declined over the fall from a mean length and weight of 11.91 cm and 11.47 g at the beginning of the fishing season (September) to 10.59 cm and 7.99 g in December, respectively; subsequently, the length increased through March, and the weight increased to a mean of 10.27 g in February (Figure 3).

Fig. 3. Length and weight of anchovy by month with standard deviation.
The observed sex composition of the samples was 34.4% males, 61.3% females (1:1.78), and 4.3% unidentified. The sex composition was significantly different than 1:1 (P < 0.05), and females were more abundant than males in the anchovy population during the survey period. The sex composition exhibited a similar significant bias towards females throughout the fishing season (Table 1).
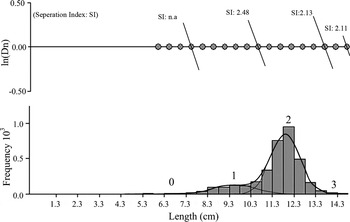
Fig. 4. Age groups determined by the Bhattacharya method using age–length frequency data.
Table 1. Sex composition and mean weights and lengths of anchovy in the south-eastern Black Sea during the fishing season.

As a result of the ageing studies, four age groups of length-class were defined and were designated 0 to 3 (Table 2). Direct ageing results from otoliths were corroborated using the Bhattacharya method implemented with FISAT software with similar results (Figure 4).
Table 2. Length-class for different age groups of anchovy.
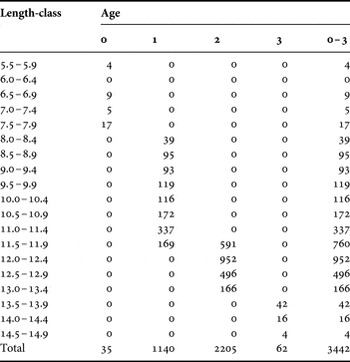
The majority of the fish (64%) belonged to age group 2, followed by age 1 (33%); age group 3 (2%) fish were rare. The most likely reason for this distribution is that the Black Sea coast of Turkey is the wintering area for anchovy, while the largest stocks of younger recruits are found along the north-western shelf of the Black Sea in Romania. However, although purse seine nets (the main fishing gear used to harvest anchovy) are not selective, fishermen do not want to catch undersized anchovies (<9 cm total length) during the fishing season. All of the unsexed samples were in the age groups 0 and 1. Females were more abundant than males at all ages except age 0 (Table 3).
Table 3. Sex composition and mean lengths and weights of anchovy by age (bold figures are the estimated lengths computed using the length–weight equation).

Length–weight equation parameters were derived for each sex. Both sexes had similar ‘a’ values, but the regression coefficient ‘b’ was slightly higher in males. Growth of the anchovy population showed negative allometry (b < 3) in the survey area during the 2010–2011 fishing season. Males had higher correlation coefficients than females.
The length–weight equation derived from the samples as W = 0.011L 2.742 represents the population because the difference between the observed and expected lengths was not statistically significant (Student's t-test, Table 3). Similar tests were applied to the length by age data obtained from the otolith rings and via the Bhattacharya method. The differences between the mean lengths obtained using two methods were not statistically significant. CF was also calculated by age group, sex and month. The mean CF for males (0.64) was greater than that for females (0.62), and the total mean CF was 0.63 (Table 3). CF was highest at the beginning of the fishing season and gradually decreased through March (Figure 5).

Fig. 5. Condition factor of anchovy by month.
The Von Bertalanffy growth parameters were as follows: L ∞ = 16.368 cm, W ∞ = 23.516 g, k = 0.425 and t 0 = −1.35 (Table 4). Females had higher infinitive length and weight values but lower k and t 0.
Table 4. Von Bertalanffy growth parameters and growth performance indices.

*, the individuals whose gender could not be determined were also included.
Males exhibited a higher growth performance than females. For the total population, length and weight growth performances were calculated as Ø′ = 2.056 and Ø = 0.543, respectively.
Survival and mortality rates are given in Table 5. The mean survival rate (S) was calculated as 5.8%, and the corresponding annual mortality rate (A) was 94.2%. Instantaneous, total natural and fishing mortality rates were estimated as Z = 2.84 yr−1, M = 0.66 yr−1 and F = 2.18 yr−1, respectively. The exploitation rate derived from the mortality rates was high (0.77).
Table 5. Estimated anchovy population parameters from previous surveys.

Özdamar et al. (Reference Özdamar, Kihara and Erkoyuncu1991), (2) Karacam & Duzgunes, (Reference Karaçam and Düzgüneş1988), (3) Duzgunes & Karacam (Reference Düzgüneş and Karaçam1989), (4) Ünsal (Reference Ünsal1989), (5) Okur (Reference Okur1989), (6) Genc & Basar (Reference Genç and Başar1991), (7) Genc & Basar (Reference Genç and Başar1992a), (8) Genc & Basar (Reference Genç and Başar1992b), (9) Mutlu (Reference Mutlu1994), (10) Özdamar et al. (Reference Özdamar, Samsun and Erkoyuncu1995), (11) Mutlu (1996), (12) Kayalı (Reference Kayalı1998), (13) Mutlu (Reference Mutlu2000), (14) Mutlu (Reference Mutlu2000), (15,16,17) Samsun et al. (Reference Samsun, Samsun, Kalayci and Bilgin2006), (18) Sahin et al. (Reference Şahin, Gözler and Hacımurtazaoğlu2006), (19) Bılgın (Reference Bilgin, Samsun, Samsun and Kalaycı2006), (20) this research.
DISCUSSION
In this study, the sex composition was found to be significantly different from 1:1 which disagreed with the results obtained by Özdamar et al. (Reference Özdamar, Kihara and Erkoyuncu1991); Ünsal (Reference Ünsal1989); Mutlu (1996); Kayalı (Reference Kayalı1998); Mutlu (Reference Mutlu2000) and Samsun et al. (Reference Samsun, Samsun, Kalayci and Bilgin2006). Only Karacam & Duzgunes (Reference Karaçam and Düzgüneş1988) found the abundance of males to be slightly greater than that of females, but that the general ratio in anchovy populations was 1:1 in the 1986/1987 fishing season. The same results were obtained for the following fishing seasons (Duzgunes & Karacam, Reference Düzgüneş and Karaçam1989): from 1990 to 1995 (Genc & Basar, Reference Genç and Başar1991, Reference Genç and Başar1992a, b; Mutlu, Reference Mutlu1994; Özdamar et al., Reference Özdamar, Samsun and Erkoyuncu1995); during the 2000/2001 and 2001/2002 fishing seasons (Samsun et al., Reference Samsun, Samsun, Kalayci and Bilgin2006); and in 2000/2004 (Bilgin, Reference Bilgin, Samsun, Samsun and Kalaycı2006; Sahin et al., Reference Şahin, Gözler and Hacımurtazaoğlu2006). According to the long-term data presented in Table 5, it appears that there is a recent increasing trend in female abundance in the anchovy populations in the Black Sea. The reason for this increase needs further research studies in the region.
The mean length during the fishing season tended to decrease towards the mid-term and then gradually increased through the end of the season. The larger sizes at the beginning of the season were closely related to the migration pattern of anchovy, because the older fish arrived in the area first, followed by the smaller ones. The mean size increased towards the end of the fishing season due to the influx of anchovy schools from Georgian waters, where there is less fishing pressure; these schools mix with the existing stocks in the eastern Black Sea.
Anchovy from the first schools at the beginning of the fishing season consists of bigger and older fish, and are followed up by the younger fish. Therefore, the mean size of fish changing from the beginning to the middle of the fishing season by gradually decreasing, then, is increasing in size due to rapid growth using abundant food in wintering area (Figure 3).
According to the data provided by this and previous surveys, the mean lengths of the samples varied between 8.50 and 11.63 cm (Figure 5). Historically, the mean length was approximately 11.30 cm during the 1985/1986 fishing season, sharply declined to 8.50 cm in 1990/1991, and then gradually increased to 11.63 cm in the 2010/2011 fishing season, although, there are some fluctuations within this period. The increase in the mean length may indicate the recovery of the stocks following the collapse of anchovy fisheries in 1988/1989. Several factors may have contributed to the increase in mean fish length over time. The minimum allowable catch size of anchovy was set at 9 cm in 1989. Surveillance services became more efficient, especially after 2000 (the beginning of the EU harmonization period), and fisherman hesitated to catch undersized fish due to the effective activities of coast guards, who could impose high penalties. However, the use of unselective purse seine nets has continued to affect the sustainable use of anchovy stocks, and undersized anchovies are used as raw material for fish meal and oil plants rather than for human consumption.
Historical studies have reported that there are only four age groups (0 to 3) in the anchovy population in the south-eastern Black Sea. Surveys conducted before the 2004/2005 fishing season indicated that the majority of samples were in the first and second age groups; however, samples in the age group 2 become more abundant in the current study (Table 5). There are reports of 4-year-old anchovies in Ukranian waters (Slastanenko, Reference Slastenenko and Altan1956; Shlyakov, Reference Shlyakov2011). There are no 4-year-old anchovy reported since 1985 on the Black Sea coasts of Turkey.
Table 5 and Figure 6 show that there was a dramatic decline in anchovy production beginning in the 1988/1989–1989/1990 fishing seasons due to over-fishing during this period (Erkoyuncu & Özdamar, Reference Düzgüneş and Karaçam1989; Duzgunes & Karacam, 1990; Özdamar et al., Reference Özdamar, Kihara and Erkoyuncu1991), in addition to the impact of the invasive ctenophore Mnemiopsis leidyi (Kideys, Reference Kideys1994; Gucu, 2002).
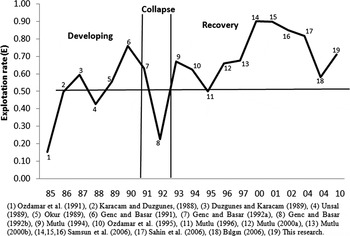
Fig. 6. Exploitation rate of anchovy by year in the south-eastern Black Sea.
The relationship between length and weight in the current survey was W = 0.0011L 2.742, as the fish had negative allometry in previous studies. The value of the regression coefficient was slightly higher in previous studies compared with this study for the fishing seasons from 1985/1986 to 1987/1988, 1990/1991 to 1991/1992, 1993/1994 to 1995/1996, and in 1997/1998 and 2001/2002; positive allometry was observed in these years, while negative allometry was observed in the other fishing seasons (Table 5). These variations indicate the reactions of anchovy populations to the environmental and climatic changes affecting fish growth and food abundance within the habitat.
An examination of previous studies revealed that the maximum L ∞ and W ∞ values, 23.5 cm and 78.69 g, respectively, were observed in the 1989/1990 fishing season by Okur (Reference Okur1989), while the minimum values, 14.14 cm and 20.04 g, were observed in the 1987/1988 season (Duzgunes & Karacam, Reference Düzgüneş and Karaçam1989). Table 5 shows the decreasing trend in growth following the 1986/1987 fishing season through to 1991/1992, which corresponds to the collapse of the anchovy fisheries; subsequently, growth began to increase. The value of ‘k’ (0.425) calculated in this study was lower than the value of 0.92 reported by Duzgunes & Karacam (Reference Düzgüneş and Karaçam1989) for 1987/1988 and the value of 0.61 reported by Genc & Basar (Reference Genç and Başar1991) for 1990/1991 but was higher than the values in all previous surveys (Table 5). The same pattern was observed for the t o comparisons.
The growth performance computed in the present survey was higher than that in the other surveys, except for the values calculated for 1987/1988, 1990/1991 and 1992/1993. The historical values in Table 5 suggest that there was a slow decline in the growth performance of anchovies in recent years due to fishing pressure applied in the survey area.
The CF of the anchovy population in the present survey (0.63) was similar to that of the earlier studies, except for the value calculated by Özdamar et al. (Reference Özdamar, Kihara and Erkoyuncu1991) for the Reference Özdamar, Samsun and Erkoyuncu1995/1996 fishing season (0.724). The CF was greatest at the beginning of the fishing season and then declined towards the end of the season because the food abundance along the Turkish coast was better exploited by the early arriving fish that were larger in size. Energy is stored in fat tissues through the end of the fishing season and the start of the spawning migration.
The survival and mortality rates found in this study are presented in Table 5 together with the results of previous studies for comparison. The survival rate was highest in the 1985/1986 fishing season at 55% (Özdamar et al., 1991). As production increased over the following two fishing seasons, the survival rate decreased to 35% and 25%, respectively (Karacam & Duzgunes, Reference Karaçam and Düzgüneş1988; Duzgunes & Karacam, 1999). The lowest survival rate, 7%, was observed during the 1990/1991 fishing season (Genc & Basar, Reference Genç and Başar1991). In recent years, there was an increasing trend in the survival rate corresponding to the partial recovery of the anchovy population; however, the instantaneous total mortality and fishing mortality rates found in this study were considerably higher than those found in previous surveys. The natural mortality rate was also high in the present study.
The exploitation rate was approximately 0.50, the optimum level, prior to 1990 (Figure 6). The exploitation rate ranged from 0.15 to 0.50 until the 1986/1987 fishing season and then decreased below the optimum level in 1988/1989. Due to the collapse of the fishery in the 1988/1999, technical measures were subsequently taken that increased the exploitation rate above 0.70; however, the rate suddenly decreased to approximately 0.20 in the 1992/1993 fishing season. This trend is similar to the catch trend in the anchovy fishery of Turkey, with a 2-year delay. During the recovery period, the fact that the exploitation rate was greater than the optimum level was very dangerous for the sustainable use of anchovy stocks in the south-eastern Black Sea. The high exploitation rate was a result of the high fishing mortality rate caused by high fishing pressure. To manage anchovy fisheries in a sustainable manner, urgent measures, such as a reduction in purse seine vessels or a decrease in the number of fishing days, could be employed as short- to mid-term management strategies. The exploitation rate should be reduced to levels below 0.60 by reducing fishing efforts and increasing effective monitoring, control and surveillance services to prevent the capture of undersized fish and other illegal fishing activities.


