/ for all Slavic languages. In this paper we revise the affricate inventories of Polish and Czech, showing that the symbol /č/ stands for two different sounds: the palatoalveolar /
 / in Polish. This conclusion is supported by acoustic results for Polish and Czech data. The fact that COG (centre of gravity) values of frication are not significantly different for Polish and Czech /č/ appears a bit surprising especially in light of the fact that COG is generally seen as a parameter contributing to the distinction of fricatives (including sibilants, see e.g. Gordon, Barthmaier & Sands 2002). Our results show that other parameters such as duration of the frication phase, F1 and F2 of the following vowel as well as spectral slopes are more reliable cues for distinguishing the small differences between affricates examined here.
1 Introduction
What is Slavic /č/ in IPA terms? How is it realized in the individual Slavic languages? The answer to these questions should not be controversial, as several, if not all, studies tacitly or explicitly assume that the Slavic affricate /č/ stands for /![]() / in all Slavic languages (see e.g. de Bray Reference Bray1951 or various chapters in Comrie & Corbett Reference Comrie and Corbett1993).
/ in all Slavic languages (see e.g. de Bray Reference Bray1951 or various chapters in Comrie & Corbett Reference Comrie and Corbett1993).
However, /č/ makes a different perceptual impression depending on the language. Thus, for example, replacing the Czech /č/ with the Polish /č/ and vice versa would lead to a striking non-native pronunciation in both languages. Similar observations can be made with respect to other Slavic ‘cross-splicing’ effects with phonemes such as the Lower Sorbian /č/ and the Russian /č/. The aim of this paper is to show that the affricate in question is a different sound in the two selected Slavic languages: Polish and Czech. It will be shown that, in fact, the two sounds differ considerably from each other with respect to selected parameters.
This difference in the realization of affricates is intriguing if one considers the fact that both sounds, Polish /![]() / and Czech /
/ and Czech /![]() /, originate from the same Old Slavic ancestor, /
/, originate from the same Old Slavic ancestor, /![]() /. Thus, the question arises as to why in some Slavic languages /
/. Thus, the question arises as to why in some Slavic languages /![]() / has changed to /
/ has changed to /![]() /, while in others it has remained /
/, while in others it has remained /![]() /. In the present study, it is proposed that the change from /
/. In the present study, it is proposed that the change from /![]() / to /
/ to /![]() /, as in Polish, was not accidental but can be accounted for when perceptual contrast among the affricates in a given system is taken into consideration.
/, as in Polish, was not accidental but can be accounted for when perceptual contrast among the affricates in a given system is taken into consideration.
The paper is organized as follows. In Section 2, we provide results of an acoustic experiment of the two selected Slavic languages, Polish and Czech, which differ in their phonemic inventories, i.e. complex vs. simple coronal affricate systems. In Section 3, we discuss some articulatory aspects of the category ‘retroflex’ as employed for the purposes of the present paper and provide articulatory characteristics of the Polish and Czech /č/. Furthermore, in Section 4, we outline perceptual differences between the sounds. Section 5 provides a link between the articulation and perception of retroflex sounds. In Section 6, we put forward a hypothesis that the differences in Polish and Czech inventories are not accidental but follow from the tendency to optimize perceptual contrast. The main conclusions of the study are summarized in Section 7.
2 Acoustic study
The aim of this section is twofold. First, it will be determined experimentally whether the Slavic affricates in question are indeed palatoalveolars as commonly assumed in the literature.Footnote 1 Second, the affricate in question, /č/, will be compared with other coronal sounds of the same inventory with respect to selected parameters.
We hypothesize that Polish and Czech /č/ are different sounds. In the former case the sound should be denoted as retroflex /![]() /, in the latter as palatoalveolar /
/, in the latter as palatoalveolar /![]() /.
/.
The coronal inventories of the two languages are presented in (1).
(1)


Footnote 2Footnote 3
Polish and Czech have been chosen for the following reasons. First, both languages differ in their affricate inventories: while the Polish sibilant system is deemed complex, the Czech system, with its two sibilant affricates, belongs to the simple systems (see Hall Reference Hall1997a). Furthermore, the place of articulation of Czech /![]() / is by no means clear from the descriptions available in the literature (see Section 3). In a similar vein, the corresponding Polish postalveolar affricate is repeatedly reported to be the palatoalveolar /
/ is by no means clear from the descriptions available in the literature (see Section 3). In a similar vein, the corresponding Polish postalveolar affricate is repeatedly reported to be the palatoalveolar /![]() /, despite its retroflex features; see Sections 3 and 5 below. Finally, the presence of the palatal stop /c/ in Czech on the one hand and of the alveolo-palatal affricate /
/, despite its retroflex features; see Sections 3 and 5 below. Finally, the presence of the palatal stop /c/ in Czech on the one hand and of the alveolo-palatal affricate /![]() / in Polish on the other is important because it enables us to postulate the extent to which the sounds might influence the development of postalveolar affricates in these two languages; see Section 6 below.
/ in Polish on the other is important because it enables us to postulate the extent to which the sounds might influence the development of postalveolar affricates in these two languages; see Section 6 below.
2.1 Experimental design
The material for testing our hypothesis consisted of words containing the consonants listed in (2).
(2)
The consonants appeared in word-initial /_a/ and word-medial /a_a/ positions. The vowel /a/ was chosen in order to avoid palatalization (as in the case of /i/) or rounding effects (as in the case of /u/). The vowel /a/ is a low, central vowel in both languages as shown in acoustic and articulatory studies (e.g. Wierzchowska Reference Wierzchowska1971, Reference Wierzchowska1980 for Polish and Hála Reference Hála1962, Borovičková & Maláč Reference Borovičková and Maláč1967 for Czech). With one exception due to lexicon restrictions, i.e. the Czech word -t'at-, all words were bisyllabic with stress falling on the first syllable; see tables in Appendix A. It should be noted that two Polish speakers produced braci ‘brothers, gen’ and not bracia ‘brothers, nom’. The words were embedded in the following carrier sentences:
(3)

The carrier sentences have the same number of syllables in both languages, i.e. three syllables before the item under investigation and three syllables after it. Ten repetitions of each sentence were randomized and presented in an orthographical form to the speakers; see Appendix A.
Four native speakers of Czech (two females, LS and MK, and two males, NN and KC, aged from 22 to 28 years) and four native speakers of Polish (two females, MN and MZ, and two males, JK and PW, aged from 23 to 43 years) took part in the experiment. All speakers were monolingual and spoke a standard version of their native language. The informants were asked to read the sentences aloud at a normal speech rate. All recordings were conducted in a soundproof lab at the Zentrum für Allgemeine Sprachwissenschaft in Berlin using a Sennheiser MKH20 P48 microphone located 10 cm in front of the mouth. The recordings were made to a DAT-recorder at a sample rate of 22050 Hz; for the formant analysis they were down-sampled to 11025 Hz. The items were further analysed with Praat version 5.2 (Boersma & Weenink Reference Boersma and Weenink2011) and MATLAB version R2007b.
For the purposes of the present study, six places in the spectrogram of the signal were determined by placing the cursor at the following points:
(4) Marking points
Point 1: The beginning of the vowel preceding the consonant (V1).
Point 2: The end of the vowel preceding the consonant (V1).
Point 3: The beginning of the burst.
Point 4: The end of the burst.
Point 5: The beginning of the vowel following the consonant (V2).
Point 6: The end of the vowel following the consonant (V2).
All six places in (4) are exemplified in the oscillogram and spectrogram of Polish [bra![]() a] ‘brothers’ in Figure 1.
a] ‘brothers’ in Figure 1.

Figure 1 The oscillogram and spectrogram of Polish [bra![]() a].
a].
In order to test our hypothesis, the following acoustic parameters were investigated:
(5) Parameters
(i) The closure and frication duration.
(ii) The formant frequencies F1, F2, and F3 of the vowels preceding and following the consonant (endpoint frequencies).
(iii) The formant frequency range of F1, F2, and F3 of the vowels preceding and following the consonant.
(iv) The highest spectral peak frequency of the burst and the following frication.
(v) Slopes of regression lines (spectral fit) m1 and m2 for both burst and following frication.
(vi) Spectral moments as proposed by Forrest et al. (Reference Forrest, Weismer, Milenkovic and Dougall1988) for both burst and frication: M1 (mean), M2 (variance), M3 (skewness), and M4 (kurtosis).
(vii) Centre of gravity (COG), standard deviation, skewness, and kurtosis for both burst and frication based on the formulae given in PRAAT version 5.2 (Boersma & Weenink Reference Boersma and Weenink2011).
Regarding (5i): The closure was measured from point 2 to point 3, the burst from 3 to 4 and the frication from 4 to 5. Due to measurement limitations of the stop phase in the consonants in the word-initial position, the closure was measured only for word-medial consonants. If the starting point of the closure did not coincide with the offset of the formants of the vowel, an additional point was set at the end of voicing. This point was then considered as the starting point of the closure.
Regarding (5ii): The formant frequencies F1, F2, and F3 were measured at the onset and offset of vowels, i.e. at point 1, 2, 5, and 6. The offset was defined as the end of the stable formant structure. The formants of the vowel segments were measured semi-automatically by means of Linear Predictive Coding (LPC). Prior to formant analysis (and only for the formant analysis) the audio signals were down-sampled to 11025 Hz (to only allow for formant peak picking in the first five formants up to 5500 kHz). The LPC was calculated by using the following parameters: pre-emphasis frequency 50 Hz, analysis window duration 0.0256 s, time step 0.001 s and a prediction order of 13. Maximally five peaks from the LPC spectrum derived by peak picking were considered as formant candidates. As in some cases a certain formant value could not be detected by the peak-picking algorithm, for every spectrum the three formant candidate values were checked and manually corrected if necessary in order to determine the correct formant values.
Regarding (5iii): The frequency ranges of the F1, F2, and F3 were computed for (a) the preceding vowel by subtracting the frequency values at the formant transition offset (point 2) from those obtained at the midpoint of the vowel, and (b) the following vowel by subtracting the frequency values at the formant transition onset (point 5) from those obtained at the midpoint of the vowel (the midpoint of the vowel was calculated as the equal temporal distance between the onset and offset of the vowel).
When the formant frequency values obtained were positive, the formant toward the consonant was considered to be rising and in the case of the vowel following the consonant, the formant was considered to be falling. This is schematically shown in Figure 2. When the values were negative, the formant of the preceding vowel was falling and the formant of the following vowel was rising.

Figure 2 Schematic representation of raising and falling formant frequency values.
Regarding (5iv)–(5vii): All spectral values were calculated by computing multitaper spectra (see below for an explanation of the multitaper method) with a 23 ms window for the frication noise midpoint (512 point Hamming window) or a 11.5 ms window for the burst landmark (256 point Hamming window). The windows were left aligned to the beginning timepoint of the burst (only the burst was completely included in the time window and the following frication noise was excluded) or the acoustic midpoint between the end of the burst and the beginning of the following vowel (points 4 and 5). The power spectral density (PSD) was estimated via the Thomson multitaper method (linear combination with unity weights of individual spectral estimates and the default FFT (Fast Fourier Transform) length) available in the MathWorks Signal Processing Toolbox Version 6.2 (MathWorks Reference MathWorks2007: 470–475).
Regarding (5iv): The highest spectral peak was computed in the frequency range from 1000 Hz to 11025 Hz. We excluded the low-frequency region up to 1 kHz since we were primarily interested in the front cavity resonances, which occur between 2000 Hz and 8000 Hz for the fricative part of the signals (see Jesus & Shadle Reference Jesus and Shadle2002 for further explanation).
Regarding (5v): The regression lines were computed between the spectral limits (i.e. between 500 Hz and 11025 Hz) and the average spectral peak frequency (F), separately estimated for all recorded Polish and Czech items for burst and frication noise (thus four measures of F).Footnote 4 The frequency F is the mean of all highest spectral peaks per language (Czech, Polish) and landmark (burst or frication noise), rounded to the nearest kHz. In Jesus & Shadle (Reference Jesus and Shadle2002) and Lousada, Jesus & Pape (Reference Lousada, Jesus and Pape2012), it was shown that this computation of F and its rounding adapts well to find the endpoint between the two parts of the spectra (low part from 500 Hz to F and high part from F to the Nyquist frequency; see Jesus & Shadle Reference Jesus and Shadle2002: 447 for further information). In Jesus & Shadle (Reference Jesus and Shadle2002: 447), a value of 4000 Hz was found for postalveolar fricatives of European Portuguese, and in Lousada et al. (Reference Lousada, Jesus and Pape2012: 10) a value of 3900 Hz was found for the burst of dental stops. However, in order to apply this measure to our data, we had to adapt it to our Polish and Czech data, assuming (and thus simplifying) that the place of articulation is more or less consistent for corresponding phonemes. In our case we found an F value of 3000 Hz for both Czech and Polish. This value was identical for both burst and frication noise.
Thus, m1 is the slope of the spectral regression line for the frequency range between 500 Hz and 3000 Hz, and m2 is the slope of the spectral regression line for the range between 3000 Hz and 11025 kHz. The values m1 and m2 were separately computed for the burst and the frication noise. Figure 3 shows an example of 10 different spectra from one speaker, the overlaid mean spectrum and the computation of the regression lines m1 and m2, with the endpoint/startpoint F.

Figure 3 Multitaper spectra and regression lines used to calculate the low-frequency slope (m1) and high-frequency slope (m2), with the split point at the mean frequency (F).
Regarding (5vi): According to Forrest et al. (Reference Forrest, Weismer, Milenkovic and Dougall1988), the power spectrum of a fricative can be seen as a normal statistical distribution, from which the computation of the four spectral moments can help to distinguish between different fricatives or places of articulation. Lousada et al. (Reference Lousada, Jesus and Pape2012) used the four moments to distinguish between different stops and places of articulation in burst spectra. For the frequency range from 0 Hz to 11025 Hz, we computed the four moments M1 (mean), M2 (variance), M3 (skewness), and M4 (kurtosis) for the multitaper spectra for both burst and frication noise.
Regarding (5vii): For the frequency range from 0 Hz to 11025 Hz, we computed four spectral parameters available from Praat version 5.2 (Boersma & Weenink Reference Boersma and Weenink2011): centre of gravity (COG), standard deviation of the spectrum, skewness, and kurtosis of the spectrum for both burst and frication noise. It should be noted that the standard deviation, skewness, and kurtosis differ from the values in (5vi) due to different weighting and normalization techniques.
The motivation for using multitaper spectra was the following. The existing large variance in fricative parts of the speech signal normally requires a massive variance reduction, but if possible without losing the distinctive properties of the examined phoneme. However, in order for most variance reduction methods to work, they require certain assumptions to be met with respect to the speech signal in question, primarily that the signal is regarded as stationary and ergodic, i.e. the statistical properties of the process are independent of the sample sequence. However, fricative parts of the speech signal are neither stationary nor ergodic (Blacklock Reference Blacklock2004, Lousada et al. Reference Lousada, Jesus and Pape2012), which limits the use of most methods: ensemble-averaging techniques can only be used if the signal is ergodic; time-averaging over the phoneme duration assumes the signal to be stationary and thus not changing from onset to offset, which clearly does not happen during speech production, where articulators are constantly on the move from one phoneme to the other.
Therefore, both time-averaging and ensemble-averaging techniques cannot be used for short – and thus non-stationary – periods of a given burst signal. This leaves out the standard frequency smoothing techniques to reduce the variability. These algorithms use standard windowing techniques to smooth the spectra. As a result, the windows invariably lose important data towards the edges (due to the necessary sidelobe suppression), which in turn leads to an undesirable increase in the variance of the spectral estimate (Blacklock Reference Blacklock2004, Lousada et al. Reference Lousada, Jesus and Pape2012).
The problem of losing data at the window edges is solved by the multitaper technique (Blacklock Reference Blacklock2004, Lousada et al. Reference Lousada, Jesus and Pape2012), which applies consecutive orthogonal windows (Slepian tapers: prolate speroidal windows), i.e. the second window is set orthogonally to the first window and so on. This technique guarantees that data are not lost towards the ends of each window. At the end of the process, the resulting smoothed spectrum is obtained by summing all orthogonal estimates. This spectrum exhibits highly reduced variance, which is no longer dependent on the underlying spectral magnitude. Thus, in contrast to standard spectral estimation techniques, multitaper analysis provides an optimal way to reduce the bias of the spectral estimates when calculated over only short intervals of the data, and is thus highly suited to examining stochastic parts of the speech signal (see Blacklock Reference Blacklock2004 for further explanations). Thus, the multitaper method – an accurate analysis of a single short time window only – is well suited for the characteristics of the short fricative portion of affricates and the burst part of the signals.
For each multitaper spectrum, we computed two sets of established spectral parameters. It should be noted that with the aim of increasing accuracy and spectral information we calculated all spectral parameters for the fricative and burst spectra on the more accurate multitaper spectra and not (as traditionally done) on the error-prone FFT or LPC spectra.
For the first set of spectral parameters (see (5vi) above), we computed the moments according to Forrest et al. (Reference Forrest, Weismer, Milenkovic and Dougall1988), who propose looking at the fricative spectrum as a standard statistical distribution and thus calculate the first four moments for parameterization of the spectra. The first moment is regarded as the mean, the second moment is the variance, and the third and fourth moments are the skewness and kurtosis, respectively.
For the second set of spectral parameters (see (5vii)), we computed the normalized moments centre of gravity (COG), standard deviation (SD), skewness, and kurtosis using the formulae given in PRAAT version 5.2 (Boersma & Weenink Reference Boersma and Weenink2011). These measures are widely used in the literature on spectral properties of speech signals, so we calculate these values to allow for comparison with other studies. The centre of gravity is the pairwise weighting of the spectral amplitude with the frequency, thus indicating the average central frequencies for the complete spectrum. The standard deviation (SD) indicates the spreading around the centre of gravity. Skewness shows if the spectrum is skewed towards lower or higher frequencies, while the kurtosis can be seen as a measure of the spectral peakedness or deviance from a normal distribution.
The statistical analyses were conducted in the R environment (R Development Core Team 2010). Linear mixed effects models were employed for the investigated variables (closure duration, frication duration, F1, F2, F3 of the preceding and following vowel, F1, F2 and F3 range of the preceding and following vowel, spectral slopes m1 and m2 of the burst and frication, COG, standard deviation, skewness and kurtosis of the burst and frication, as well as M1, M2, M3, M4 of the burst and frication) which were studied as effects of Language {Czech, Polish}, Phoneme {t, c/![]() , č,
, č, ![]() } and Position {word-initial, word-medial}. Whereas Language, Phoneme and Position were considered fixed effects, Speaker was included as a random effect. Besides t-values for fixed effect, the output also includes a p-value based on Markov chain Monte Carlo sampling (pMCMC), which is a possible alternative to p-value in mixed model effects (Baayen Reference Baayen2008: 248).
} and Position {word-initial, word-medial}. Whereas Language, Phoneme and Position were considered fixed effects, Speaker was included as a random effect. Besides t-values for fixed effect, the output also includes a p-value based on Markov chain Monte Carlo sampling (pMCMC), which is a possible alternative to p-value in mixed model effects (Baayen Reference Baayen2008: 248).
All mean values and their standard deviation are provided in Appendix B. Appendix C includes t- and pMCMC-values which pertain to comparisons between /č/ and other phonemes within a given language as well as comparisons of the values of Czech and Polish /č/ (i) independent of the position and (ii) split for the word-initial and word-medial position.
2.2 Results
In the following, we present selected results of the examined phonemes for each parameter. The order of the presentation is in accordance with the parameters listed in (5). The discussion of the results will be limited to the most relevant findings regarding the purposes of the present study.
2.2.1 Parameter (i): The duration of the closure and of the frication phase
Figures 4 and 5 show the log transformed duration values of the closure and frication phases obtained for Czech and Polish consonants in the word-medial position. We log transformed the duration data because the distribution was skewed and log-transformed data are more resistant to outliers. (Obviously, the word-initial position could not be considered for this measurement due to the impossibility of segmenting the exact beginning of the closure phase.)

Figure 4 Average duration of closure phase in Czech and Polish consonants.

Figure 5 Average duration of frication phase in Czech and Polish consonants.
The results show a clear difference between the Czech and Polish /č/. While the duration of the closure is significantly shorter for Czech /č/ than for Polish /č/ (log values: 4.14 vs. 4.34, t = −2.39, pMCMC = .0168), the frication is significantly longer for Czech /č/ than for Polish /č/ (log values: 4.44 vs. 3.93, t = 3.89, pMCMC = .0002). Importantly, the frication in the Czech /č/ is longer than its closure (4.14 vs. 4.44), whereas the opposite scenario is found in the corresponding Polish sound: the closure is longer than the frication (4.34 vs. 3.93). This is illustrated in Figure 6. The difference between closure and frication duration is highly significant in both languages (Czech /č/: t = −7.22, pMCMC = .0001; Polish /č/: t = 9.61, pMCMC = .0001).

Figure 6 Average duration of closure and frication phase in Czech and Polish /č/.
Potentially, it could be argued that the Polish /č/ behaves more similarly to a stop, where the closure is typically longer than the frication, and it less resembles an affricate, as e.g. Czech /![]() / and /č/.Footnote 5 However, it has been shown that such a characteristic is also typical of retroflex sounds occurring in other languages: the shorter duration of frication in comparison to closure duration has been noted for Serbian retroflex affricates (Miller-Ockhuizen & Zec Reference Miller-Ockhuizen, Zec, Solé, Recasens and Romero2003) and Komi-Permyak retroflex affricates (Kochetov & Lobanova Reference Kochetov and Lobanova2007). The results presumably point to an important articulatory difference between the postalveolar affricates. The Czech affricate /č/ is articulated with the tongue blade, while the corresponding Polish sound is articulated with the tongue tip, as is typical for retroflex sounds.
/ and /č/.Footnote 5 However, it has been shown that such a characteristic is also typical of retroflex sounds occurring in other languages: the shorter duration of frication in comparison to closure duration has been noted for Serbian retroflex affricates (Miller-Ockhuizen & Zec Reference Miller-Ockhuizen, Zec, Solé, Recasens and Romero2003) and Komi-Permyak retroflex affricates (Kochetov & Lobanova Reference Kochetov and Lobanova2007). The results presumably point to an important articulatory difference between the postalveolar affricates. The Czech affricate /č/ is articulated with the tongue blade, while the corresponding Polish sound is articulated with the tongue tip, as is typical for retroflex sounds.
The results presented in Figures 4 and 5 point to another difference between the Czech and Polish affricate inventory which is probably crucial for explaining the differences between the languages. The Czech coronal inventory includes two affricates, /![]() / and /
/ and /![]() /, which (i) both show longer frication than closure (/
/, which (i) both show longer frication than closure (/![]() /: closure 4.04 vs. frication 4.43, t = −9.33, pMCMC = .0001; /
/: closure 4.04 vs. frication 4.43, t = −9.33, pMCMC = .0001; /![]() /: closure 4.14 vs. frication 4.44, t = −7.22, pMCMC = .0001), and (ii) do not differ significantly with respect to frication duration (/
/: closure 4.14 vs. frication 4.44, t = −7.22, pMCMC = .0001), and (ii) do not differ significantly with respect to frication duration (/![]() / 4.43 vs. /
/ 4.43 vs. /![]() / 4.44) but only with respect to closure duration which is shorter for /
/ 4.44) but only with respect to closure duration which is shorter for /![]() / than for /
/ than for /![]() / (/
/ (/![]() / 4.04 vs. /
/ 4.04 vs. /![]() / 4.14, t = −2.63, pMCMC = .0114). Yet the Polish inventory is more complex as it consists of three affricates, /
/ 4.14, t = −2.63, pMCMC = .0114). Yet the Polish inventory is more complex as it consists of three affricates, /![]() /, /
/, /![]() / and /
/ and /![]() /. In contrast to the Czech affricates, (i) the relation between closure and frication in Polish differs depending on the sound: whereas in /
/. In contrast to the Czech affricates, (i) the relation between closure and frication in Polish differs depending on the sound: whereas in /![]() / and /
/ and /![]() / the closure is shorter than the frication (/
/ the closure is shorter than the frication (/![]() /: closure 3.94 vs. frication 4.25, t = −11.95, pMCMC = .0001; /
/: closure 3.94 vs. frication 4.25, t = −11.95, pMCMC = .0001; /![]() /: closure 4.26 vs. frication 4.41, t = −3.45, pMCMC = .001) in /
/: closure 4.26 vs. frication 4.41, t = −3.45, pMCMC = .001) in /![]() / the closure is longer than the frication (closure 4.34 vs. frication 3.93, t = 9.61, pMCMC = .0001). Furthermore, a comparison of the closure and frication duration among the Polish affricates reveals that the closure is shorter in /
/ the closure is longer than the frication (closure 4.34 vs. frication 3.93, t = 9.61, pMCMC = .0001). Furthermore, a comparison of the closure and frication duration among the Polish affricates reveals that the closure is shorter in /![]() / (3.94) than in /
/ (3.94) than in /![]() / (4.26) and /
/ (4.26) and /![]() / (4.34) (/
/ (4.34) (/![]() / vs. /
/ vs. /![]() /: t = −11.52, pMCMC = .0001) and the frication is shorter in /
/: t = −11.52, pMCMC = .0001) and the frication is shorter in /![]() / (3.93) than in /
/ (3.93) than in /![]() / (4.41) (/
/ (4.41) (/![]() / vs. /
/ vs. /![]() /: t = 14.56, pMCMC = .0001) and /
/: t = 14.56, pMCMC = .0001) and /![]() / (4.25) (/
/ (4.25) (/![]() / vs. /
/ vs. /![]() /: t = 15.76, pMCMC = .0001). Such differences presumably allow a better perceptual contrast between the affricates of a complex system to be maintained (see Section 6 below for a perceptually-based hypothesis on Polish sibilants).
/: t = 15.76, pMCMC = .0001). Such differences presumably allow a better perceptual contrast between the affricates of a complex system to be maintained (see Section 6 below for a perceptually-based hypothesis on Polish sibilants).
2.2.2 Parameter (ii): The formant frequencies F1, F2, and F3 of the vowels preceding and following the consonant
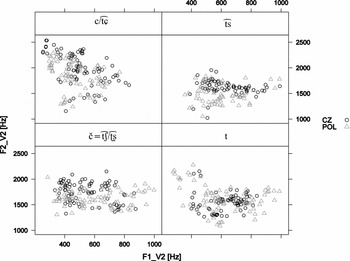
Figure 7 presents the results of F1 and F2 of a vowel following a given consonant (measured at point 5) for Czech and Polish.

Figure 7 F1 and F2 frequencies of the following vowel in Czech and Polish.
As far as /č/ is concerned, a comparison of the formant frequencies of the following vowel reveals differences especially in F1 and F2: F1 frequency of the following vowel is higher in Polish (677 Hz) than in Czech (453 Hz), but the reverse situation is found with respect to F2, which is higher in Czech (1751 Hz) than in Polish (1606 Hz). Statistically, both differences are significant: for F1 of Czech vs. Polish /č/: t = −3.612, pMCMC = .0001; and for F2, t = 1.298, pMCMC = .0444. The differences in F3 frequency between the two sounds appear to be insignificant. If we compare Polish /č/ to other sounds which are inherently palatalized, such as Czech /c/ or Polish /![]() /, then, as expected, the F2 frequency (1606 Hz) is significantly lower in comparison to the palatal /c/ (2096 Hz, t = −3.922, pMCMC = .0001) and alveolo-palatal /
/, then, as expected, the F2 frequency (1606 Hz) is significantly lower in comparison to the palatal /c/ (2096 Hz, t = −3.922, pMCMC = .0001) and alveolo-palatal /![]() / (1938 Hz, t = −19.65, pMCMC = .0001). Furthermore, the F2 frequency of Czech /č/ (1751 Hz) is lower than the F2 frequency of /
/ (1938 Hz, t = −19.65, pMCMC = .0001). Furthermore, the F2 frequency of Czech /č/ (1751 Hz) is lower than the F2 frequency of /![]() / (1938 Hz, t = −1.571, pMCMC = .0016). Regarding the F1 frequency of Polish /č/ (677 Hz), a significant difference was found when compared to /
/ (1938 Hz, t = −1.571, pMCMC = .0016). Regarding the F1 frequency of Polish /č/ (677 Hz), a significant difference was found when compared to /![]() / (543 Hz, t = 9.221, pMCMC = .0001) and /c/ (383 Hz, t = 4.766, pMCMC = .0001). Finally, Polish /č/ and
/ (543 Hz, t = 9.221, pMCMC = .0001) and /c/ (383 Hz, t = 4.766, pMCMC = .0001). Finally, Polish /č/ and ![]() do not show a significant difference with respect to F1. Finally, Polish /č/ and /
do not show a significant difference with respect to F1. Finally, Polish /č/ and /![]() / do not show a significant difference with respect to F1.
/ do not show a significant difference with respect to F1.
Figure 8 presents F1 and F2 frequencies of the preceding vowel at the word-medial position in both languages.

Figure 8 F1 and F2 of the preceding vowel in Czech and Polish.
The results show that the F1 frequency of the preceding vowel is higher in Polish (666 Hz) than in Czech (510 Hz) and the difference is significant (t = 2.643, pMCMC = .005). (Please note that the t-values might differ in terms of <+> or <−> from the corresponding t-values provided in Appendix C depending on the order of comparison, e.g. F1 of Polish /a/ vs. Czech /a/: t = 2.643, but F1 of Czech /a/ vs. Polish /a/: t = −2.643.) Whereas F2 does not show significant differences in the two languages, F3 appears to be lower in Czech than in Polish /č/ (2610 Hz vs. 2809 Hz, t = −1.288, pMCMC = .0076).
Regarding F1 frequency, Polish /č/ (666 Hz), but not Czech /č/, significantly differs from /c/ (516 Hz, t = 2.874, pMCMC = .0048) and /![]() / (568 Hz, t = 5.332, pMCMC = .0001). With respect to F2 frequency, Polish /č/ (1645 Hz) shows significantly lower values in comparison to /
/ (568 Hz, t = 5.332, pMCMC = .0001). With respect to F2 frequency, Polish /č/ (1645 Hz) shows significantly lower values in comparison to /![]() / (1793 Hz, t = −6.041, pMCMC = .0001) and /c/ (1789 Hz, t = −1.074, pMCMC = .0368). F2 frequency of Czech /č/ (1718 Hz) is lower than F2 of /c/ (1789 Hz, t = −3.233, pMCMC = .0012) but does not differ with respect to /
/ (1793 Hz, t = −6.041, pMCMC = .0001) and /c/ (1789 Hz, t = −1.074, pMCMC = .0368). F2 frequency of Czech /č/ (1718 Hz) is lower than F2 of /c/ (1789 Hz, t = −3.233, pMCMC = .0012) but does not differ with respect to /![]() /.
/.
2.2.3 Parameter (iii): The formant frequency range of F1, F2, and F3 of the vowels preceding and following the consonant
As far as the frequency range of the formants is concerned, the main points of interest are the first three formants of vowels which precede and follow the consonant under consideration. While F1 and F2 generally characterize the vertical and the horizontal position of the tongue, F3 is especially important for proving the possible retroflexion of the Polish postalveolar sound in question. If the F1 frequency is rising and the F2 frequency of the following vowel is falling, then this indicates the transition from the palatal position characteristic of palatalized segments or palatals, which are produced with the tongue blade or tongue dorsum (see e.g. Ladefoged & Maddieson Reference Ladefoged and Maddieson1996: 364). We expect such results in the case of Czech /č/, but not in the case of the corresponding Polish sound.
The retroflex character of a sound can also be substantiated by looking at F3 transitions. It has been found that retroflexes show an F3 frequency lowering from the vowel to the consonant and an F3 frequency rising from the consonant to the vowel due to the more posterior (but still coronal) place of articulation; see, for example, Stevens & Blumstein (Reference Stevens and Blumstein1975) and Hamilton (Reference Hamilton1996).
Regarding formants of the following vowel, the greatest difference between Czech and Polish /č/ is found with respect to the F2 frequency range of the following vowel which is falling in Czech but not in Polish (236 Hz vs. 96 Hz). The difference, however, remains at the level of a statistical tendency (t = 2.209, pMCMC = .0556). The F1 requency rises slightly in both languages (Czech −161 Hz vs. Polish −100 Hz) and F3 shows a falling effect (Czech 77 Hz vs. Polish 124 Hz), but these differences are not statistically significant.Footnote 6
As expected, Czech /č/ does not show any significant effects in comparison to /c/ and /![]() /, regarding neither F1 nor F2 frequency range. In contrast, the F1 frequency range of Polish /č/ (−100 Hz) is significantly higher than that of /
/, regarding neither F1 nor F2 frequency range. In contrast, the F1 frequency range of Polish /č/ (−100 Hz) is significantly higher than that of /![]() / (−158 Hz, t = 3.572, pMCMC = .0004) and the F2 frequency range of Polish /č/ (96 Hz) is significantly lower than that of /
/ (−158 Hz, t = 3.572, pMCMC = .0004) and the F2 frequency range of Polish /č/ (96 Hz) is significantly lower than that of /![]() / (340 Hz, t = −6.174, pMCMC = .0001) and /c/ (247 Hz, t = −3.322, pMCMC = .0118). Finally, Polish /č/ shows significantly lower F3 frequency range values (124 Hz) than /
/ (340 Hz, t = −6.174, pMCMC = .0001) and /c/ (247 Hz, t = −3.322, pMCMC = .0118). Finally, Polish /č/ shows significantly lower F3 frequency range values (124 Hz) than /![]() / does (179 Hz, t = −2.113, pMCMC = .0286). In comparison to /c/ (318 Hz) and /
/ does (179 Hz, t = −2.113, pMCMC = .0286). In comparison to /c/ (318 Hz) and /![]() /, Czech /č/ (77 Hz) does not show significant differences.
/, Czech /č/ (77 Hz) does not show significant differences.
As far as the formant frequency range of the preceding vowel is concerned, the F1 frequency is falling in both languages (Czech −164 Hz vs. Polish −177 Hz), while F2 and F3 are rising in both languages (F2 range: Czech 356 Hz vs. Polish 290 Hz; F3 range: Czech 268 Hz vs. Polish 308 Hz); the differences are not, however, significant. Therefore, we conclude that the formant frequency ranges of the preceding vowel do not contribute to the acoustic difference between Czech and Polish /č/.
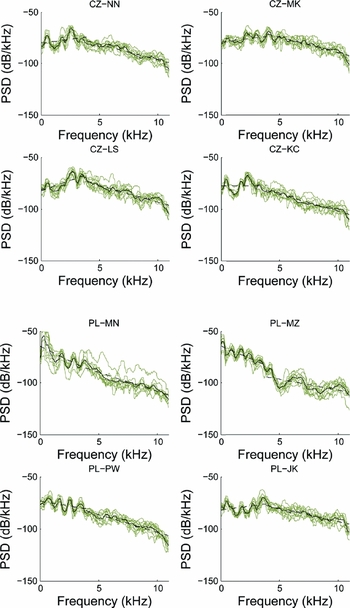
Spectral properties. Before presenting the results of individual spectral parameters in the following sections, we will provide in this passage a comparison of the multitaper spectra of Polish and Czech /č/. The spectra are obtained at the frication noise of /č/ occurring in the same word, časy (Cz.) and czasy (Pol.) ‘times’.
The multitaper spectra for the nine repetitions at the frication noise for each speaker are presented in Figure 9, with the mean spectrum overlaid. As can be seen in Figure 9, the frequency of the highest spectral peak does not seem to differ between the two languages. In contrast, with an endpoint at the highest spectral peak, it can be observed that the spectra for Czech are rising up to the highest spectral peak (reflected in the m1 value), while there is nearly no rise (or there is even a negative slope) for the Polish spectra. For the higher frequencies, there is no m2 difference to be noted between the two languages. When comparing the speaker differences for each language, it is apparent that the Polish speaker MZ shows a strong difference in spectral shape as compared to all other speakers. The reasons for the different spectral behaviour of this speaker are not clear. We compared this speaker's glottal parameters (e.g. Harmonics-to-Noise Ratio HNR) to the other speakers but could not find a difference which would justify the discrepancy.

Figure 9 Multitaper spectra for all repetitions (grey) for Czech (upper half) and Polish (lower half) and the resulting averaged spectrum (overlaid in black). Each panel represents one speaker. The black dashed lines represent the linear line fits from 500 Hz to F and from F to the Nyquist frequency.
Following this exploratory spectral comparison of the Czech and Polish /č/, we will now discuss in detail the spectral characteristics of both burst and frication noise.
2.2.4 Parameter (iv): The highest spectral peak frequency of the burst and the following frication
While the mean of the burst highest peak frequency in Czech /č/ is found at 3448 Hz, it appears at 3064 Hz in the corresponding Polish sound. The highest peak frequency of /č/ frication amounts to 3107 Hz in Czech /č/ and to 3252 Hz in Polish /č/. Neither the difference in the highest peak frequency found for the burst nor for the frication part is significant.
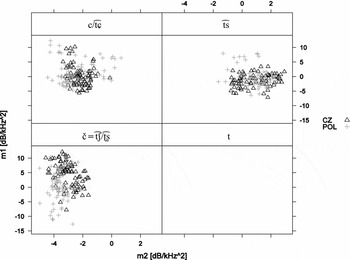
2.2.5 Parameter (v): Slopes of the regression lines (spectral fit) m1 and m2 of the burst and following frication noise
In Figure 10, the values of the first regression line slope (m1) as compared to the second regression line slope (m2) are plotted for the burst of the Polish and Czech consonants. In Figure 11, the m1 and m2 values are plotted for the frication of the same consonants. The endpoint between m1 and m2 is 3000 Hz. Note also that there is no frication for /t/ presented since the phoneme is a stop which does not show frication.

Figure 10 The regression line slopes (m1 and m2) of the burst spectra of Czech and Polish consonants.

Figure 11 The regression line slopes (m1 and m2) of the frication spectra of Czech and Polish consonants.
The slopes of the regression lines of both burst and frication spectra appear to be very useful in differentiating Polish and Czech /č/. The first regression line slope (m1) of the burst of Polish /č/ (2.11 dB/kHz2) is significantly higher than in Czech /č/ (−0.27 dB/kHz2, t = 2.713, pMCMC = .0188). Furthermore, m2 of the burst spectrum is significantly higher in Czech (−2.86 dB/kHz2) than in Polish /č/ (−4.69 dB/kHz2, t = 3.410, pMCMC = .0022).
As far as m1 of the frication noise is concerned, it is higher in Czech (6.84 dB/kHz2) than in Polish /č/ (0.43 dB/kHz2, t = 7.471, pMCMC = .0001). Finally, m2 of frication noise amounts to −3.02 dB/kHz2 in Czech and to −3.52 dB/kHz2 in Polish; the difference is not significant.
In sum, the spectral slopes m1 and m2 of the burst of the Polish sound /č/ were significantly steeper than the corresponding Czech spectral slopes. For the frication noise, the same effect can be observed for m2 (although not significant), but there is an opposite trend for m1 (the Czech rise is significantly steeper than the Polish rise in the spectra).
The m1 of the burst also appears to be important for distinguishing among the spectra of other sounds. The m1 of the burst of Polish /č/ shows the steepest rise in comparison to other palatal/palatalized sounds, and the differences are highly significant: /č/ (2.11 dB/kHz2) vs. /![]() / (−0.9 dB/kHz2) t = 7.033, pMCMC = .0001; and /č/ (2.11 dB/kHz2) vs. /c/ (−3.16 dB/kHz2) t = 2.795, pMCMC = .0012). In the same vein, m2 of the burst of Polish /č/ significantly differs from /
/ (−0.9 dB/kHz2) t = 7.033, pMCMC = .0001; and /č/ (2.11 dB/kHz2) vs. /c/ (−3.16 dB/kHz2) t = 2.795, pMCMC = .0012). In the same vein, m2 of the burst of Polish /č/ significantly differs from /![]() / (/č/ −4.69 dB/kHz2 vs. /
/ (/č/ −4.69 dB/kHz2 vs. /![]() / −3.15 dB/kHz2, t = −7.765, pMCMC = .0001) and /c/ (/č/ −4.69 dB/kHz2 vs. /c/ −1.4 dB/kHz2, t = −5.223, pMCMC = .0001). Furthermore, m1 of the frication of Polish /č/ is different from that of /
/ −3.15 dB/kHz2, t = −7.765, pMCMC = .0001) and /c/ (/č/ −4.69 dB/kHz2 vs. /c/ −1.4 dB/kHz2, t = −5.223, pMCMC = .0001). Furthermore, m1 of the frication of Polish /č/ is different from that of /![]() / (/č/ 0.43 dB/kHz2 vs. /
/ (/č/ 0.43 dB/kHz2 vs. /![]() / 4.8 dB/kHz2, t = −11.31, pMCMC = .0001) but not from /c/ (−0.85 dB/kHz2). Finally, m2 of the frication of Polish /č/ is significantly different from m2 of both /
/ 4.8 dB/kHz2, t = −11.31, pMCMC = .0001) but not from /c/ (−0.85 dB/kHz2). Finally, m2 of the frication of Polish /č/ is significantly different from m2 of both /![]() / (/č/ −3.52 dB/kHz2 vs. /
/ (/č/ −3.52 dB/kHz2 vs. /![]() / −2.39 dB/kHz2, t = −10.035, pMCMC = .0001) and /c/ (−2.21 dB/kHz2, t = −5.105, pMCMC = .0001).
/ −2.39 dB/kHz2, t = −10.035, pMCMC = .0001) and /c/ (−2.21 dB/kHz2, t = −5.105, pMCMC = .0001).
2.2.6 Parameter (vi): Spectral moments as proposed by Forrest et al. (Reference Forrest, Weismer, Milenkovic and Dougall1988) for burst and frication
Following Forrest et al. (Reference Forrest, Weismer, Milenkovic and Dougall1988) the first and the second spectral moments are plotted for the burst in Figure 12 and for the frication noise in Figure 13.

Figure 12 The first (M1) and second (M2) spectral moments of the burst spectra of Czech and Polish consonants following Forrest et al. (Reference Forrest, Weismer, Milenkovic and Dougall1988).

Figure 13 The first (M1) and second (M2) spectral moments of the frication spectra of Czech and Polish consonants following Forrest et al. (Reference Forrest, Weismer, Milenkovic and Dougall1988).
The burst spectra of Polish and Czech /č/ do not significantly differ with respect to the first moment M1 (Polish /č/ 9.31 kHz vs. Czech /č/ 9.35 kHz), but they show a significant effect with respect to the second moment M2 (Polish /č/ 1.12 kHz vs. Czech /č/ 0.86 kHz, t = 3.247, pMCMC = .004). The fricative spectra are not significantly different with respect to M1 (Polish /č/ 9.49 kHz vs. Czech /č/ 9.25 kHz), but they do differ with respect to M2 (Polish /č/ 0.75 kHz vs. Czech /č/ 0.61 kHz, t = 2.962, pMCMC = .0182).
Furthermore, Polish /č/ is significantly different from /![]() / (/č/ 9.31 kHz vs. /
/ (/č/ 9.31 kHz vs. /![]() / 10.87 kHz, t = −7.07, pMCMC = .0001) regarding M1 of the burst spectrum as well as from the same sound /
/ 10.87 kHz, t = −7.07, pMCMC = .0001) regarding M1 of the burst spectrum as well as from the same sound /![]() / (/č/ 1.12 kHz vs. /
/ (/č/ 1.12 kHz vs. /![]() / 0.71 kHz, t = 11.918, pMCMC = .0001) and /c/ (/č/ 1.12 kHz vs. /c/ 0.65 kHz, t = 4.797, pMCMC = .0006) regarding M2. Finally, the frication of Polish /č/ significantly differs from the frication of /
/ 0.71 kHz, t = 11.918, pMCMC = .0001) and /c/ (/č/ 1.12 kHz vs. /c/ 0.65 kHz, t = 4.797, pMCMC = .0006) regarding M2. Finally, the frication of Polish /č/ significantly differs from the frication of /![]() / (/č/ 9.49 kHz vs. /
/ (/č/ 9.49 kHz vs. /![]() / 9.98 kHz, t = −2.57, pMCMC = .009) regarding M1 but not from that of /c/ (9.48 kHz); however, it shows a significant difference for M2 of /
/ 9.98 kHz, t = −2.57, pMCMC = .009) regarding M1 but not from that of /c/ (9.48 kHz); however, it shows a significant difference for M2 of /![]() / (/č/ 0.75 kHz vs. /
/ (/č/ 0.75 kHz vs. /![]() / 0.63 kHz, t = 4.361, pMCMC = .0001) and /c/ (/č/ 0.75 kHz vs. /c/ 0.55 kHz, t = 2.574, pMCMC = .0048).
/ 0.63 kHz, t = 4.361, pMCMC = .0001) and /c/ (/č/ 0.75 kHz vs. /c/ 0.55 kHz, t = 2.574, pMCMC = .0048).
The third and fourth moments of the burst and frication spectra are shown for Polish and Czech consonants in Figures 14 and 15.

Figure 14 The third (M3) and fourth (M4) moments of the burst spectra of Czech and Polish consonants following Forrest et al. (Reference Forrest, Weismer, Milenkovic and Dougall1988).

Figure 15 The third (M3) and fourth (M4) moments of the frication spectra of Czech and Polish consonants following Forrest et al. (Reference Forrest, Weismer, Milenkovic and Dougall1988).
Regarding M3, neither the burst nor frication spectra are significantly different for Czech and Polish /č/ (burst: Czech /č/ −0.04 vs. Polish /č/ −0.04, frication: Czech /č/ −0.02 vs. Polish /č/ −0.03). With respect to M4, the burst spectrum of Polish /č/ shows significantly higher values than that of Czech /č/ (Polish /č/ 0.15 vs. Czech /č/ 0.13, t = 3.509, pMCMC = .0032) and the fricative spectrum of Polish /č/ is characterized by significantly higher values than that of Czech /č/ (Polish /č/ 0.09 vs. Czech /č/ 0.07, t = 3.088, pMCMC = .0146).
If we compare the two sounds to other palatal/palatalized segments, then the following results are obtained: the values of M3 of the burst distinguish between the Polish /č/ and /![]() / (/č/ −0.04 vs. /
/ (/č/ −0.04 vs. /![]() / −0.13, t = 6.764, pMCMC = .0001) as well as between Czech /č/ and /
/ −0.13, t = 6.764, pMCMC = .0001) as well as between Czech /č/ and /![]() / (/č/ −0.04 vs. /
/ (/č/ −0.04 vs. /![]() / −0.13, t = 2.003, pMCMC = .0232). M4 appears to be distinctive for the burst spectra of Polish /č/ in comparison to /
/ −0.13, t = 2.003, pMCMC = .0232). M4 appears to be distinctive for the burst spectra of Polish /č/ in comparison to /![]() / (/č/ 0.15 vs. /
/ (/č/ 0.15 vs. /![]() / 0.11, t = 6.806, pMCMC = .001) and /c/ (/č/ 0.15 vs. /c/ 0.1, t = 4.987, pMCMC = .001) as well as for the spectra of Czech /č/ in comparison to /c/ (/č/ 0.13 vs. /c/ 0.1, t = 5.535, pMCMC = .0001). Furthermore, the M3 of the frication spectra of Polish /č/ is statistically different from the M3 of the frication spectra of /
/ 0.11, t = 6.806, pMCMC = .001) and /c/ (/č/ 0.15 vs. /c/ 0.1, t = 4.987, pMCMC = .001) as well as for the spectra of Czech /č/ in comparison to /c/ (/č/ 0.13 vs. /c/ 0.1, t = 5.535, pMCMC = .0001). Furthermore, the M3 of the frication spectra of Polish /č/ is statistically different from the M3 of the frication spectra of /![]() / (/č/ −0.03 vs. /
/ (/č/ −0.03 vs. /![]() / −0.05, t = 2.727, pMCMC = .0054) but not of /c/ (−0.02). Finally, M4 of the frication is statistically different for the Polish /č/ and /
/ −0.05, t = 2.727, pMCMC = .0054) but not of /c/ (−0.02). Finally, M4 of the frication is statistically different for the Polish /č/ and /![]() / (/č/ 0.09 vs. /
/ (/č/ 0.09 vs. /![]() / 0.07, t = 3.954, pMCMC = .0002) as well as the Polish /č/ and /c/ of frication spectra (/č/ 0.09 and /c/ 0.07, t = 2.146, pMCMC = .0280).
/ 0.07, t = 3.954, pMCMC = .0002) as well as the Polish /č/ and /c/ of frication spectra (/č/ 0.09 and /c/ 0.07, t = 2.146, pMCMC = .0280).
2.2.7 Parameter (vii): Centre of gravity, standard deviation, skewness and kurtosis of burst and frication noise spectra
Figure 16 presents centre of gravity and standard deviation calculated according to Praat version 5.2 (Boersma & Weenink Reference Boersma and Weenink2011) formulae. It should be noted that the values obtained differ from those obtained by applying Forrest et al.'s (Reference Forrest, Weismer, Milenkovic and Dougall1988) method.

Figure 16 Centre of gravity (COG) and spectral standard deviation (SD) of the burst of Czech and Polish consonants.
The centre of gravity values of the burst are not significantly distinctive for Polish and Czech /č/: the average burst COG values of Polish and Czech /č/ are 2563 Hz and 2648 Hz, respectively. Although the COG value at the frication noise is lower for Polish /č/ (3064 Hz) than for Czech /č/ (3466 Hz), the difference is statistically not significant. The results are in contrast to the spectral standard deviation, which is significantly different for the burst: 1145 Hz for Polish /č/ vs. 1587 Hz for Czech /č/ (t = −2.835, pMCMC = .0032). However, the same parameter applied to the frication landmark results in values, which are not statistically significant if comparing Polish /č/ (1464 Hz) and Czech /č/ (1357 Hz).
With respect to the COG, the burst spectra of the palatalized/palatal sounds /![]() / and /c/ are significantly different from the burst of Polish /č/ (/
/ and /c/ are significantly different from the burst of Polish /č/ (/![]() / 3396 Hz vs. /č/ 2563 Hz, t = 5.457, pMCMC = .0001; /c/ 4164 vs. /č/ 2563 Hz, t = 3.146, pMCMC = .0012) and Czech /č/ (/č/ 2648 Hz vs. /
/ 3396 Hz vs. /č/ 2563 Hz, t = 5.457, pMCMC = .0001; /c/ 4164 vs. /č/ 2563 Hz, t = 3.146, pMCMC = .0012) and Czech /č/ (/č/ 2648 Hz vs. /![]() / 3396 Hz, t = −2.237, pMCMC = .0278; and /č/ 2648 Hz vs. /c/ 4164, t = −10.622, pMCMC = .0001). The average COG values of the /c/ frication spectra are significantly higher than the COG of Czech /č/ (/c/ 3755 Hz vs. /č/ 3466 Hz, t = 2.529, pMCMC = .016) but similarly high with respect to Polish /č/ (3064 Hz). This is in contrast to the average COG values of /
/ 3396 Hz, t = −2.237, pMCMC = .0278; and /č/ 2648 Hz vs. /c/ 4164, t = −10.622, pMCMC = .0001). The average COG values of the /c/ frication spectra are significantly higher than the COG of Czech /č/ (/c/ 3755 Hz vs. /č/ 3466 Hz, t = 2.529, pMCMC = .016) but similarly high with respect to Polish /č/ (3064 Hz). This is in contrast to the average COG values of /![]() / frication spectra, which are significantly higher than those obtained for both Polish /č/ (/
/ frication spectra, which are significantly higher than those obtained for both Polish /č/ (/![]() / 4738 Hz vs. /č/ 3064 Hz, t = 12.553, pMCMC = 0.0001) and Czech /č/ (/
/ 4738 Hz vs. /č/ 3064 Hz, t = 12.553, pMCMC = 0.0001) and Czech /č/ (/![]() / 4738 Hz vs. /č/ 3466 Hz, t = 1.906, pMCMC = 0.0002).
/ 4738 Hz vs. /č/ 3466 Hz, t = 1.906, pMCMC = 0.0002).
With respect to the SD of burst spectra, Polish /č/ shows significantly lower values regarding /![]() / (/č/ 1145 Hz vs. /
/ (/č/ 1145 Hz vs. /![]() / 2026 Hz, t = −10.490, pMCMC = .0001), contrary to Czech /č/ (1587 Hz) which does not significantly differ with respect to the SD obtained for /
/ 2026 Hz, t = −10.490, pMCMC = .0001), contrary to Czech /č/ (1587 Hz) which does not significantly differ with respect to the SD obtained for /![]() / (2026 Hz). However, both Polish and Czech /č/ have significantly lower SD values with respect to /c/ (Polish /č/ 1145 Hz vs. /c/ 2268 Hz, t = −5.285, pMCMC = .0001; Czech /č/ 1578 Hz vs. /c/ 2268 Hz, t = −6.945, pMCMC = .0001). The SD of the frication spectra of Czech /č/ shows significantly lower values with respect to /c/ (/č/ 1357 Hz vs. /c/ 2213 Hz, t = −15.03, pMCMC = .0001) and /
/ (2026 Hz). However, both Polish and Czech /č/ have significantly lower SD values with respect to /c/ (Polish /č/ 1145 Hz vs. /c/ 2268 Hz, t = −5.285, pMCMC = .0001; Czech /č/ 1578 Hz vs. /c/ 2268 Hz, t = −6.945, pMCMC = .0001). The SD of the frication spectra of Czech /č/ shows significantly lower values with respect to /c/ (/č/ 1357 Hz vs. /c/ 2213 Hz, t = −15.03, pMCMC = .0001) and /![]() / (/č/ 1357 Hz vs. /
/ (/č/ 1357 Hz vs. /![]() / 1765 Hz, t = −2.44, pMCMC = .0046). Finally, the SD of the frication spectra of Polish /č/ is significantly lower than that of /c/ (/č/ 1464 Hz vs. /c/ 2213 Hz, t = −4.694, pMCMC = .0001) and /
/ 1765 Hz, t = −2.44, pMCMC = .0046). Finally, the SD of the frication spectra of Polish /č/ is significantly lower than that of /c/ (/č/ 1464 Hz vs. /c/ 2213 Hz, t = −4.694, pMCMC = .0001) and /![]() / (/č/ 1464 Hz vs. /
/ (/č/ 1464 Hz vs. /![]() / 1765 Hz, t = −5.275, pMCMC = .0001).
/ 1765 Hz, t = −5.275, pMCMC = .0001).
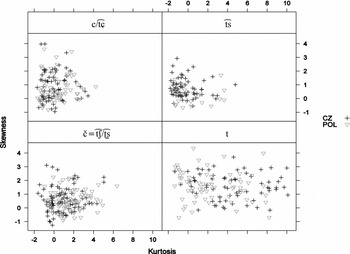
Kurtosis and skewness values are plotted for the burst of Polish and Czech consonants in Figure 17. The values were obtained according to Praat version 5.2 (Boersma & Weenink Reference Boersma and Weenink2011) formulae.

Figure 17 Kurtosis and skewness of the burst of Czech and Polish consonants.
Regarding skewness, the values are positive for both burst and frication spectra of /č/, but significantly lower when comparing Polish to Czech (burst: Polish /č/ 0.20 vs. Czech /č/ 0.81, t = −2.561, pMCMC = .0274; frication: Polish /č/ 0.69 vs. Czech /č/ 1.47, t = −2.17, pMCMC = .0394). Kurtosis is significantly different in the case of frication but not for the burst spectra (burst: Polish /č/ 1.84 vs. Czech /č/ 0.93; frication: Polish /č/ 2.0 vs. Czech /č/ 5.19, t = −2.49, pMCMC = .0264).
Skewness of the burst of Polish /č/ (0.2) does not show any significant effect when compared to /![]() / (0.35) and /c/ (0.3) in contrast to skewness of the burst of Czech /č/ which is significantly higher when compared to /c/ (/č/ 0.81 vs. /c/ 0.3, t = 4.424, pMCMC = .0001). Furthermore, the skewness of the frication spectra of Czech but not Polish /č/ is significantly different from the skewness of /c/ (/č/ 1.47 vs. /c/ 0.29, t = 8.87, pMCMC = .0001) and of /
/ (0.35) and /c/ (0.3) in contrast to skewness of the burst of Czech /č/ which is significantly higher when compared to /c/ (/č/ 0.81 vs. /c/ 0.3, t = 4.424, pMCMC = .0001). Furthermore, the skewness of the frication spectra of Czech but not Polish /č/ is significantly different from the skewness of /c/ (/č/ 1.47 vs. /c/ 0.29, t = 8.87, pMCMC = .0001) and of /![]() / (/č/ 1.47 vs. /
/ (/č/ 1.47 vs. /![]() / 0.44, t = 2.244, pMCMC = .0054).
/ 0.44, t = 2.244, pMCMC = .0054).
If we compare the kurtosis of /č/ to palatalized/palatal sounds, the burst spectra of both Polish and Czech /č/ are significantly higher than those of /c/ (Polish /č/ 1.84 vs. /c/ −0.029, t = 4.229, pMCMC = .0014; Czech /č/ 1.84 vs. /c/ −0.029, t = 3.294, pMCMC = .0008) but only Polish /č/ shows significantly higher values than /![]() / (/č/ 1.84 vs. /
/ (/č/ 1.84 vs. /![]() / 0.39, t = 4.598, pMCMC = .0001). Finally, in contrast to frication spectra of Polish /č/, the kurtosis values of Czech /č/ are different from the corresponding values of /c/ and /
/ 0.39, t = 4.598, pMCMC = .0001). Finally, in contrast to frication spectra of Polish /č/, the kurtosis values of Czech /č/ are different from the corresponding values of /c/ and /![]() / (Czech /č/ 5.19 vs. /
/ (Czech /č/ 5.19 vs. /![]() / 0.72, t = 2.856, pMCMC = .0046; /č/ 5.19 vs. /c/ 0.72 t = 3.68, pMCMC = .0001).
/ 0.72, t = 2.856, pMCMC = .0046; /č/ 5.19 vs. /c/ 0.72 t = 3.68, pMCMC = .0001).
3 Articulatory characteristics
Before taking a closer look at the articulation of Polish and Czech postalveolar sounds, we will review the main articulatory facts about retroflex sounds.
Retroflex sounds are well known for their articulatory variation (Ladefoged & Wu Reference Ladefoged and Wu1984, Ladefoged & Maddieson Reference Ladefoged and Maddieson1996). Typical retroflex stops are articulated with a raised tongue tip placed at the postalveolar region (as in e.g. Hindi) or with the underside of the tongue tip touching the palatal place of articulation (as in e.g. Tamil). Between these two articulatory extremes other realizations of retroflex stops are also found, for example, in Pekingese sibilants (see Ladefoged & Bhaskararao Reference Ladefoged and Bhaskararao1983). Retroflex fricatives are typically produced with the tongue tip raised to the postalveolar place of articulation (Keating Reference Keating, Paradis and Prunet1991: 35). This is in contrast to palatoalveolar sibilants, which are produced with the tongue blade touching the postalveolar area. While in the case of retroflexes the tongue dorsum is usually flat, in the case of palatoalveolars it is domed. Such observations lead to the classification of several sibilant fricatives often assumed to be palatoalveolars as retroflexes, e.g. Mandarin sibilants (Ladefoged & Wu Reference Ladefoged and Wu1984), some Slavic sibilants (Żygis Reference Żygis, Hall and Hamann2003, Reference Żygis2006; Hamann Reference Hamann2004), and Komi-Permyak sibilants (Kochetov & Lobanova Reference Kochetov and Lobanova2007).
3.1 Polish
Biedrzycki (Reference Biedrzycki1974) provides an x-ray tracing of the stop component of Polish /č/ (the sound he transcribes as /tš/) which leaves no doubt that the stop component also has features characteristic of typical retroflex stops: it is produced with the tongue tip, which is extended and raised. It touches the alveolar ridge or even the area behind it. In addition, the posterodorsum is raised and the sound is velarized; see Figure 18 (an equivalent x-ray tracing of the fricative component is not provided by Biedrzycki Reference Biedrzycki1974). A very similar x-ray tracing of the stop component is provided by Ostaszewska & Tambor (Reference Ostaszewska and Tambor2001: 40), who transcribe the affricate as /č/.

Figure 18 Stop component of Polish /č/ based on Biedrzycki (Reference Biedrzycki1974: 22).
Wierzchowska (Reference Wierzchowska1971: 163) provides another x-ray tracing of the stop component of the postalveolar affricate. It is shown in Figure 19a, while the fricative component is presented in Figure 19b. Note that Wierzchowska also transcribes the affricate as /č/.

Figure 19 (a) Stop component of Polish /č/ based on Wierzchowska (Reference Wierzchowska1971: 163). (b) Fricative component of Polish /č/ based on Wierzchowska (Reference Wierzchowska1980: 64).
Although the tongue tip is not curled up in Figure 19a, Wierzchowska (Reference Wierzchowska1971: 163) observes that the difference between the Polish coronal stop /t/ and the stop component of /č/ is that the tongue tip is positioned higher in the latter sound than in the former one. As shown in Figure 19a, the tongue tip touches the alveolar ridge, whereas in the case of /t/ the tongue tip is positioned behind the teeth.Footnote 7 Wierzchowska explicitly states that the sound is articulated with the tongue tip behind the alveolar ridge. The affricate /č/ is pronounced with a flat tongue dorsum, and it also displays a sublingual cavity, which is characteristic of retroflexes.
As far as the fricative part of /č/ is concerned, Wierzchowska (Reference Wierzchowska1980) provides the same x-ray tracing as for the corresponding fricative /š/. Regarding the definition of retroflexes adopted for the present study, according to which retroflexes are apical and produced at a postalveolar place of articulation, the fricative part of the Polish sound can also be classified as retroflex, which leads to the conclusion that /![]() / (and not /
/ (and not /![]() /) reflects the articulatory characteristics of the Polish sound in a more optimal way.
/) reflects the articulatory characteristics of the Polish sound in a more optimal way.
It is also worth noting that in the Slavic tradition the postaveolar sounds in question are denoted as /č/, /![]() / (e.g. Benni Reference Benni1931, Wierzchowska Reference Wierzchowska1971, Rubach Reference Rubach1984, Ostaszewska & Tambor Reference Ostaszewska and Tambor2001); /č/, /dž/ (e.g. Gussmann Reference Gussmann1980, Szpyra Reference Szpyra1995); /tš/, /dž/ (Biedrzycki Reference Biedrzycki1974); or as IPA /
/ (e.g. Benni Reference Benni1931, Wierzchowska Reference Wierzchowska1971, Rubach Reference Rubach1984, Ostaszewska & Tambor Reference Ostaszewska and Tambor2001); /č/, /dž/ (e.g. Gussmann Reference Gussmann1980, Szpyra Reference Szpyra1995); /tš/, /dž/ (Biedrzycki Reference Biedrzycki1974); or as IPA /![]() /, /
/, /![]() / (e.g. Jassem Reference Jassem, Lindblom and Öhman1979, Reference Jassem2003; Dukiewicz & Sawicka Reference Dukiewicz and Sawicka1995). However, in the non-Slavic tradition researchers have already pointed out the retroflex character of the Polish sibilant fricatives; see Keating (Reference Keating1993), Ladefoged & Maddieson (Reference Ladefoged and Maddieson1996), Hall (Reference Hall1997b), Rochoń [Żygis] & Pompino-Marschall (Reference Rochoń [Żygis] and Pompino-Marschall1999), Hamann (Reference Hamann2003, Reference Hamann2004), and Żygis (Reference Żygis, Hall and Hamann2003, Reference Żygis2006). Only one study, to the best of our knowledge, namely Stevens & Blumstein (Reference Stevens and Blumstein1975), treats the Polish affricate /
/ (e.g. Jassem Reference Jassem, Lindblom and Öhman1979, Reference Jassem2003; Dukiewicz & Sawicka Reference Dukiewicz and Sawicka1995). However, in the non-Slavic tradition researchers have already pointed out the retroflex character of the Polish sibilant fricatives; see Keating (Reference Keating1993), Ladefoged & Maddieson (Reference Ladefoged and Maddieson1996), Hall (Reference Hall1997b), Rochoń [Żygis] & Pompino-Marschall (Reference Rochoń [Żygis] and Pompino-Marschall1999), Hamann (Reference Hamann2003, Reference Hamann2004), and Żygis (Reference Żygis, Hall and Hamann2003, Reference Żygis2006). Only one study, to the best of our knowledge, namely Stevens & Blumstein (Reference Stevens and Blumstein1975), treats the Polish affricate /![]() / as a retroflex sound, although its properties are not discussed there in detail.
/ as a retroflex sound, although its properties are not discussed there in detail.
3.2 Czech
An x-ray tracing of the stop component of Czech /č/ is shown in Figure 20a. It shows that in the release phase of the closure, a constriction similar to that of /ʃ/ is created. The lips are protruded. The tongue dorsum is rather domed. Figure 20b provides an x-ray tracing of the fricative /ʃ/. (These and the images in Figure 21 are taken from Palková (Reference Palková1994) by permission.)

Figure 20 (a) Stop component of Czech /![]() / (Palková Reference Palková1994: 229). (b) Czech /ʃ/ (Palková Reference Palková1994: 235).
/ (Palková Reference Palková1994: 229). (b) Czech /ʃ/ (Palková Reference Palková1994: 235).

Figure 21 Palatogram and linguagram of the closure of Czech /č/ (Palková Reference Palková1994: 235).
Palková (Reference Palková1994: 235) states that in the closure phase the tongue tip is situated at the rear of the alveolar ridge. This is confirmed by both the palatogram and the linguagram of /![]() / provided in Figure 21.
/ provided in Figure 21.
In our view, the articulatory data do not provide clear evidence in favour of /![]() /, which is typically produced with the tongue blade touching the postalveolar place of articulation and a raised tongue dorsum. The data are based on an investigation of only one speaker, and we conclude that further study is needed in order to gain more insight into the articulation of Czech /č/; see also a description of the Czech phonemic inventory by Dankovičová (Reference Dankovičová1997) who also used the symbol /
/, which is typically produced with the tongue blade touching the postalveolar place of articulation and a raised tongue dorsum. The data are based on an investigation of only one speaker, and we conclude that further study is needed in order to gain more insight into the articulation of Czech /č/; see also a description of the Czech phonemic inventory by Dankovičová (Reference Dankovičová1997) who also used the symbol /![]() /.
/.
4 Impressionistic perception of Polish and Czech /č/
In the Slavic literature, it is common to use terms such as soft vs. hard to differentiate between palatalized and non-palatalized sounds; see de Bray (Reference Bray1951). Occasionally, the term semi-soft is used to distinguish sounds which are perceived as less soft than palatalized sounds. In other words, palatalized sounds are called soft, non-palatalized sounds are perceived as hard and sounds whose percept lies between palatalized and non-palatalized, presumably slightly palatalized, are interpreted as semi-soft. It should also be stressed that although these terms are perceptually (impressionistically) oriented, no exact perceptual definition is given.Footnote 8
From a perceptual point of view, Polish affricates are unanimously considered to be of low sibilant tonality (Żygis Reference Żygis2006), or hard in traditional terms, especially when compared with affricates of other Slavic languages, e.g. Russian (de Bray Reference Bray1951). The ‘hardness’ of these sounds is acoustically mirrored by prominent lower frequencies, which are characteristic of retroflexes.
Lehr-Spławiński & Stieber (Reference Lehr-Spławiński and Stieber1957: 40) maintain that the pronunciation of the fricatives /š ž/ in Czech can be as ‘hard’ as the corresponding Polish sounds, but it often happens that the sounds are articulated in a ‘semi-soft’ way. This is especially noticeable – as Lehr-Spławiński & Stieber (Reference Lehr-Spławiński and Stieber1957) observe – when Czechs speak Polish. With respect to the corresponding affricate /č/, the situation is different in that there is no option: the affricate is always semi-soft and differs from Polish /![]() / (i.e. /č/ in Lehr-Spławiński & Stieber's terms).
/ (i.e. /č/ in Lehr-Spławiński & Stieber's terms).
As far as the present study is concerned, all four Czech speakers produced a ‘semi-soft’ affricate which makes a strikingly different perceptual impression in comparison to the ‘hard’ Polish affricate pronounced by all four Polish speakers. This was especially evident when both Polish and Czech informants produced the same word, časy ‘times’, in both languages.
5 Articulation, perception, and the retroflex puzzle
Before we share some thoughts on the motivation for the appearance of retroflexes in Polish (in Section 6 below), let us look at some articulatory variants of retroflex fricatives in Polish.
Styczek (Reference Styczek1973) provides x-ray data of Polish sibilants as pronounced by thirteen Polish speakers. Styczek (Reference Styczek1973) shows that her speakers produced Polish /š/ in four different ways, as listed in (6) below. Note that not every pronunciation variant can be classified as retroflex in our terms as the sibilants are also produced at the alveolar ridge (6c) and sometimes even with the tongue blade (6d).
(6) Production of Polish /š/ based on x-ray data of 13 speakers (Styczek Reference Styczek1973)
a. With a slightly raised tongue tip accompanied by lip rounding.
b. With a curled up tongue tip without lip rounding.
c. With a tongue tip touching the alveolar ridge accompanied by lip rounding.
d. With a slightly raised tongue blade without lip rounding.
How can we explain such variation? In fact, the varying gestures in (6a–d) are not arbitrary but they regulate the size of the front cavity (Stevens Reference Stevens1998). Speakers use different strategies to form the large cavity and thereby achieve the lowering of resonances (see below). They can either raise the tongue tip higher (sometimes even curling it up), or, alternatively, they can protrude their lips. In fact, speakers use these two gestures in various ways: they round the lips if the tongue tip is closer to the alveolar ridge, but they do not necessarily round their lips if the tongue tip is placed high behind the alveolar ridge. Between the two extremes other configurations are possible since they all lead to a similar perceptual output.
Two possible articulatory configurations are illustrated by the x-ray tracings in Figure 22; they illustrate the pronunciation of /ʂ/ by two native speakers of Polish (Styczek Reference Styczek1973 uses the symbol /š/ to denote this sound).

Figure 22 Polish /š/ as produced by two speakers (Styczek Reference Styczek1973). (a) Large front cavity without lip protrusion. (b) Small front cavity with lip protrusion.
The speaker whose pronunciation is shown in the x-ray tracing in Figure 22a raises his tongue tip almost without protruding his lips. Different articulatory gestures are found in the pronunciation of the second speaker (Figure 22b): the tongue tip is not raised, while the lips are protruded.
Varying degrees of lip protrusion are not only characteristic for Polish sibilants. Koneczna & Zawadowski (Reference Koneczna and Zawadowski1956: 77) also observe a similar variation in the pronunciation of Russian /š/ by their two speakers. One speaker produced /š/ by placing the tongue tip further back at the postalveolar place of articulation than the other. At the same time, the latter speaker protruded his lips, whereas the former did not. Again, the explanation provided by Koneczna & Zawadowski (Reference Koneczna and Zawadowski1956) is straightforward: the first speaker did not need to protrude his lips as the front cavity was already large enough to achieve the resonances required; see also Toda, Maeda & Honda (Reference Toda, Maeda, Honda, Fuchs, Toda and Żygis2010).
In light of the articulatory variation found not only in retroflexes but also in all sibilants, it appears that sibilants can be better captured as a natural class in perceptual terms than in articulatory terms. Ladefoged (Reference Ladefoged, Hardcastle and Laver1997: 614) notes that in the case of sibilants their perceptual characteristics prove to be better for grouping all sibilants into one class than the articulatory features:
What is at stake is whether the auditory definition provides a better explanation for the grouping than a definition in terms of the articulatory attributes. Until there is some evidence for the shared articulatory properties being the reason for this grouping, it seems preferable to continue to maintain that the well attested salient auditory characteristics are the basis for the natural class. (Ladefoged Reference Ladefoged, Hardcastle and Laver1997: 614)
Returning to sibilant affricates, it seems that like sibilant fricatives they show articulatory variation on the one hand and a stable percept on the other (see Section 4). For this reason we would prefer to use a detailed perceptually-based transcription and not an articulatorily-based one. Since such transcriptions do not exist, we have chosen transcriptions which cover most articulatory variation and which are closer to these sounds from a perceptual point of view. The Polish affricates are typically pronounced with the tongue tip touching the postalveolar place of articulation, but a great deal of variation is found among speakers (see (6) above). For these cases we decided to use the traditional IPA notation of retroflex affricates /![]() /, /
/, /![]() / to describe these sounds since the retroflexes are generally produced with the tongue tip and the term retroflex covers several places of (postalveolar) articulation. Furthermore, in our view these affricates are perceptually closer to the retroflexes /
/ to describe these sounds since the retroflexes are generally produced with the tongue tip and the term retroflex covers several places of (postalveolar) articulation. Furthermore, in our view these affricates are perceptually closer to the retroflexes /![]() /, /
/, /![]() / than to the palatoalveolars /
/ than to the palatoalveolars /![]() /, /
/, /![]() /. Finally, a possible candidate for transcribing the Polish affricate, i.e. the palatoalveolar affricate produced with the tongue tip /
/. Finally, a possible candidate for transcribing the Polish affricate, i.e. the palatoalveolar affricate produced with the tongue tip /![]() /, does not reflect the articulation with the curled-up tongue tip, which is a possible articulation attested in the affricate realization.
/, does not reflect the articulation with the curled-up tongue tip, which is a possible articulation attested in the affricate realization.
6 Why retroflexes in Polish?
In light of our conclusions, an intriguing question arises as to why the Polish inventory contains the retroflex sound at all while the corresponding sound in its neighbouring language Czech is a palatoalveolar /![]() /. This question is even more intriguing if one considers the fact that both sounds originate from the same Protoslavic ancestor /č/.Footnote 9
/. This question is even more intriguing if one considers the fact that both sounds originate from the same Protoslavic ancestor /č/.Footnote 9
Our hypothesis concerning this question invokes perceptual relations among the sibilants in a given inventory since – as stated in the previous section – perception plays an indispensable role in determining sibilant systems. The hypothesis is also based on a phonological principle originally proposed by Hall (Reference Hall1997a) for describing sibilant fricative systems. According to this principle, in complex sibilant systems, i.e. those consisting of at least two postalveolar fricative sibilants, one of them is retroflex. The present study extends this principle to affricates as shown in (7). Note that the principle refers only to postalveolar sibilants but does not exclude the presence of dental or alveolar /s/ in a given inventory.
(7) Markedness statement (see Hall Reference Hall1997a for a statement on sibilant fricatives)
If the inventory is complex, i.e. consists of at least two postalveolar sibilant affricates, then one of the postalveolar affricates is retroflex.
Hall (Reference Hall1997a) argues that the palatoalveolar fricative /ʃ/ and the alveolo-palatal /ɕ/ do not co-occur in phonemic inventories because both fricatives are identical with regard to their features, i.e. [+coronal, –anterior, +distributed]. Therefore, /ʃ/ converts to /ʂ/ changing its feature specification to [+coronal, –anterior, –distributed].
In contrast to Hall (Reference Hall1997a), we advance the hypothesis that perception rather than articulation is responsible for changes in sibilant systems. In particular, changes from palatoalveolar to retroflex sibilants are claimed to be perceptually-based: /![]() / and /
/ and /![]() / form a better perceptual contrast than /
/ form a better perceptual contrast than /![]() / and /
/ and /![]() /; therefore, /
/; therefore, /![]() / changed to /
/ changed to /![]() / in those systems which already contained the alveolo-palatal, as was the case in Polish.
/ in those systems which already contained the alveolo-palatal, as was the case in Polish.
The relevant change is schematically shown in Figure 23. The arrow indicates the change and the horizontal lines indicate the perceptual distance.

Figure 23 Schematic representation of perceptual relations in affricate systems.
In simple sibilant systems, i.e. those consisting of one postalveolar affricate as in Czech (see Figure 23), the postalveolar affricate is almost always a palatoalveolar /![]() / because the perceptual distance between the two sounds is sufficient and an optimal contrast already exists.Footnote 10, Footnote 11
/ because the perceptual distance between the two sounds is sufficient and an optimal contrast already exists.Footnote 10, Footnote 11
An important though indirect piece of evidence supporting this view is provided by Żygis & Padgett's (Reference Żygis and Padgett2010) acoustic and perceptual study of Polish fricatives. They analyse the relative distances between the Polish fricatives in the form of a multidimensional scaling which is in line with the corresponding affricates in the Figure 23. Their results show that the pair /ʂ/ and /ɕ/ is better discriminated than the pair /ʃʲ/ and /ɕ/ by both English and Polish listeners. In an acoustic space whose dimensions are created by F2 and COG, the distance between /ʂ/ and /ɕ/ is greater than between /ʃʲ/ and /ɕ/ (Padgett & Żygis Reference Padgett and Żygis2007, Żygis & Padgett Reference Żygis and Padgett2010).
The results of the present study show, however, that COG does not contribute to the distinction of the frication part of the affricates. This appeared a bit surprising especially in light of the fact that COG is generally seen as a parameter contributing to the distinction of fricatives including sibilants. We hypothesise that other parameters such as e.g. temporal cues and formants have greater impact on distinguishing small differences between the affricates. In addition, spectral slopes may play a more important role in the perception of rather small perceptual differences in affricates than COG does. Therefore, it remains to be seen which parameters are decisive for the perception of the affricates, a topic which we leave open for further study.
7 Conclusions
The results of the experimental study have revealed a clear difference between the Czech and Polish affricates /č/, which are consistently assumed to be the same palatoalveolar /![]() / in both languages. Whereas the Czech affricate is indeed a palatoalveolar /
/ in both languages. Whereas the Czech affricate is indeed a palatoalveolar /![]() /, the Polish postalveolar affricate has been classified as a retroflex according to the results of the present study.
/, the Polish postalveolar affricate has been classified as a retroflex according to the results of the present study.
Czech and Polish /č/ differ with respect to several parameters. While in Czech /![]() /, the frication is significantly longer than the closure, the Polish affricate /
/, the frication is significantly longer than the closure, the Polish affricate /![]() / shows the reverse pattern: a long closure followed by a short frication. This result points to an important articulatory difference between the postalveolar affricates. In the case of the Czech /
/ shows the reverse pattern: a long closure followed by a short frication. This result points to an important articulatory difference between the postalveolar affricates. In the case of the Czech /![]() /, the fricative part is considerably longer presumably because the tongue blade takes longer to separate from the prepalate. The corresponding Polish sound is articulated with the tongue tip, which is typical for retroflex sounds (see also Miller-Ockhuizen & Zec Reference Miller-Ockhuizen, Zec, Solé, Recasens and Romero2003, Kochetov & Lobanova Reference Kochetov and Lobanova2007).
/, the fricative part is considerably longer presumably because the tongue blade takes longer to separate from the prepalate. The corresponding Polish sound is articulated with the tongue tip, which is typical for retroflex sounds (see also Miller-Ockhuizen & Zec Reference Miller-Ockhuizen, Zec, Solé, Recasens and Romero2003, Kochetov & Lobanova Reference Kochetov and Lobanova2007).
The results also show crucial differences in formants of the vowel [a] following /č/: F1 frequency is higher in Polish (677 Hz) than in Czech (453 Hz), and F2 frequency is higher in Czech (1751 Hz) than in Polish (1606 Hz). Furthermore, F1 of the preceding vowel [a] is higher in Polish (666 Hz) than in Czech (510 Hz) and F3 frequency appears to be lower in Czech than in Polish /č/ (2610 Hz vs. 2809 Hz).
Further differences were found when comparing spectral characteristics of the sound /č/. Both the lower frequency spectral slope value m1 (from 500 Hz to 3000 Hz) and the higher frequency value m2 (from 500 Hz to the Nyquist frequency) differ significantly between Polish and Czech /č/: the burst spectral slope of the Polish sound /č/ is steeper than the Czech spectral slope up to the peak mean frequency F. Towards higher frequencies above F, the Polish spectral slope is steeper than the Czech spectral slope. For the frication part, the same trend (though not significant) is observed for m2. In contrast, m1 is significantly steeper for Czech than for Polish.
The burst spectra of Polish and Czech /č/ do not significantly differ with respect to the first moment M1 (Polish /č/ 9.31 kHz vs. Czech /č/ 9.35 kHz) but they do differ with respect to the second moment M2, which is lower for Czech /č/ (0.86 kHz) than for Polish /č/ (1.12 kHz). In the same vein, only the fricative spectra are different with respect to M2 (Polish /č/ 0.75 kHz vs. Czech /č/ 0.61 kHz). While M3 is approximately the same for the two sounds (burst: Czech /č/ −0.04 vs. Polish /č/ −0.04, frication: Czech /č/ −0.02 vs. Polish /č/ −0.03), M4 is significantly different for (i) the burst spectra of Polish, which shows significantly higher M4 values for Polish (0.15) than for Czech /č/ (0.13), and (ii) the fricative spectra, with the M4 being higher for Polish /č/ (0.09) than for Czech /č/ (0.07).
For both the burst and the frication landmarks, the centre of gravity does not significantly distinguish Polish and Czech /č/ (Polish /č/ 3064 Hz vs. Czech /č/ 3466 Hz). The spectral standard deviation values appear to be significantly different for the burst: 1145 Hz for Polish /č/ vs. 1587 Hz for Czech /č/. In contrast, skewness significantly differs for the frication (Polish /č/ 0.69 vs. Czech /č/ 1.47) and the burst landmark (Polish /č/ 0.20 vs. Czech /č/ 0.81). Kurtosis is significantly different in the case of frication (Polish /č/ 2.0 vs. Czech č/ 5.19) but not burst spectra (Polish /č/ 1.84 vs. Czech /č/ 0.93).
Thus, the results show that Polish and Czech affricates differ more in the overall spectral shape (as indicated by the spectral slope measures and – with some restrictions – also skewness and kurtosis) than in the location of the spectral peaks and maxima. Apparently other aerodynamic factors such as source strength plays a more important role than do differences in place of articulation (F, COG, spectral maxima) when distinguishing the spectral properties of the affricates in the two languages (see also Jesus & Shadle Reference Jesus and Shadle2002, who have shown that m2 is related to noise source strength, with less negative values indicating higher flow velocity).
Furthermore, it has been hypothesized that the choice of /![]() / or /
/ or /![]() / in phonemic inventories is not accidental: /
/ in phonemic inventories is not accidental: /![]() / is attested in complex sibilant systems, i.e. those containing at least two postalveolar affricates (Polish), whereas /
/ is attested in complex sibilant systems, i.e. those containing at least two postalveolar affricates (Polish), whereas /![]() / is found in simple affricate systems, i.e. those containing one postalveolar affricate (Czech). This systematic difference is presumably motivated perceptually by the need to optimize the contrast between sibilants: since the Czech /
/ is found in simple affricate systems, i.e. those containing one postalveolar affricate (Czech). This systematic difference is presumably motivated perceptually by the need to optimize the contrast between sibilants: since the Czech /![]() / creates a sufficient perceptual contrast to /
/ creates a sufficient perceptual contrast to /![]() / (the only other affricate present in this inventory), there is no need for /
/ (the only other affricate present in this inventory), there is no need for /![]() / to be converted into a retroflex, in contrast to the situation in complex inventories such as that of Polish. This hypothesis should be perceptually tested, a topic which we leave open for further study.
/ to be converted into a retroflex, in contrast to the situation in complex inventories such as that of Polish. This hypothesis should be perceptually tested, a topic which we leave open for further study.
Acknowledgements
We would like to thank Daniel Recasens, Adrian Simpson and three anonymous reviewers for valuable comments on earlier versions of this paper as well as Lucie Kockova-Amortova for helping us with Czech data. Jörg Dreyer provided excellent technical support. All weaknesses remain our own responsibility. This work was partially funded by FEDER through the Operational Program Competitiveness Factors – COMPETE and by Portuguese National Funds through FCT – Foundation for Science and Technology in the context of the project FCOMP-01-0124-FEDER-022682 (FCT reference PEst-C/EEI/UI0127/2011) to IEETA (Luis Jesus and Daniel Pape), and the post-doctoral fellowship from FCT (Portugal) SFRH/BPD/48002/2008 to Daniel Pape. This research has been partly supported by Bundesministerium für Bildung und Forschung (BMBF) Germany Grant Nr. 01UG0711 to Marzena Żygis.
Appendix A. Material
1. Czech data

2. Polish data

Appendix B. Average values and standard deviations (SDs)
For each consonant we provide average values (left column) and their standard deviations (right column). The SDs are given in italics.
1. Duration (log values)
1.1 Closure duration

1.2 Frication duration

2. Formant values (all values in Hz)
2.1 F1 of the following vowel

2.2 F2 of the following vowel

2.3 F3 of the following vowel

2.4 F1 of the preceding vowel

2.5 F2 of the preceding vowel

2.6 F3 of the preceding vowel

3. Formant frequency range (all values in Hz)
3.1 F1 range of the following vowel

3.3 F2 range of the following vowel

3.3 F3 range of the following vowel

3.4 F1 range of the preceding vowel

3.5 F2 range of the preceding vowel

3.6 F3 range of the preceding vowel

4. Spectral properties
4.1 Highest peak frequency – burst (all values in Hz)

4.2 Highest peak frequency – frication noise midpoint (all values in Hz)

4.3 Spectral slope m1 (Jesus & Shadle Reference Jesus and Shadle2002) – burst (all values in dB/kHz2)

4.4 Spectral slope m1 (Jesus & Shadle Reference Jesus and Shadle2002) – frication (all values in dB/kHz2)

4.5 Spectral slope m2 (Jesus & Shadle Reference Jesus and Shadle2002) – burst (all values in dB/kHz2)

4.6 Spectral slope m2 (Jesus & Shadle Reference Jesus and Shadle2002) – frication (all values in dB/kHz2)

4.7 First moment M1 (Forrest et al. Reference Forrest, Weismer, Milenkovic and Dougall1988) – burst (all values in kHz)

4.8 First moment M1 (Forrest et al. Reference Forrest, Weismer, Milenkovic and Dougall1988) – frication (all values in kHz)

4.9 Second moment M2 (Forrest et al. Reference Forrest, Weismer, Milenkovic and Dougall1988) – burst (all values in kHz)

4.10 Second moment M2 (Forrest et al. Reference Forrest, Weismer, Milenkovic and Dougall1988) – frication (all values in kHz)

4.11 Third moment M3 (Forrest et al. Reference Forrest, Weismer, Milenkovic and Dougall1988) – burst

4.12 Third moment M3 (Forrest et al. Reference Forrest, Weismer, Milenkovic and Dougall1988) – frication

4.13 Fourth moment M4 (Forrest et al. Reference Forrest, Weismer, Milenkovic and Dougall1988) – burst

4.14 Fourth moment M4 (Forrest et al. Reference Forrest, Weismer, Milenkovic and Dougall1988) – frication

4.15 Centre of gravity (Praat) – burst (all values in Hz)

4.16 Centre of gravity (Praat) – frication noise midpoint (all values in Hz)

14.17 Standard deviation (Praat) – burst (all values in Hz)

4.18 Standard deviation (Praat) – frication (all values in Hz)

4.19 Skewness (Praat) – burst

4.20 Skewness (Praat) – frication

4.21 Kurtosis (Praat) – burst

4.22 Kurtosis (Praat) – frication

Appendix C. Statistical results
In the tables in this appendix, ini = initial, med = medial, and bold is used to emphasize a comparison between Czech and Polish /č/.
1. Duration
1.1. Closure duration (log)*

1.2. Frication duration (log)

2. Formant frequency values
2.1 F1 of the following vowel

2.2 F2 of the following vowel

2.3 F3 of the following vowel

2.4 F1 of the preceding vowel*

2.5 F2 of the preceding vowel*

2.6 F3 of the preceding vowel*

3. Formant frequency range
3.1 F1 range of the following vowel

3.2 F2 range of the following vowel

3.3 F3 range of the following vowel

3.4 F1 range of the preceding vowel*

3.5 F2 range of the preceding vowel*

3.6 F3 range of the preceding vowel*

4. Spectral properties
4.1 Highest peak frequency – burst

4.2 Highest peak frequency – frication

4.3 Spectral slope m1 (Jesus & Shadle Reference Jesus and Shadle2002) – burst

4.4 Spectral slope m1 (Jesus & Shadle Reference Jesus and Shadle2002) – frication

4.5 Spectral slope m2 (Jesus & Shadle Reference Jesus and Shadle2002) – burst

4.6 Spectral slope m2 (Jesus & Shadle Reference Jesus and Shadle2002) – frication

4.7 First moment M1 (Forrest et al. Reference Forrest, Weismer, Milenkovic and Dougall1988) – burst

4.8 First moment M1 (Forrest et al. Reference Forrest, Weismer, Milenkovic and Dougall1988) – frication

4.9 Second moment M2 (Forrest et al. Reference Forrest, Weismer, Milenkovic and Dougall1988) – burst

4.10 Second moment M2 (Forrest et al. Reference Forrest, Weismer, Milenkovic and Dougall1988) – frication

4.11 Third moment M3 (Forrest et al. Reference Forrest, Weismer, Milenkovic and Dougall1988) – burst

4.12 Third moment M3 (Forrest et al. Reference Forrest, Weismer, Milenkovic and Dougall1988) – frication

4.13 Fourth moment M4 (Forrest et al. Reference Forrest, Weismer, Milenkovic and Dougall1988) – burst

4.14 Fourth moment M4 (Forrest et al. Reference Forrest, Weismer, Milenkovic and Dougall1988) – frication

4.15 Centre of gravity (Praat) – burst

4.16 Centre of gravity (Praat) – frication

4.17 Standard deviation (Praat) – burst

4.18 Standard deviation (Praat) – frication

4.19 Skewness (Praat) – burst

4.20 Skewness (Praat) – frication

4.21 Kurtosis (Praat) – burst

4.22 Kurtosis (Praat) – frication