The majority of studies on phonation types have focused on low vowels due to the minimal effects of their first formant on harmonic amplitude. In studies of multiple vowel qualities, reports on the relationship between vowel and voice quality are mixed: some show similar formant frequencies across phonation types (e.g. Abramson, Nye & Luangthongkum Reference Abramson, Patrick and Therapan2007, Khan Reference Khan2012), while others show different formant frequencies depending on voice quality (e.g. Ren Reference Ren1992, Kuang Reference Kuang2011). Results differ as to whether the degree of non-modal phonation varies (Andruski & Ratliff Reference Andruski and Martha2000, Kuang Reference Kuang2011) or does not vary (Esposito Reference Esposito2012, Khan Reference Khan2012) across different vowel qualities. The present study draws on innovations which allow for more accurate corrections for the effects of formant frequencies on spectral measures (i.e. Hanson Reference Hanson1995, Iseli, Shue & Alwan Reference Iseli, Yen-Liang and Abeer2007) to examine the relationship between vowel quality and voice quality, in eight languages – !Xóõ, Burmese, Gujarati, Jalapa de Díaz Mazatec, Mon, Santa Ana del Valle Zapotec, White Hmong, and Yi. While no significant difference in the degree of non-modal phonation due to vowel quality was found, results showed a crosslinguistic pattern in the relationship between vowel quality and voice quality: vowels with higher log(F1) and log(F2) values tended to be produced with creakier phonation, while vowels with lower log(F1) and log(F2) values tended to be produced with breathier phonation, but only on the measure H1*-H2*.
1 Introduction
The majority of studies on linguistically-relevant phonation type differences focus solely on low vowels, such as /a/ or /𝔞/, due to the minimal effects of their first formant on harmonic amplitude.Footnote 1 A few studies explore phonation types in wider vocalic inventories, though they report mixed results regarding the relationship between vowel quality and voice quality. Similar first formant frequencies (F1) are reported for breathy and modalFootnote 2 vowels in Mon (Thongkum Reference Thongkum1987a), Nyah Kur (Thongkum Reference Thongkum1987b), Kui (Thongkum Reference Thongkum1986), Khmu’ Rawk (Abramson, Nye & Luangthongkum Reference Abramson, Patrick and Therapan2007) and Gujarati (Khan Reference Khan2012*) and for modal, breathy and creaky phonation in Jalapa MazatecFootnote 3 (Garellek & Keating Reference Garellek and Patricia2011*). However, when compared to modally-phonated vowels, a lower first formant frequency is found for: (i) breathy vowels in Kedang (Samely Reference Samely1991), Nilotic languages (Denning Reference Denning1989), Southeast Asian languages (Hombert Reference Hombert and Victoria1978, Bradley Reference Bradley and David1982) and Xhosa (Jessen & Roux Reference Jessen and Justus2002*); (ii) breathy and breathy-creaky vowels in Chong (Thongkum Reference Thongkum1987b); (iii) slack voice in Shanghainese (Ren Reference Ren1992); and (iv) lax phonation in Yi (Kuang Reference Kuang2011*). Similarly, higher first formant frequency is reported for creaky/tense phonation in Hani (Maddieson & Ladefoged Reference Ladefoged and Norma1985) and Mpi (Denning Reference Denning1989), and higher first and second formant (F2) frequencies are found for the stridentFootnote 4 vowels in !Xóõ (Traill Reference Traill1985).
An additional issue regarding vowel quality and phonation type is the degree of nonmodal phonation for a particular vowel quality. In Green Mong (Andruski & Ratliff Reference Andruski and Martha2000), /a̤-/ is reported to be breathier than /i̤-/ and /ṳ-/. And, phonation type is produced differently for different vowel qualities: the difference between the amplitude of the first and second harmonics (H1-H2) is a good indicator of the phonation difference for /i/ and /u/, but not for /a/.Yi(Kuang Reference Kuang2011*) also displays variation in phonation type due to vowel quality; phonation differences are smaller in low/open vowels than high/close ones. However, in other languages, such as White Hmong (Esposito Reference Esposito2012*) and Gujarati (Khan Reference Khan2012*), there is no significant difference between phonation types across different vowel qualities.
To summarize, there are mixed results regarding the interaction between formant frequencies and phonation type, and there is little knowledge regarding the degree of non-modal phonation for different vowel types. Due to progress in correcting for the effects of formant frequency and bandwidths on spectral measures (see Hanson Reference Hanson1995, 1997; Hanson & Chuang Reference Hanson and Erika1999; Iseli, Shue & Alwan Reference Iseli, Yen-Liang and Abeer2007), it is now possible to focus our attention on these issues. Our goal is to investigate the relationship between formant frequency and voice quality, using data from eight unrelated languages.
2 Background
We will begin by providing a review of the acoustic properties associated with the production of voice quality. Following that, we present a summary of the languages studied, concentrating on vowel inventory and phonation type.
2.1 Acoustic properties of phonation contrasts
Various spectral measures are used to quantify phonation type differences; these include, but are not limited to, the difference between the amplitude of the first harmonic and second harmonic (i.e. H1-H2), and the difference between the first harmonic (H1) and that of harmonics exciting higher formants (e.g. H1-A1, H1-A2, and H1-A3). Values for these measures are highest for breathy phonation, smallest for creaky, and moderate for modal phonation. H1-H2, a measure of spectral balance, is one of the most common ways to measure phonation types. H1-H2 is an accurate measure of phonemic phonation types in !Xóõ (Bickley Reference Bickley1982), Jalapa de Díaz Mazatec (Blankenship Reference Blankenship2002, Garellek & Keating Reference Garellek and Patricia2011*, Keating et al. Reference Keating, Christina, Marc, Sameer ud and Jianjiang2010*), Chanthaburi Khmer (Wayland & Jongman Reference Wayland and Allard2002), Green Mong (Andruski & Ratliff Reference Andruski and Martha2000), Mon (Thongkum Reference Thongkum1987a), Takhian Thong Chong (DiCanio Reference DiCanio2009), Santa Ana del Valle Zapotec (Esposito Reference Esposito2010b), White Hmong (Keating et al. Reference Keating, Christina, Marc, Sameer ud and Jianjiang2010*, Esposito Reference Esposito2012), Gujarati (Keating et al. Reference Keating, Christina, Marc, Sameer ud and Jianjiang2010*, Khan Reference Khan2012*), Southern Yi (Keating et al. Reference Keating, Christina, Marc, Sameer ud and Jianjiang2010*, Kuang Reference Kuang2011*), and for a small set of data from Chong, Fuzhou, San Lucas Quiaviní Zapotec, Tlacolula Zapotec, and Tamang (Esposito Reference Esposito2006). With the exception of male speakers of Santa Ana del Valle Zapotec (Esposito Reference Esposito2010b), the authors are not aware of any language where H1-H2 is not a successful measure of voice quality. Fewer studies use spectral tilt measures such as H1A1, H1-A2, and H1-A3 to successfully quantify the differences between phonemic phonation types. Example studies include: Jalapa de Díaz Mazatec (Blankenship Reference Blankenship2002); for male speakers of Santa Ana del Valle Zapotec (Esposito Reference Esposito2010b), Gujarati (Khan Reference Khan2012*) and Yi (Kuang Reference Kuang2011*).
2.2 About the languages
2.2.1 !Xóõ
!Xóõ is a Khoisan language spoken by around 4,000 people in southwestern Botswana, and by several hundred in Namibia (Lewis, Simons & Fennig Reference Lewis, Gary and Charles2016). It has five vowel qualities [i e 𝔞 u o], four lexical tones (high, mid, low, and mid-falling) and five phonation types: modal, breathy, creaky, strident, and pharyngealized. Any of these phonation types can occur with any tone. Phonation types in !Xóõ are distinguished by increased spectral noise, H1-H2, and/or other measurements of spectral tilt, depending on the speaker (Ladefoged & Antoñanzas-Barroso Reference Ladefoged and Norma1985, Gordon & Ladefoged Reference Gordon and Peter2001).
2.2.2 Burmese
Burmese is a Sino-Tibetan language of the Tibeto-Burman branch spoken by over 30 million people in Myanmar (Lewis et al. Reference Lewis, Gary and Charles2016). It contrasts four tones: low, high, creaky, and 'killed' (Watkins Reference Watkins2001). The Burmese vowel inventory is analyzed in terms of two partiallyoverlapping sets of vowel qualities which interact with tone: Set 1 vowels [i e ε a u o ɔ ə] occur in orthographically open syllables (low, high, or creaky tones), and Set 2 vowels [I eI ε aI a ʊ oʊ aʊ] in orthographically closed syllables (killed tone, or low, high, or creaky tones with nasalization) (Watkins Reference Watkins2000, Reference Watkins2001).
The low tone is characterized by low intensity and moderate length and the high tone by high intensity, increased duration, and, for some speakers, breathiness. The creaky tone is a falling tone characterized by very high intensity, shorter duration, and higher and more fronted vowel quality. The killed tone is a falling tone with a syllable-final glottal stop, marked by high intensity and the shortest length (Bradley Reference Bradley and David1982). In terms of their phonetic properties, creaky and killed tones are very similar, though they can be distinguished by the gemination of consonants following killed tones (where the final glottal stop assimilates in place and manner to the initial consonant of the next syllable) and by the distribution of vowel qualities over the two tones – only /a/ and /ε/ occur in both creaky and killed tones (see Watkins Reference Watkins2001). Creakiness in Burmese is distinguished by higher jitter values – a measure of aperiodicity in the glottal source – compared to modal phonation (Javkin & Maddieson Reference Javkin and Ian1985).
2.2.3 Gujarati
Gujarati is an Indic language spoken by 45 million people in India, primarily in the state of Gujarat but also in Maharashtra, Rajasthan, Karnataka, Madhya Pradesh, as well as by sizable communities in the United States, Canada, and the United Kingdom (Lewis et al. Reference Lewis, Gary and Charles2016). Gujarati vowels [i e ε a u o ɔ ə] may be produced with either modal or breathy phonation. Breathy vowels are characterized by greater airflow and a higher H1-H2/H1*-H2* value when compared to modal vowels (Fischer-Jørgensen Reference Fischer-Jørgensen1967, Esposito Reference Esposito2006, Khan Reference Khan2012*), though other acoustic measures (i.e. H2*-H4*, H1*-A1*, H1*-A2*, H1*-A3*, cepstral peak prominence, and harmonics-to-noise ratio), are also reliable indicators of phonation type differences (Khan Reference Khan2012*).
2.2.4 Jalapa de Díaz Mazatec
Jalapa de Díaz Mazatec (hereafter Jalapa Mazatec) is an Otomanguean language spoken by approximately 17,000 people in Northern Oaxaca and Veracruz, Mexico (Lewis et al. Reference Lewis, Gary and Charles2016). It contrasts five vowels [i æ u o a], each of which can be lexically oral or nasal, three tones (low, mid, and high), and modal, breathy, and creaky phonation (Kirk, Ladefoged & Ladefoged Reference Kirk, Jenny, Peter, Anthony and Timothy1993, Silverman et al. Reference Silverman, Barbara, Paul and Peter1995, Garellek & Keating Reference Garellek and Patricia2011*). Vowel qualities, tones, and voice qualities are fully cross-classified (Silverman et al. Reference Silverman, Barbara, Paul and Peter1995, Garellek & Keating Reference Garellek and Patricia2011*). Kirk et al. (Reference Kirk, Jenny, Peter, Anthony and Timothy1993) show that creaky phonation is associated with higher F1 values than either modal or breathy phonation. H1-H2/H1*-H2* is a successful measure of phonation in Jalapa Mazatec (Blankenship Reference Blankenship2002, Keating et al. Reference Keating, Christina, Marc, Sameer ud and Jianjiang2010*, Garellek & Keating Reference Garellek and Patricia2011*).
2.2.5 Mon
Mon is a Mon-Khmer language spoken by 800,000 people, primarily in southern Myanmar but also in Thailand (Lewis et al. Reference Lewis, Gary and Charles2016). It contrasts nine vowels [i e ε ə a 𝔞 u o ɔ] along with two registers: a high-level tone with modal phonation, and a low-level tone with breathy phonation. All vowel qualities can occur with both registers, with the exception of [ɔ 𝔞] and the diphthongs [ao 𝔞e], which only occur in the first register (Huffman Reference Huffman1990). There is some dispute over the distinctive phonetic features of these registers, however. Lee (Reference Lee1983) finds the difference to be one of duration and pitch, not phonation. Thongkum (Reference Thongkum1987b, Reference Thongkum1990), however, concludes that phonation type does play a part in the Mon register system; while most speakers use modal phonation for the first register and breathy phonation for the second, some speakers contrast degrees of breathiness (quantified by H1-H2 differences), with the second register more breathy than the first, while others use creaky phonation for the first register and breathy for the second. A more recent study, Abramson, Tiede & Luangthongkum (Reference Abramson, Mark and Therapan2015*), finds that modal and breathy vowels are best distinguished by H1*-H2*, H1*-A2*, H1*-A3* and closed quotient differences (as measured by an electroglottograph).
2.2.6 Santa Ana del Valle Zapotec
Santa Ana del Valle Zapotec is an Otomanguean language spoken in Santa Ana del Valle, Oaxaca, Mexico, classified by The Ethnologue (Lewis et al. Reference Lewis, Gary and Charles2016) as part of the San Juan Guelavía Zapotec subgroup, which has approximately 28,000 speakers; the exact number of Santa Ana del Valle Zapotec speakers is unknown. Santa Ana del Valle Zapotec has six vowels [i e ɨ a u o], each of which can have one of three contrastive phonation types: modal, breathy, or creaky. Tone is contrastive on modal vowels, which may have a high or a rising tone. Breathy and creaky vowels are both produced with a falling tone (Reference EspositoEsposito 2010b). Breathy and creaky vowels are best distinguished by H1-A3 for males and H1-H2 for females (Reference EspositoEsposito 2010b).
2.2.7 White Hmong
White Hmong is a Hmongic language spoken by approximately two million people in Laos, Thailand, Vietnam and southwestern China, and by communities in the United States (Lewis et al. Reference Lewis, Gary and Charles2016). It contrasts [i e a ɔ ɨ ẽ ã ɔ̃] and has seven lexical tones. The contrast between modal, breathy, and creaky phonation plays a part in the tonal system: the rising (45), mid (33), low (22), mid-rising (24), and high-falling (52) tones are modal, while the low-falling (21) tone is creaky and the mid-to-high falling (42) tone is breathy (Smalley Reference Smalley and William1976, Ratliff Reference Ratliff1992, Esposito Reference Esposito2012*).
Phonation type in White Hmong is distinguished by spectral measures (specifically, the amplitudes of the first harmonic (H1*) and H1*-H2*), measurements of periodicity (cepstral peak prominence), and electroglottographic measures (closed quotient and Derivative-EGG Closure Peak Amplitude) (Esposito Reference Esposito2012*).
2.2.8 Yi
Yi, a Tibeto-Burman language, is spoken in the Yunnan, Sichuan and Guizhou provinces of China by approximately two million speakers (Lewis et al. Reference Lewis, Gary and Charles2016). Yi contains seven vowels [i ε a z ə o u], where [z] represents a vowel which has assimilated to the preceding consonant. (While not part of the International Phonetic Alphabet, the symbol has been widely used by Chinese phoneticians – Jianjing Kuang pc, 14 November 2016). In addition, Yi contrasts three tones (high, mid, and low); the mid and low tones are produced with either a lax or tense voice quality. Phonation type contrasts are best distinguished by contact quotient (as measured by an electroglottograph), H1*-H2* and H1*-A1* (Kuang Reference Kuang2011*).
3 Method
3.1 Speakers and speech materials
All data used in this study came from one of three sources: the UCLA Phonetics Lab Archive, an online collection of fieldwork recordings of over 200 languages (http://archive.phonetics.ucla.edu/), the Production and Perception of Linguistic Voice Quality project (http://www.phonetics.ucla.edu/voiceproject/voice.html), or, in the case of Santa Ana del Valle Zapotec, recorded by one of the authors as part of a previous study on phonation type. From the two electronic databases, languages with non-modal phonation types on vowels were selected if (1) data from more than one native speaker were accessible, and (2) if those data were transcribed to indicate voice quality. (This last criterion excluded some languages for which data was available but transcription did not indicate phonation type.) Individual tokens were selected for analysis as part of minimal or near-minimal sets contrasting phonation types. All tokens that fit this criterion were examined. The number of tokens varied across languages; wordlists are available in the appendix. Transcriptions were taken from the source material, unless otherwise noted. Tone and coda consonant were not controlled, but tokens with aspirated onset consonants were excluded because of their tendency to alter voice quality of the following vowel (Garellek & Keating Reference Garellek and Patricia2011*, Esposito & Khan Reference Esposito2012*). Data were either digitally recorded or digitized as part of the archival process (with a 44.1 kHz sampling rate). Tokens were extracted from longer recordings in Audacity (Audacity Team 2014).
3.2 Summary of language data
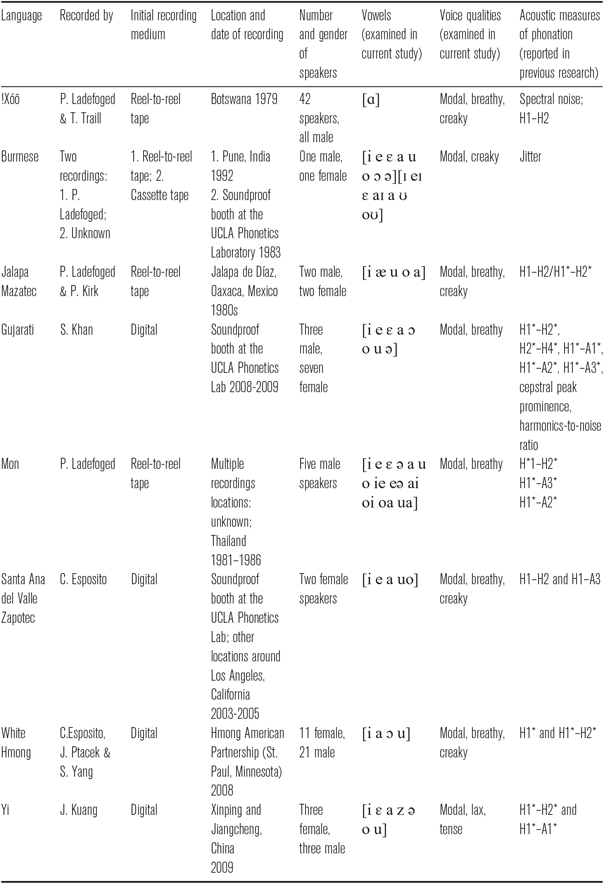
Table 1 summarizes the relevant phonetic information (i.e. the acoustic measures of voice quality) presented in Section 2.2 and provides information on the recordings used for each language, including number of speakers and vowels availableFootnote 5 for study from the audio sources. We do not have access to specific details about the nature of the recordings, such as microphone type, amplifiers and/or filters applied.
Table 1 Table of relevant language data, including both phonetic and recording information.
3.3 Procedure
For each word, the vowel was labeled for vowel quality and phonation type in Praat text grids (Boersma & Weenink Reference Boersma and David2008) according to the transcriptions in the original data, unless otherwise noted in the appendix. The frequency of the first (F1) and second (F2) formants, a measure of spectral balance, H1*-H2*, and a measure of spectral tilt, H1*-A3*, were measured automatically using VoiceSauce (Iseli et al. Reference Iseli, Yen-Liang and Abeer2007, Shue et al. Reference Shue, Patricia, Chad and Kristine2011). (More details on how measurements are calculated in VoiceSauce can be found at http://www.phonetics.ucla.edu/voiceproject/Publications/Shue-etal_2009_ASA-poster.pdf; Shue, Keating & Vicenik Reference Shue, Patricia and Chad2009). Spectral measures were corrected for surrounding formant frequencies and bandwidths (Hanson Reference Hanson1995, Iseli et al. Reference Iseli, Yen-Liang and Abeer2007); corrected harmonic amplitudes are indicated by an asterisk (e.g. H1*-H2*). (See Iseli et al. Reference Iseli, Yen-Liang and Abeer2007 for the spectral magnitude correction formula.) Formant frequencies and their amplitudes were calculated using the Snack Sound Toolkit (Sjölander Reference Sjölander2004). Fundamental frequency (f0) was calculated by the STRAIGHT algorithm (Kawahara, de Cheveigné & Patterson Reference Kawahara, Alain de and Roy1998).
Each acoustic measure was calculated at every millisecond of the target vowel, and then averaged across three timepoints. Analysis was conducted on the timepoints where phonation contrasts were localized in a particular language based on previous research and/or examination of the spectrogram. Care was taken to avoid consonant transitions at the beginning and end of the vowel. For Burmese and Mon, a few diphthongs were included in the analysis because they were available in the recordings. For these diphthongs, only the onglide vowel, which is where the phonation was localized, was measured.
4 Results
4.1 Cross-language results
Two separate linear mixed-effects models were fit to the data using R package lme4 (Bates et al. Reference Bates, Martin, Benjamin and Steven2015) with F1, F2, and phonemic phonation type (modal, breathy, or creaky) as fixed effects and either H1*-H2* or H1*-A3* as the dependent variable. Speaker and language were nested random effects. The log function was used to rescale F1 and F2 measures; hereafter, referred to as log(F1) and log(F2). Results for each measure (H1*-H2* and H1*-A3*) will be discussed separately. (Sex of speaker was not included as a fixed effect. For White Hmong, Yi, Jalapa Mazatec, and Gujarati, previous research (Keating et al. Reference Keating, Christina, Marc, Sameer ud and Jianjiang2010*) shows that there are no significant interactions of phonation with gender for these languages. The Burmese data included only one male and one female speaker, making it difficult to draw a generalization regarding gender differences. The remaining languages in our study – !Xóõ, Mon, and Santa Ana del Valle Zapotec – included data from only one gender.)
4.1.1 H1*-H2*
Using the MuMIn package (Bartoń Reference Bartoń2015), the model showed an adjusted R2 value of .4275 (adjusted R2 = .1313 for fixed effects alone). Random effects (language and speaker) thus predictably accounted for most, but by no means all of the variance (language: std. dev. = 2.132, speaker: std. dev. = 2.800). There was a significant interaction of all fixed effects (p < .05, df = 4, χ 2 = 11.93). The model also contained significant main effects of log(F1) (p < .001, df = 1, χ 2 = 737.09), log(F2) (p = .025, df = 1, χ 2 = 5.00), and phonation type (p < .001, df = 5, χ 2 = 1872.61) on H1*-H2*.
4.1.2 H1*-H2*: log(F1)
There was a significant main effect of log(F1) on H1*-H2* (p < .001), and a significant interaction with phonation type (p < .001). The effect of log(F1) on H1*-H2* is graphed in Figure 1. (For all figures, the labels ‘breathy’, ‘modal’ and ‘creaky’ represent phonemic phonation type, while H1*-H2* values represent phonetic phonation. Thus, what is labeled ‘breathy’ in Figure 1 refers to the phonemic phonation category, not the H1*-H2* value.) For all three phonation types, vowels with higher log(F1) frequencies (i.e. low/open vowels) had lower H1*-H2* values, suggesting a creakier phonation than vowels with lower log(F1) values (i.e. high/closed vowels).

Figure 1 Graph of the effect of the first formant (log (F1), Hz) on H1*-H2* (dB) for three phonation types (breathy (solid black line), creaky (light gray line) and modal (dark gray line)).
4.1.3 H1*-H2*: log(F2)
There was a significant main effect of log(F2) on H1*-H2* (p = .02)Footnote 6 and a significant interaction with phonation type (p < .001). The effect of log(F2) on H1*-H2* is graphed in Figure 2. For all three phonation types, there was a positive relationship between log(F2) and spectral tilt: vowels with greater log(F2) frequencies (i.e. front vowels) had lower spectral tilt values, suggesting a creakier phonation type for front vowels than their non-front counterparts.

Figure 2 Graph of the effect of the second formant (log(F2), Hz) on H1*-H2* (dB) for three phonation types (breathy (solid black), creaky (light gray) and modal (dark gray)). Note: log(F2) frequency increases from left to right.
4.1.4 H1*-A3*
For H1*-A3* the model showed an adjusted R2 value of .6042 (adjusted R2 = .0761 for fixed effects alone). Random effects (speaker and language) thus predictably accounted for most, but by no means all of the variance (speaker: std. dev. = 2.133). There were highly significant interactions of F1:F2 (p < .001, df = 1, χ 2 = 97.75) and F2:Phonation (p < .001, df = 2, χ 2 = 14.39), and a marginally significant interaction of F1:Phonation (p < .05, df = 2, χ 2 = 9.17). The model also contained significant main effects of H1*-A3* for formant values, with only a marginally significant main effect of phonemic phonation type: (F1) (p < .001, df = 1, χ 2 = 106.19), log(F2) (p = .001, df = 1, χ 2 = 90.30), and marginally significant phonation type (p < .05, df = 2, χ 2 = 8.50).
4.1.5 H1*-A3*: log(F1)
There was a significant main effect of log(F1) on H1*-A3* (p < .001). log(F1) was positively correlated with H1*-A3* (β = 133.26), such that low log(F1) values (i.e. high/closed vowels) tended to have lower spectral tilt values. However, given significant interactions of log(F1) with log(F2), the effect size for log(F1) was effectively only sufficiently large when log(F2) values were at the low end of the range (β < 23.79, β < 27.29, and β < 17.24 for breathy, creaky, and modal phonation, respectivelyFootnote 7). When log(F2) was highest, there was essentially no effect of log(F1) (β < −2.85, β < −4.14, and β < −2.73 for breathy, creaky, and modal phonation, respectivelyFootnote 8). The effect of log(F1) on H1*-A3* when log(F2) was low and when log(F2) was high are graphed in Figures 3 and 4, respectively. For all three phonation types, vowels with lower log(F1) frequencies (i.e. high/close vowels) had lower H1*-A3* values, suggesting a creakier phonation than vowels with higher log(F1) values (i.e. low/open vowels), though only when log(F2) values were low.

Figure 3 Graph of the effect of the first formant (log(F1), Hz) on H1*-A3* (dB) for three phonation types (breathy (solid black line), creaky (light gray line) and modal (dark gray line)) when log(F2) values are low.

Figure 4 Graph of the effect of the first formant (log(F1), Hz) on H1*-A3* (dB) for three phonation types (breathy (solid black line), creaky (light gray line) and modal (dark gray line)) when log(F2) values are high.
4.1.6 H1*-A3*: log(F2)
The significant (p < .001) main effect of log(F2) showed a positive relationship with H1*-A3* (β = 103.66); however, considering the range of the data and the interactions in the model, the actual effect was more complex. As with log(F1) above, significant interactions of log(F1) and log(F2) meant that the effect size for log(F2) was much smaller when log(F1) values were low. When log(F1) was at the bottom of the range, log(F2) was positively correlated with H1*-A3* (β < 11.15, β < 12.10, and β < 9.91 for breathy, creaky, and modal phonation, respectivelyFootnote 9). The effect of log(F2) on H1*-A3* when log(F1) is low is graphed in Figure 5. For all three phonation types, vowels with lower log(F2) frequencies (i.e. back vowels) had lower H1*-A3* values, suggesting a creakier phonation than vowels with higher log(F2) values (i.e. front vowels), though this effect was very small, and only applies when log(F1) values were low.
When log(F1) was highest, the effect was reversed, such that log(F2) had a negative effect (β < −28.38, β < −34.54, and β < −19.70 for breathy, creaky, and modal phonation, respectivelyFootnote 10). Vowels with higher log(F2) frequencies (i.e. front vowels) had lower H1*-A3* values, suggesting a creakier phonation than vowels with lower log(F2) values (i.e. back vowels), though only when log(F1) values were high. This interaction is graphed in Figure 6.

Figure 5 Graph of the effect of the second formant (log(F2), Hz) on H1*-A3* (dB) for three phonation types (breathy (solid black line), creaky (light gray line) and modal (dark gray line)) when log(F1) values are low.

Figure 6 Graph of the effect of the second formant (log(F2), Hz) on H1*-A3* (dB) for three phonation types (breathy (solid black line), creaky (light gray line) and modal (dark gray line)) when log(F1) values are high.
4.2 Within-language results
When looking at the relationship between spectral measures and formants (regardless of vowel quality) within a language, there was a negative relationship between log(F1) and H1*-H2* for all languagesFootnote 11 tested (see Figure 7, graph on the left). Vowels with greater log(F1) frequencies had lower H1*-H2* values, more typical of creaky phonation, suggesting that lower/more open vowels within each language were more creaky and less breathy. For the second formant (see Figure 7, graph on the right), all languages except Jalapa Mazatec, for which there was no effect of log(F2) on H1*-H2*, had a negative effect of log(F2) on H1*-H2*, suggesting that front vowels within each of these languages were more creaky and less breathy.

Figure 7 Graphs of the effect of log(F1),Hz) on H1*-H2* (dB) (left), and log(F2),Hz) on H1*-H2* (dB) (right) for Burmese, Gujarati, Jalapa Mazatec, Mon, White Hmong, Santa Ana del Valle Zapotec and Yi.
Moving onto the second acoustic measure, there was a positive relationship between log(F1) and log(F2) and H1*-A3* for all the languages tested except Jalapa Mazatec (see Figure 8). For six of the seven languages tested, vowels with higher log(F1) and higher log(F2) values had H1*-A3* values associated with breathiness. For Jalapa Mazatec, there was a positive relationship between log(F1) and H1*-A3*; however, there was no interaction between log(F2) and H1*-A3*.

Figure 8 Graphs of the effect of log(F1),Hz) on H1*-A3* (dB) (left), and log(F2),Hz) on H1*-A3* (dB) (right) for Burmese, Gujarati, Jalapa Mazatec, Mon, White Hmong, Santa Ana del Valle Zapotec and Yi.
4.3 Language-specific differences in voice quality as a function of vowel quality
In this section, we take a closer look at the results within a subset of the languages studied (Burmese, Jalapa Mazatec, and Santa Ana del Valle Zapotec) to see if vowel quality affects the degree of non-modal phonation. Gujarati, Mon, White Hmong, and Yi were excluded from this part of the study because the relationship between vowel quality and voice quality has already been documented in Khan (2012*), Abramson et al. (Reference Abramson, Mark and Therapan2015*), Esposito (Reference Esposito2012*) and Kuang (Reference Kuang2011*), respectively. !Xóõ was excluded because the data set contains only [𝔞]. We choose to include Jalapa Mazatec in this section because, while it has been the focus of two previous studies on voice quality (Kirk et al. Reference Kirk, Jenny, Peter, Anthony and Timothy1993, Garellek & Keating Reference Garellek and Patricia2011*), neither provided data on phonation type for individual vowel qualities.
Separate two-way repeated measures ANOVAs (one for each language) were performed, with vowel quality and voice quality as independent factors. Results showed that for both H1*-H2* and H1*-A3* there was not a significant difference in phonation due to vowel quality. The individual results for each vowel quality tested in Burmese, Jalapa Mazatec, and Santa Ana del Valle Zapotec are graphed in Figure 9 (H1*-H2*) and Figure 10 (H1*-A3*).

Figure 9 Graphs of the average H1*-H2* (in dB) value for individual vowel qualities in, clockwise from top row: Burmese, Jalapa Mazatec; bottom row: Santa Ana del Valle Zapotec. Vowel qualities are transcribed using the International Phonetic Alphabet along the x-axis. Phonation type is indicated with an 'M' for modal, 'B' for breathy and 'C' for creaky. Error bars are standard error. There was no statistically significant difference in the phonation type between different vowel qualities.

Figure 10 Graphs of the average H1*-A3* (in dB) value for individual vowel qualities in, top row: Burmese, Jalapa Mazatec; bottom row: Santa Ana del Valle Zapotec. Vowel qualities are transcribed using the International Phonetic Alphabet along the x-axis. Phonation type is indicated with an 'M' for modal, 'B' for breathy and 'C' for creaky. Error bars are standard error. There was no statistically significant difference in the phonation type between different vowel qualities.
4.4 Summary
The current study examined phonation types in a wide range of vowels across eight unrelated languages. For the acoustic measure H1*-H2*, results showed a tendency for vowels with higher log(F1) and higher log(F2) values to be creakier, while vowels with lower log(F1) and lower log(F2) values were breathier. These results are represented in Figure 11. This trend holds true even when we collapsed phonation type differences and looked at the relationship between just vowel quality and H1*-H2*. For all languages examined, except Jalapa Mazatec, vowels, regardless of phonemic phonation type, with higher formant frequencies were creakier, while vowels with lower formant frequencies were breathier. For Jalapa Mazatec, there was no interaction between the second formant and the H1*-H2*.

Figure 11 The relationship between vowel quality and voice quality as measured by H1*-H2*. F1 and F2 are indicated with solid-line arrows. H1*-H2* values are indicated with dashed arrows. Vowels with higher formants values have a creakier H1*-H2* value. Vowels with lower formant values display a breathier H1*-H2* value. The Vowel Chart is from the IPA Chart (http://www.internationalphoneticassociation.org/content/ipa-chart, available under a Creative Commons Attribution-Sharealike 3.0 Unported License. Copyright © 2015 International Phonetic Association.)
Results for H1*-A3* were more complicated. For H1*-A3*, results showed a tendency for vowels with higher log(F1) and higher log(F2) values to be breathier, while vowels with lower log(F1) and lower log(F2) values were creakier. However, the relationship between phonemic phonation type and spectral tilt was not highly significant without interactional effects from log(F1) and log(F2). The positive relationship between H1*-A3* and formant frequency held true even when we collapsed phonation type differences and looked at the relationship between just vowel quality and H1*-A3*. Once again, results were different for Jalapa Mazatec, where there was no interaction between the second formant and H1*-A3*.
A question arises as to why Jalapa Mazatec patterned differently from the other languages tested? One reason might be because, in Jalapa Mazatec, voice quality and tone are fully cross-classified, unlike any of the other languages tested.Footnote 12 Perhaps this difference played a role in the results.
In regards to degree of non-modal phonation for a particular vowel quality, we found no significant difference in phonation type due to vowel quality in any of the languages tested for either H1*-H2* or H1*-A3*. Other studies, such as Esposito (Reference Esposito2012*) on White Hmong and Khan (Reference Khan2012*) on Gujarati, show the same pattern: phonation type does not vary as a function of vowel quality. However, this result contrasts with the reported results for Green Mong (Andruski & Ratliff Reference Andruski and Martha2000) and Yi (Kuang Reference Kuang2011*), making these the only two languages reported to have a phonation type difference due to vowel quality. This is particularly interesting given that White Hmong and Green Mong are two mutually intelligible varieties of Hmong, with similar phonation and vowel inventories; thus one might have expected them to pattern the same way.
5 Discussion and conclusion
Why does a relationship between formants and voice quality exist? One reason may be vocal tract length, which effectively alters formant frequency. During breathy phonation, the larynx may be lowered,Footnote 13 lengthening the vocal tract and, thus, lowering formant frequencies. For creaky phonation, on the other hand, the vocal tract is shortened due to a raised larynx (Laver Reference Laver1980) and/or the engagement of the aryepiglottic sphincter (Esling Reference Esling2005). The shorter vocal tract length in turn raises formant frequencies. This explanation fits with the results of this study along the H1*-H2* measure, where vowels with higher formant frequencies are creakier, and vowels with lower formant frequencies are breathier. However, these results do not hold true for H1*-A3*, where results remain more complicated, and in some cases (i.e. in terms of log(F1) when log(F2) is low, and of log(F2) when log(F1) is low) contradict the observed results from H1*-H2*. One reason for this discrepancy could be due to issues with using H1*-A3* as a measure of phonation in these eight languages. While H1*-H2* (or H1H2) has been shown to be a successful measure of phonation type for all of these languages in previous literature (apart from Burmese, for which no studies we are aware of examine H1-H2), H1*-A3* (or H1-A3) has been previously shown to quantify phonation in only three of the languages, Gujarati, Mon, and Santa Ana del Valle Zapotec – and for the latter, only male speakers (Reference EspositoEsposito 2010b). In fact, in looking at Figures 3–5, we see that along the H1*-A3* measure, the three phonation categories do not vary in the expected direction: the breathy phonation category has values that fall in between creaky and modal. However, for H1*-H2* (Figures 1 and 2), the values vary as expected for the three voice qualities – highest for breathy, intermediate for modal, and lowest for creaky. Bearing this in mind, along with the reduced explanatory power of the H1*-A3* model relative to the H1*-H2* model, and the fact that the effects of log(F1) and F2 on H1*-A3* are localized to specific range of values, we take the H1*-H2* measure to be most useful in determining the relationship between vowel quality and voice quality in these languages.
Furthermore, there could be a perceptual benefit to the covariation of phonation type and vowel quality. Evidence supporting this idea comes from two studies examining the effects of phonation type on the perception of vowel quality. In both studies, listeners’ judgements were influenced by phonation type: listeners consistently identified breathier productions of vowels as having higher vowel quality (Lotto, Holt & Kluender Reference Lotto, Lori and Keith1997) and creakier productions as lower (Brunner & Żygis Reference Brunner and Marzena2011). These results are particularly interesting because neither listening group (speakers of English and German, respectively) spoke a language with contrastive phonation, and yet both were still perceptually attuned to the relationship between vowel quality and voice quality seen along the H1*-H2* measure in the present study.
Thus far, the explanations we have presented for the relationship between vowel quality and voice quality assume that changes in phonation type induce changes in vowel quality. However, from the current research, it is unclear which of the two variablesFootnote 14 is the causative one. There is some evidence from historical reconstructions of the register distinction in Mon-Khmer languages that suggests that laryngeal-height specifications that accompany non-modal phonation are the causative variable. In a diachronic account of the origin of register, Huffman (Reference Huffman and Philip1976) proposes a stage where the breathy- and modally-phonated voiced onset consonants are reanalyzed as two separate registers (i.e. breathy and non-breathy). The phonation type of the onset consonant conditions a change in the vowel quality; when the voice quality differences between the registers were lost, the vowel quality distinctions remained.
Regardless of the cause and/or conditioning factor, any account of the relationship between vowel quality and voice quality must address the fact that similar first formant frequencies are reported for breathy and modal vowels in MonFootnote 15 (Thongkum Reference Thongkum1987a), Nyah Kur (Thongkum Reference Thongkum1987b), Kui (Thongkum Reference Thongkum1986), Khmu’ Rawk (Abramson et al. Reference Abramson, Patrick and Therapan2007) and Gujarati (Khan Reference Khan2012*). While the first four of these languages are all Mon-Khmer, the presence of Gujarati – an Indo-European language – on this list indicates that this phenomenon is not simply an isolated areal feature of this language family. One theory that could account for the similar first formant frequencies reported among breathy and modal vowels is that nonmodal phonation types may be produced without changing the size of the vocal tract (e.g. with a neutral laryngeal position); this may explain why we do not see formant frequencies varying as a function of phonation in these five languages. There are many ways to produce non-modal phonation besides varying laryngeal height (including varying pharyngeal width (Traill Reference Traill1985, Samely Reference Samely1991) and/or tongue advancement (see Denning Reference Denning1989 for an overview)), and future research could use articulatory tools to illuminate whether this is the case in these languages.
In conclusion, the results of this study, using data from eight unrelated languages and a wider vocalic inventory than previously investigated, show the following with regards to the interaction of vowel quality and voice quality: First, using the H1*-H2* measure, there exists a clear, cross-linguistic relationship between formant frequency and voice quality, with vowels with higher log(F1) and log(F2) values being creakier, and vowels with lower log(F1) and log(F2) values being breathier. Results are more complicated (and, in some cases, contradictory) for H1*-A3*, though because of the reduced explanatory power of the model using H1*-A3* and the fact that it has only previously been shown to successfully measure phonation type in three of the eight languages examined here, we regard H1*-H2* as the more useful measure in determining the relationship between vowel quality and voice quality. Second, for both H1*-H2* and H1*-A3*, vowel quality was shown not to significantly influence the degree of non-modal phonation in these languages, aligning with previous work on White Hmong (Esposito Reference Esposito2012*) and Gujarati (Khan Reference Khan2012*), but contrasting with reported results for Green Mong (Andruski & Ratliff Reference Andruski and Martha2000) and Yi (Kuang Reference Kuang2011*).
Acknowledgements
We would like to thank Amalia Arvaniti and two anonymous reviewers for their suggestions and insights. We would also like to thank Anja Beth Swoap for her assistance preparing the graphs.
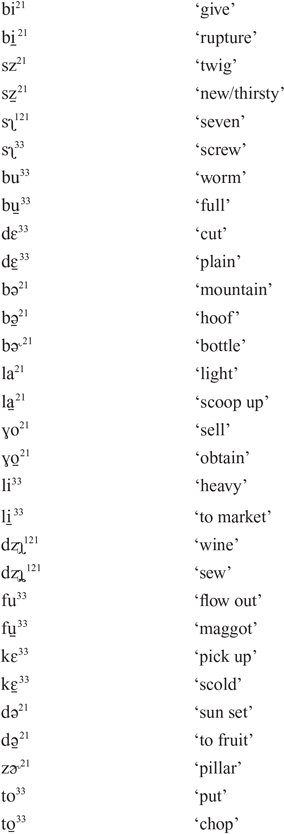
Appendix: Wordlists from the languages examined in the present study
Transcriptions and translations are retained from original wordlists, unless otherwise noted. Token order preserves the order from the source/archive material from which they were taken.
!Xóõ
In the transcription below, [𝔞:] is rendered as <𝔞𝔞>.


Burmese

Gujarati

Jalapa Mazatec

-
Mon
The original handwritten transcription uses [ɑ] in place of [a]; based on the recordings and analogous transcriptions in Huffman (1990), we have changed them to [a] here. The transcription otherwise remains unchanged from the source. In the transcription below, [j] is rendered as <y>.

-
Santa Ana del Valle Zapotec
In the transcription below, a falling tone on a breathy vowel is rendered with a grave accent.

-
White Hmong

-
Yi